

ISPRF: a machine learning model to predict the immune subtype of kidney cancer samples by four genes
- PMID: 34804821
- PMCID: PMC8575581
- DOI: 10.21037/tau-21-650
ISPRF: a machine learning model to predict the immune subtype of kidney cancer samples by four genes
Abstract
Background: Clear cell renal cell carcinoma (ccRCC) is the most common type of renal cell carcinoma (RCC). Immunotherapy, especially anti-PD-1, is becoming a pillar of ccRCC treatment. However, precise biomarkers and robust models are needed to select the proper patients for immunotherapy.
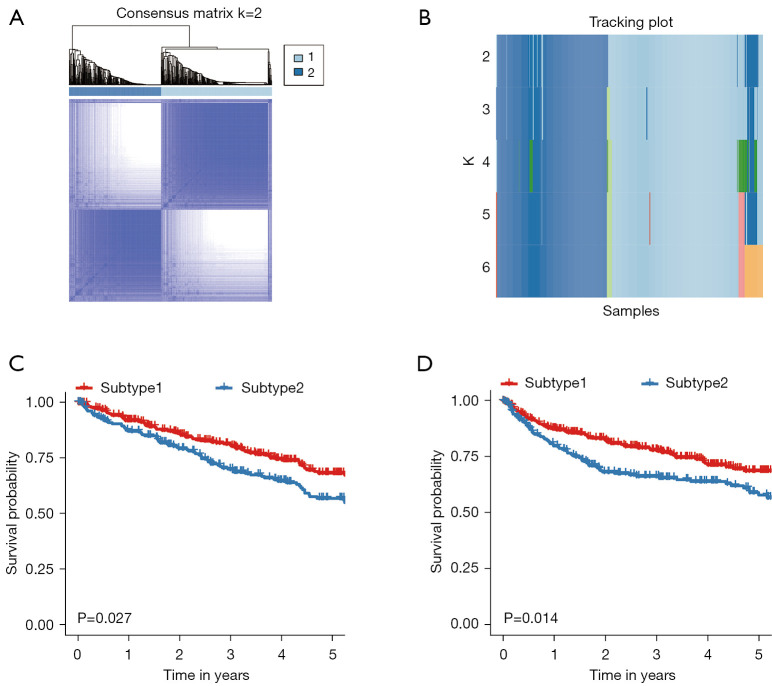
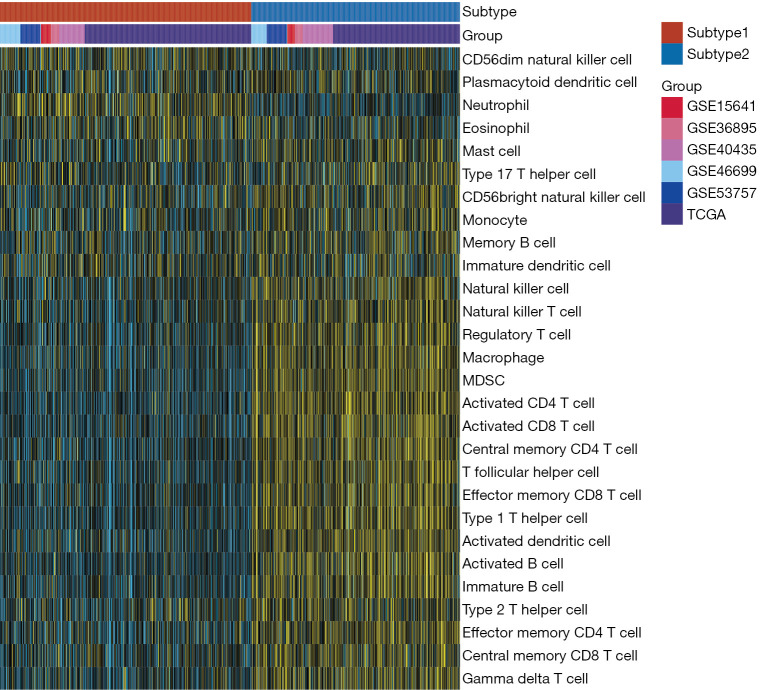
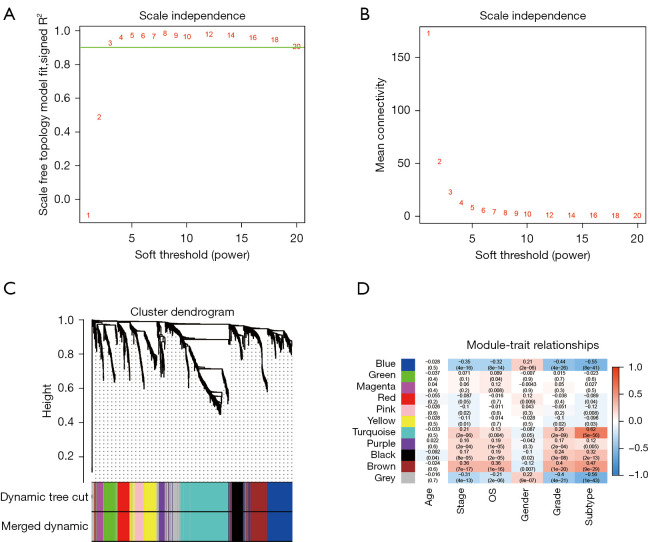
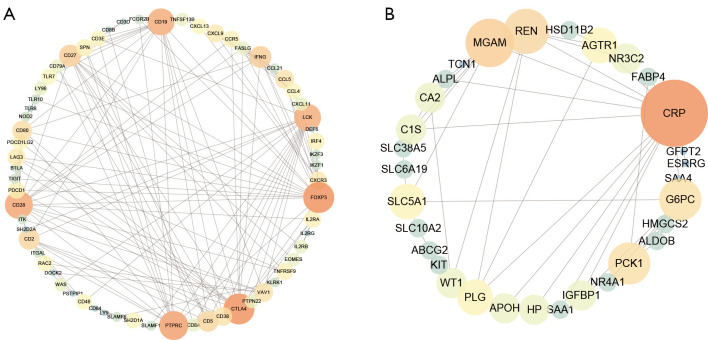
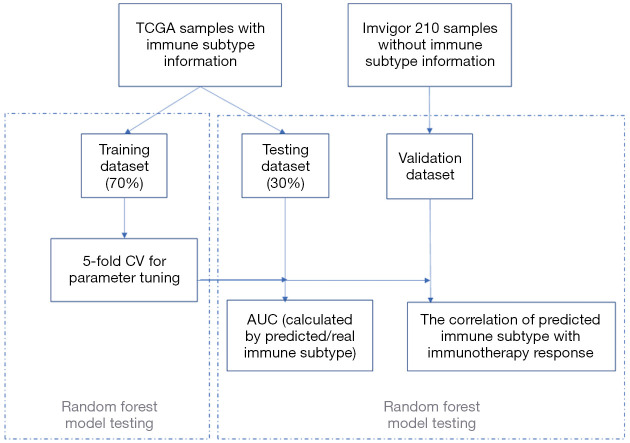
Methods: A total of 831 ccRCC transcriptomic profiles were obtained from 6 datasets. Unsupervised clustering was performed to identify the immune subtypes among ccRCC samples based on immune cell enrichment scores. Weighted correlation network analysis (WGCNA) was used to identify hub genes distinguishing subtypes and related to prognosis. A machine learning model was established by a random forest (RF) algorithm and used on an open and free online website to predict the immune subtype.
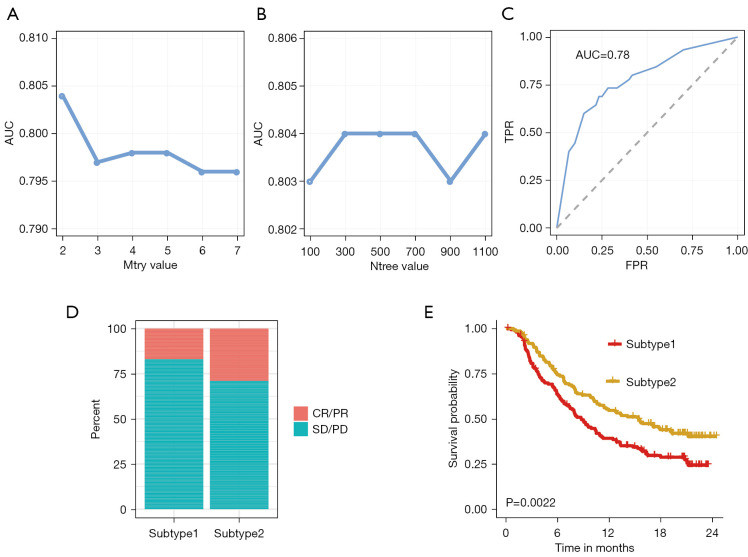
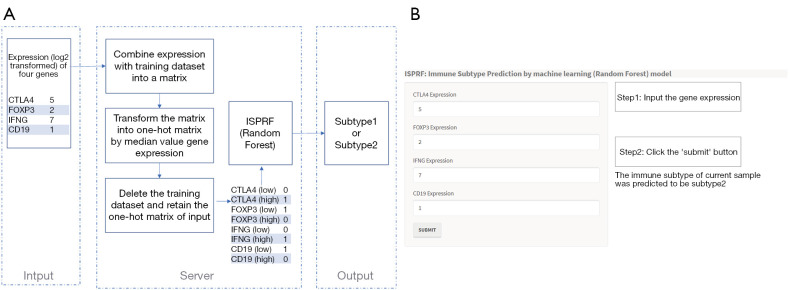
Results: In the identified immune subtypes, subtype2 was enriched in immune cell enrichment scores and immunotherapy biomarkers. WGCNA analysis identified four hub genes related to immune subtypes, CTLA4, FOXP3, IFNG, and CD19. The RF model was constructed by mRNA expression of these four hub genes, and the value of area under the receiver operating characteristic curve (AUC) was 0.78. Subtype2 patients in the independent validation cohort had a better drug response and prognosis for immunotherapy treatment. Moreover, an open and free website was developed by the RF model (https://immunotype.shinyapps.io/ISPRF/).
Conclusions: The current study constructs a model and provides a free online website that could identify suitable ccRCC patients for immunotherapy, and it is an important step forward to personalized treatment.
Keywords: Renal cell carcinoma (RCC); immune subtypes; machine learning; online website.
2021 Translational Andrology and Urology. All rights reserved.
Conflict of interest statement
Conflicts of Interest: All authors have completed the ICMJE uniform disclosure form (available at https://dx.doi.org/10.21037/tau-21-650). The authors have no conflicts of interest to declare.
Figures
Similar articles
-
A Machine Learning Model to Predict the Triple Negative Breast Cancer Immune Subtype.Front Immunol. 2021 Sep 17;12:749459. doi: 10.3389/fimmu.2021.749459. eCollection 2021. Front Immunol. 2021. PMID: 34603338 Free PMC article.
-
Identification of molecular subtypes and diagnostic model in clear cell renal cell carcinoma based on collagen-related genes may predict the response of immunotherapy.Front Pharmacol. 2024 Feb 5;15:1325447. doi: 10.3389/fphar.2024.1325447. eCollection 2024. Front Pharmacol. 2024. PMID: 38375034 Free PMC article.
-
Fifteen hub genes associated with progression and prognosis of clear cell renal cell carcinoma identified by coexpression analysis.J Cell Physiol. 2019 Jul;234(7):10225-10237. doi: 10.1002/jcp.27692. Epub 2018 Nov 11. J Cell Physiol. 2019. PMID: 30417363
-
Identification of a Novel Immune-Related Prognostic Biomarker and Small-Molecule Drugs in Clear Cell Renal Cell Carcinoma (ccRCC) by a Merged Microarray-Acquired Dataset and TCGA Database.Front Genet. 2020 Aug 18;11:810. doi: 10.3389/fgene.2020.00810. eCollection 2020. Front Genet. 2020. PMID: 33014010 Free PMC article.
-
Functional Assessment of Four Novel Immune-Related Biomarkers in the Pathogenesis of Clear Cell Renal Cell Carcinoma.Front Cell Dev Biol. 2021 Mar 16;9:621618. doi: 10.3389/fcell.2021.621618. eCollection 2021. Front Cell Dev Biol. 2021. PMID: 33796525 Free PMC article.
Cited by
-
Comprehensive analysis and identification of subtypes and hub genes of high immune response in lung adenocarcinoma.BMC Pulm Med. 2024 Jul 4;24(1):324. doi: 10.1186/s12890-024-03130-6. BMC Pulm Med. 2024. PMID: 38965571 Free PMC article.
-
Classification of Muscle Invasive Bladder Cancer to Predict Prognosis of Patients Treated with Immunotherapy.J Immunol Res. 2022 May 30;2022:6737241. doi: 10.1155/2022/6737241. eCollection 2022. J Immunol Res. 2022. PMID: 35677536 Free PMC article.
-
A Novel, Simple, and Low-Cost Approach for Machine Learning Screening of Kidney Cancer: An Eight-Indicator Blood Test Panel with Predictive Value for Early Diagnosis.Curr Oncol. 2022 Nov 24;29(12):9135-9149. doi: 10.3390/curroncol29120715. Curr Oncol. 2022. PMID: 36547129 Free PMC article.
-
Identification and Verification of Immune Subtype-Related lncRNAs in Clear Cell Renal Cell Carcinoma.Front Oncol. 2022 Jun 2;12:888502. doi: 10.3389/fonc.2022.888502. eCollection 2022. Front Oncol. 2022. PMID: 35719925 Free PMC article.
-
Construction of an Epithelial-Mesenchymal Transition-Related Model for Clear Cell Renal Cell Carcinoma Prognosis Prediction.Dis Markers. 2022 Aug 9;2022:3780391. doi: 10.1155/2022/3780391. eCollection 2022. Dis Markers. 2022. PMID: 35983409 Free PMC article.
References
-
- Cáceres W, Cruz-Chacón A. Renal cell carcinoma: molecularly targeted therapy. P R Health Sci J 2011;30:73-7. - PubMed
LinkOut - more resources
Full Text Sources