. 2021 Nov 4:11:679173.
doi: 10.3389/fonc.2021.679173. eCollection 2021.

KIF15 Promotes Progression of Castration Resistant Prostate Cancer by Activating EGFR Signaling Pathway

Affiliations

KIF15 Promotes Progression of Castration Resistant Prostate Cancer by Activating EGFR Signaling Pathway

Lin Gao et al. Front Oncol. .

Abstract

Castration-resistant prostate cancer (CRPC) continues to be a major clinical problem and its underlying mechanisms are still not fully understood. The epidermal growth factor receptor (EGFR) activation is an important event that regulates mitogenic signaling. EGFR signaling plays an important role in the transition from androgen dependence to castration-resistant state in prostate cancer (PCa). Kinesin family member 15 (KIF15) has been suggested to be overexpressed in multiple malignancies. Here, we demonstrate that KIF15 expression is elevated in CRPC. We show that KIF15 contributes to CRPC progression by enhancing the EGFR signaling pathway, which includes complex network intermediates such as mitogen-activated protein kinase (MAPK) and phosphatidylinositol 3-kinase (PI3K)/AKT pathways. In CRPC tumors, increased expression of KIF15 is positively correlated with EGFR protein level. KIF15 binds to EGFR, and prevents EGFR proteins from degradation in a Cdc42-dependent manner. These findings highlight the key role of KIF15 in the development of CRPC and rationalize KIF15 as a potential therapeutic target.

Keywords: CRPC; Cdc42; EGFR; KIF15; protein stability.


Conflict of interest statement

The authors declare that the research was conducted in the absence of any commercial or financial relationships that could be construed as a potential conflict of interest.

Figures

Figure 1
Figure 1
KIF15 is overexpressed in CRPC. (A) Expression of KIF15 in primary PCa and CRPC tissues taken from publicly available datasets of GSE32269 (left), GSE35988 (middle) and GSE74367 (right). KIF15 expression was analyzed in a) 22 samples with primary PCa from hormone-naive patients, and 29 samples with CRPC (GSE32269); b) 49 samples with localized PCa, and 27 samples with metastatic CRPC (GSE35988); c) 11 samples with primary PCa tumor and 45 samples with CRPC metastases from 32 patients (GSE74367). The statistical analysis was based on Student’s t test. ****P <0.0001. (B) KIF15 expression in androgen-dependent and independent PCa. KIF15 expression was analyzed in 10 samples with androgen-dependent primary PCa and 10 samples with androgen-independent primary PCa (GSE2443). The statistical analysis was based on Student’s t test. *P <0.05. (C) Unsupervised clustering analyses of GSE35988 (left) and GSE32269 (right) datasets based on differentially expressed genes of primary PCa and CRPC tissues. Patients statue are shown in the annotation column. Patients were categorized according to KIF15 expression or PCa risk assessment. Green: patients with low KIF15 expression (50% cutoff; KIF15-); Purple: patients with high KIF15 expression (50% cutoff; KIF15+); Blue: patients with primary PCa (Primary PCa); Red: patients with CRPC. (D) PCA analysis of unique CRPC-upregulated gene expression pattern between KIF15+ (high KIF15 expression, 50% cutoff) and KIF15- (low KIF15 expression, 50% cutoff) of PCa patients from GSE35988 and GSE32269 datasets. CRPC-upregulated genes were obtained from the top100 high expressed genes in CRPC compared with primary PCa in each dataset. Each point represents a patient. (E) The percentage of KIF15 expression distributed in PCa cases in Qilu Hospital with primary PCa or CRPC. Left panel: representative IHC images for KIF15 expression. Right panel: the percentage of KIF15 expression distributed in 49 PCa cases in Qilu Hospital with primary PCa or CRPC. (F) KIF15 levels in LNCaP and C4-2B cells analyzed by Western blot assay. LNCaP and C4-2B cells were harvested and whole lysates were subjected to Western blot. (G, H) Levels of KIF15 mRNA (G) and protein (H) in LNCaP cells with prolonged androgen-deprivation treatment. qRT-PCR and Western blot analysis were performed to detect KIF15 expression in LNCaP cells after androgen-deprived treatment in charcoal-stripped medium for the indicated time periods. CSS, Charcoal stripped fetal bovine serum; Exp., Expression; *P < 0.05; ***P < 0.001 vs. 0 month.
Figure 2
Figure 2
KIF15 promotes CRPC in vitro and in vivo. (A, B) Cell proliferation of LNCaP cells with FBS or CSS treatment assessed by MTS assays. LNCaP cells were cultured in FBS medium (A) or CSS medium for 48 hours (B), these cells were transfected with corresponding siRNA and subjected to MTS assays. Vec, vector. ***P <0.001; ****P <0.0001. (C, D) Cell proliferation of C4-2B cells with FBS or CSS treatment assessed by MTS assays. C4-2B cells were cultured in FBS medium (C) or CSS medium for 48 hours (D), these cells were transfected with corresponding siRNA and subjected to MTS assays. NC, negative control; *P <0.05; **P < 0.01; ***P <0.001. (E) Cell proliferation of PC3 cells assessed by MTS assays. PC3 cells were transiently transfected with corresponding siRNA, the cells were subjected to MTS assays. **P < 0.01; ***P <0.001. (F–H) Xenograft tumor growth after KIF15 depletion. C4-2B cells with stable KIF15 knockdown or its control were injected subcutaneously into nude mice (6 mice per group). Tumor size was measured twice every week (F). At the endpoint, tumors isolated from euthanized mice were photographed (G) and weighed (H). **P < 0.01; ****P <0.0001. (I) Representative images of Ki67 IHC staining of xenograft tumor derived from C4-2B NC/shKIF15 cells.
Figure 3
Figure 3
KIF15 promotes EGFR expression in PCa. (A) GSEA analysis of EGFR signatures (genes upregulated upon EGFR elevated) from a microarray dataset (GSE35988) that profiled CRPC cases with KIF15_High (the highest 2 samples) or KIF15_Low (the lowest 2 samples) expression. NES = 2.32; P < 0.0001, FDR q < 0.0001. (B) GSEA analysis of EGFR signatures (down-regulated after treatment with EGFR inhibitor) from a microarray dataset (GSE32269) that profiled CRPC cases with KIF15_High (the highest 2 samples) or KIF15_Low (the lowest 2 samples) expression. NES = 2.79; P < 0.0001, FDR q < 0.0001. (C, D) Representative IHC images (C) and quantitative analysis (D) for EGFR and KIF15 expression in PCa cases in Qilu Hospital. KIF15-, negative and weak KIF15 positive tumors examined by IHC staining; KIF15+, moderate and strong KIF15 positive tumors examined by IHC staining; EGFR-, negative and weak EGFR positive tumors examined by IHC staining; EGFR+, moderate and strong EGFR positive tumors examined by IHC staining. (E) Contingency table for KIF15 expression and EGFR status by IHC in primary PCa cases and CRPC cases in Qilu Hospital. (F, G) EGFR protein expression in C4-2B xenograft examined by IHC staining (F) and Western blot (G). (H) EGFR protein expression in LNCaP cells (left) and C4-2B (right) cells. These cells were cultured and passaged in CSS medium or FBS medium for 1 month, and then they were transfected with corresponding expression plasmids for 48 hours or siRNA for 72 hours. Then cells were collected, lysed for Western blot assay. (I, J) The relative mRNA expression of KIF15 and EGFR in LNCaP (I) and C4-2B (J) cells with indicated treatment. LNCaP (I) and C4-2B (J) cells with indicated treatment as (H) were transfected with expression plasmids or siRNAs for 48 hours. The total RNA was extracted, and the mRNA levels of KIF15 and EGFR were determined by qRT-PCR. **P < 0.01; ***P <0.001.
Figure 4
Figure 4
KIF15 activates EGFR signaling in CRPC cells. (A-C) Expression of the key molecules in MAPK and PI3K-AKT signaling pathways determined by Western blot in KIF15-overexpressed or depleted PCa cells with or without 20 ng/ml EGF treatment for 20 minutes. (D) The expression of cell cycle-related proteins, CyclinD1, CyclinE1, and CDK2 determined by Western blot in the indicated PCa cells with KIF15 overexpression or depletion. (E) Expression of the key molecules in MAPK and PI3K-AKT signaling pathways determined by Western blot in KIF15 overexpressed and EGFR depleted LNCaP cells with or without 20 ng/ml EGF treatment for 20 minutes. (F) Cell proliferation of LNCaP cells assessed by MTS assays. LNCaP cells were transiently transfected with the indicated expression plasmids and/or siRNA, and cell proliferation was assessed by MTS assays. **P < 0.01; ***P <0.001.
Figure 5
Figure 5
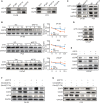
KIF15 forms a protein complex with EGFR and inhibits EGFR degradation through Cdc42 in CRPC cells. (A) Co-IP assays performed to detect the interaction between KIF15 and EGFR in C4-2B and PC3 cells. Protein lysis was collected from C4-2B and PC3 cells to perform co-IP with control IgG or KIF15 or EGFR antibody, followed by Western blot with indicated antibodies. (B) EGFR protein levels determined by immunoblotting. C4-2B (top), PC3 (middle), and LNCaP (bottom) cells were transfected with KIF15 siRNA or KIF15 expression plasmids as indicated. At 24 hours post transfection, cells were then treated with 10 μg/ml CHX and collected at 0, 4, 8, and 12 hours. Western blot assays were performed to analyze EGFR protein levels. *P <0.05; **P < 0.01. (C, D) GTP-Cdc42 levels analyzed by Western blot in C4-2B, PC3 (C), and LNCaP (D) cells with the indicated treatment. C4-2B, PC3, and LNCaP cells were transfected with KIF15 siRNA or KIF15 expression plasmids as indicated. Rho GTPase pulldown assays were performed, and activated Cdc42 (GTP-Cdc42) was measured by Western blot assay. (E–G) EGFR protein expression in LNCaP (E), C4-2B (F), and PC3 (G) cells with the indicated treatment. LNCaP cells were transfected with KIF15 expression plasmids and siRNA against Cdc42 (E), while C4-2B (F), and PC3 (G) cells were transfected with siRNA against KIF15 and Cdc42(T17N) or Cdc42(Q61L) expression plasmids for 48 hours, then were harvested and lysed for Western blot assay.
Figure 6
Figure 6
A putative model illustrating the role of KIF15 in up-regulation of EGFR signaling to promote CRPC. EGFR is ubiquitinated by EGF stimulation and sorted to the endosome, resulting in its degradation in lysosomes. KIF15 blocks EGFR from undergoing lysosomal degradation by activating Cdc42 and increases EGFR recycling back to the cell membrane. The MAPK/ERK and PI3K/AKT signaling pathways are activated, both of which can promote the proliferation and invasion of CRPC cells.

Similar articles

Cited by

References

    1. Balk SP. Androgen Receptor Functions in Prostate Cancer Development and Progression. Asian J Androl (2014) 16(4):561–4. doi: 10.4103/1008-682X.126396 - DOI - PMC - PubMed
    1. Scher HI, Fizazi K, Saad F, Taplin ME, Sternberg CN, Miller K, et al. . Increased Survival With Enzalutamide in Prostate Cancer After Chemotherapy. N Engl J Med (2012) 367(13):1187–97. doi: 10.1056/NEJMoa1207506 - DOI - PubMed
    1. Chen X, Li Q, Liu X, Liu C, Liu R, Rycaj K, et al. . Defining a Population of Stem-Like Human Prostate Cancer Cells That Can Generate and Propagate Castration-Resistant Prostate Cancer. Clin Cancer Res (2016) 22(17):4505–16. doi: 10.1158/1078-0432.CCR-15-2956 - DOI - PMC - PubMed
    1. Kregel S, Kiriluk KJ, Rosen AM, Cai Y, Reyes EE, Otto KB, et al. . Sox2 is an Androgen Receptor-Repressed Gene That Promotes Castration-Resistant Prostate Cancer. PloS One (2013) 8(1):e53701. doi: 10.1371/journal.pone.0053701 - DOI - PMC - PubMed
    1. Huang Y, Jiang X, Liang X, Jiang G. Molecular and Cellular Mechanisms of Castration Resistant Prostate Cancer (Review). Oncol Lett (2018) 15(5):6063–76. doi: 10.3892/ol.2018.8123 - DOI - PMC - PubMed