. 2021 Nov 5:11:746951.
doi: 10.3389/fonc.2021.746951. eCollection 2021.

Database-Guided Analysis for Immunophenotypic Diagnosis and Follow-Up of Acute Myeloid Leukemia With Recurrent Genetic Abnormalities

Affiliations

Database-Guided Analysis for Immunophenotypic Diagnosis and Follow-Up of Acute Myeloid Leukemia With Recurrent Genetic Abnormalities

Carmen-Mariana Aanei et al. Front Oncol. .

Abstract

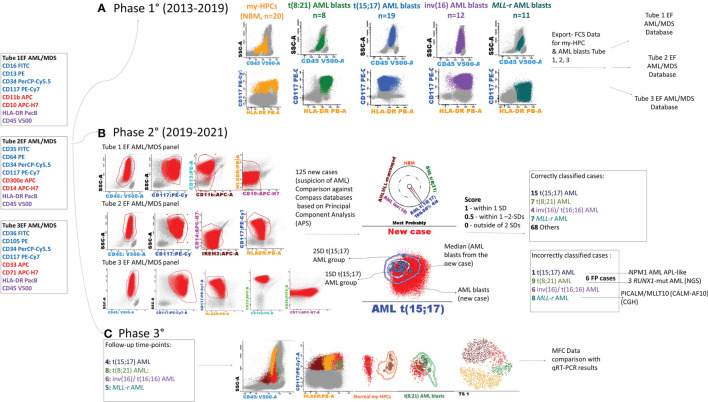
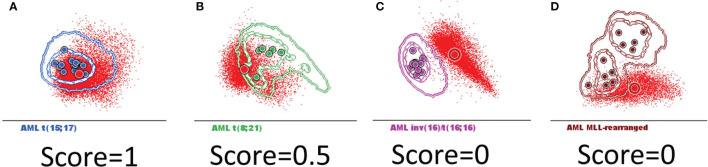
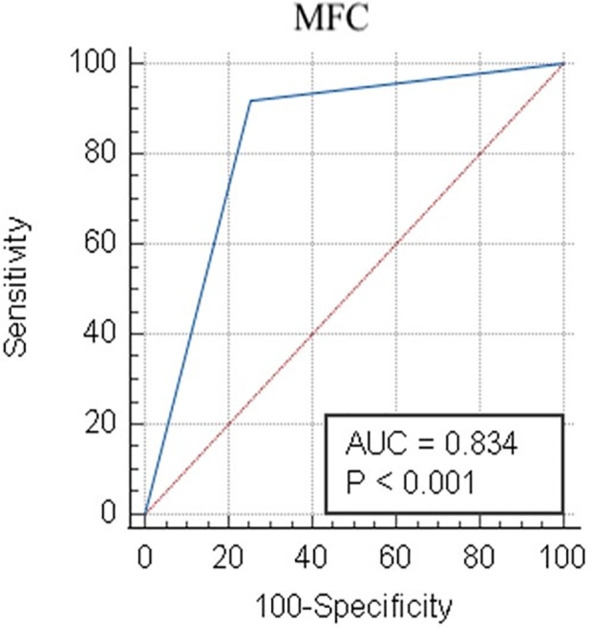
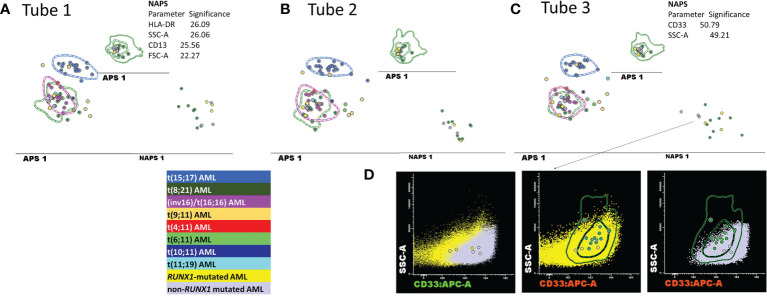
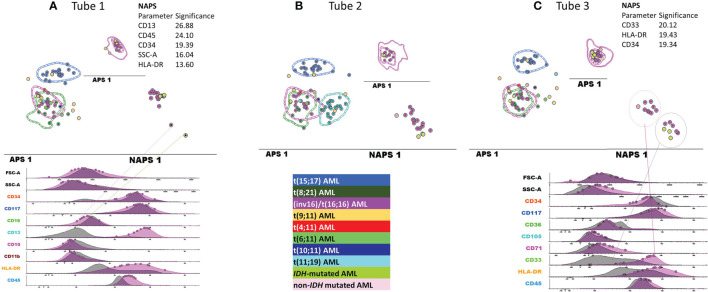
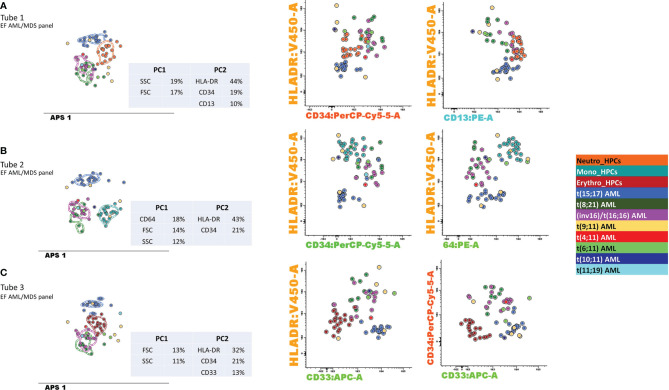
Acute myeloid leukemias (AMLs) are hematologic malignancies with varied molecular and immunophenotypic profiles, making them difficult to diagnose and classify. High-dimensional analysis algorithms might increase the utility of multicolor flow cytometry for AML diagnosis and follow-up. The objective of the present study was to assess whether a Compass database-guided analysis can be used to achieve rapid and accurate diagnoses. We conducted this study to determine whether this method could be employed to pilote the genetic and molecular tests and to objectively identify different-from-normal (DfN) patterns to improve measurable residual disease follow-up in AML. Three Compass databases were built using Infinicyt 2.0 software, including normal myeloid-committed hematopoietic precursors (n = 20) and AML blasts harboring the most frequent recurrent genetic abnormalities (n = 50). The diagnostic accuracy of the Compass database-guided analysis was evaluated in a prospective validation study (125 suspected AML patients). This method excluded AML associated with the following genetic abnormalities: t(8;21), t(15;17), inv(16), and KMT2A translocation, with 92% sensitivity [95% confidence interval (CI): 78.6%-98.3%] and a 98.5% negative predictive value (95% CI: 90.6%-99.8%). Our data showed that the Compass database-guided analysis could identify phenotypic differences between AML groups, representing a useful tool for the identification of DfN patterns.

Keywords: Compass database-guided analysis; acute myeloid leukemia with recurrent genetic abnormalities; different-from-normal (DfN) approach; measurable (minimal) residual disease; multicolor flow cytometry.


Conflict of interest statement

The authors declare that the research was conducted in the absence of any commercial or financial relationships that could be construed as a potential conflict of interest.

Figures

Figure 1
Figure 1
Schematic overview of the study. The first three tubes of the EuroFlow (EF) AML/MDS antibody panel were used for the discrimination of acute myeloid leukemia (AML) blasts and normal myeloid-committed hematopoietic precursors (my-HPCs) in bone marrow aspirates obtained from patients with AML and healthy individuals. (A) Phase 1: Construction of the databases. The Compass databases were composed of fcs-exported files corresponding to leukemic blasts from well-classified AML cases, according to the WHO diagnostic recommendations, including t(8;21) AML (n = 8), t(15;17) AML (n = 19), inv(16)/t(16;16) AML (n = 12), AML with MLL gene translocations (MLL-r AML, n = 11), and normal my-HPCs (n = 20). (B) Phase 2: Samples from 125 patients with suspected AML were compared against the Compass databases based on APS plots. The blast events from each individual AML case were compared against each well-classified AML group and with the normal my-HPC populations using balanced APS plots. The similarity between blast events from the new case and any defined populations was scored based on the position of the median from the new case relative to the 1 and 2 standard deviation (SD) curves for the defined AML groups or normal my-HPC groups included in the database. A total of 101 cases were correctly classified, whereas 24 cases were incorrectly assigned to the wrong AML group or to the other group. The incorrectly assigned t(15;17) AML case was an NPM1 + AML with an acute promyelocytic leukemia (APL)-like phenotype; the three false-positive t(8;21) AML cases were RUNX1-mutant AML cases, and for the false-positive MLL-r AML case, the array-comparative genomic hybridization (CGH) analysis identified a PICALM/MLLT10 (CALM-AF10) fusion gene. (C) Phase 3: Evaluation of the Compass database-guided DfN analysis. Immunophenotypic data acquired at different MRD follow-up time points from four AML patients with different genetic abnormalities who were in cytological remission were used, including one MLL-r AML case, one t(8;21) AML case, one t(15;17) AML case, and one inv(16) AML case. Compass database-guided analysis was compared against quantitative reverse transcription–polymerase chain reaction (qRT-PCR).
Figure 2
Figure 2
The analysis strategy for the identification of normal myeloid-committed HPCs using Tubes 1–3 of the EF AML/MDS panel. The discrimination of normal my-HPCs was performed by Infinicyt 2.0 software, based primarily on the backbone markers CD117, human leukocyte antigen-DR (HLA-DR), and CD45. Several exclusion gates were used to avoid the inclusion of undesirable events that may fall into the blast gate, such as CD11b+ hypogranular neutrophils and basophils (Tube 1), CD14+low granulocytes and CD14+ CD300e (IREM-2)+ monocytes (Tube 2), and CD10+ hematogones (Tube 1). Bivariate dot plot histograms illustrating the HPCs committed toward a neutrophil lineage (CD45+low/intCD117+CD34+/−HLA-DR+intCD13+CD14 IREM2CD33+CD36; orange dots), a monocyte lineage (CD45+low/intCD117+CD34+/−HLA-DR+highCD64+CD14CD300e/IREM-2CD13+CD33+; green dots), or an erythroid lineage (CD45+low/−CD117+CD34+/−HLA-DR+low/intCD36+CD105+CD33CD35+low; dark-red dots). The other bone marrow cells are displayed in gray. (A) tube 1 EF AML/MDS panel; (B) tube 2 EF AML/MDS panel, (C) tube 3 EF AML/MDS panel.
Figure 3
Figure 3
Gating strategy for the selection of AML blasts using tubes 1–3 of the EF AML/MDS panel. AML blasts were selected based on the expression of backbone markers, CD117, human leukocyte antigen-DR (HLA-DR), and CD45+low. Several exclusion gates were used to avoid the inclusion of undesirable events that may fall into the blast gate, such as CD11b+ hypogranular neutrophils and basophils (tube 1), CD14+low granulocytes and CD14+CD300e (IREM-2)+ monocytes (tube 2), and CD10+ hematogones (tube 1). Bivariate dot plots illustrating a representative example of AML blast identification using the antibody combinations from tubes 1–3 of the EF AML/MDS panel. AML blasts (red dots), other singlet events (gray dots). (A) tube 1 EF AML/MDS panel; (B) tube 2 EF AML/MDS panel, (C) tube 3 EF AML/MDS panel.
Figure 4
Figure 4
The scoring system used to determine whether AML blasts from a new case can be classified in the defined AML groups harboring recurrent genetic abnormalities that were included in the Compass databases. Acute myeloid leukemia (AML) blasts from a new case (red dots and circles) were compared with the AML groups included in the databases: t(15;17) AML (blue), t(8;21) AML (green), inv(16)/t(16;16) AML (violet), and MLL-r AML (dark red). The circles represent the median values of individual cases. The dotted line represents the 1 standard deviation (SD) curve, and the solid line represents the 2 SD curve for the AML group. The similarity between the two populations was scored based on the position of the median for the new case blast events relative to the 1 and 2 SD curves for the AML groups that were included in the database: (A) falling within 1 SD was scored as 1 point; (B) falling within 1–2 SDs was scored as 0.5 points; and (C, D) falling outside of 2 SDs was scored as 0 points.
Figure 5
Figure 5
Receiver operator characteristic evaluation of the performance of the Compass database-guided analysis for the correct classification of AML cases. Receiver operating characteristic (ROC) curve (blue line) comparing the results of the Compass database-guided analysis with those provided by FISH or PCR tests. The red diagonal line represents a random classifier. AML, acute myeloid leukemia; MFC, multicolor flow cytometry; AUC, area under the curve.
Figure 6
Figure 6
Detailed evaluation of the false-positive t(8;21) AML cases. (A–C) APS plots showing the perfect overlap between the medians for the blast events from the false-positive t(8;21) AML cases (bright yellow and mauve circles) with those for the t(8;21) AML group (green circles, the dotted line represents the 1 standard deviation (SD) curve for the group) and for the inv(16)/t(16;16) AML group (violet circles, the dotted line represents the 1 SD curve of the group) using the first three tubes of the EF AML/MDS panel. In the tube 3 of EF AML/MDS panel, the neighborhood automatic population separator (NAPS) diagrams allow for the division of false-positive t(8;21) AML cases into two groups, according to the presence (bright yellow circles) or absence (mauve circles) of RUNX1 mutation according to NGS analysis. The tables show the contributions of each parameter to the separation of the false-positive t(8;21) AML blasts from the t(8;21) AML group in the NAPS diagrams, reflected as percentages. (D) Bivariate dot plots illustrating the differences in the CD33 and SSC parameters between RUNX1-mutated cases (yellow dots and circles representing the median CD33 expression for an individual case) and RUNX1 nonmutated cases (mauve dots and circles representing the median CD33 expression for an individual case) compared with t(8;21) AML cases (green circles representing the median CD33 expression for an individual case; the dotted line represents the 1 SD curve, and the solid line represents the 2 SD curve for the AML group).
Figure 7
Figure 7
Detailed evaluation of the false-positive inv(16)/t(16;16) AML cases. APS plots showing the overlap between the medians for the blast events from the false-positive inv(16)/t(16;16) AML cases (green-yellow, IDH mutated and pale rose circles, non-IDH mutated) with those for the inv(16)/t(16;16) AML group (violet circles, the dotted line represents the 1 standard deviation (SD) curve for the group), the t(8;21) AML group (green circles, the dotted line represents the 1 SD curve for the group) using the first three tubes of the EF AML/MDS panel (A) tube 1 EF AML/MDS panel; (B) tube 2 EF AML/MDS panel, (C) tube 3 EF AML/MDS panel.
Figure 8
Figure 8
Contribution of markers to the separation of blasts from different AML groups with recurrent genetic abnormalities and myeloid-committed normal HPCs. Samples were stained with antibodies from tubes 1–3 of the EuroFlow (EF) acute myeloid leukemia (AML)/myelodysplastic syndrome (MDS) panel. Bivariate dot plots and principal component analysis (APS) diagrams for 20 neutrophil-committed HPCs (orange), 20 monocyte-committed HPCs (turquoise), 20 erythroidcommitted HPCs (dark red), 19 t(15;17) AML cases (blue), 8 t(8;21) AML cases (dark green), 13 inv(16)/t(16;16) AML cases (violet), 5 t(19;11) AML cases (yellow), 1 t(4;11) AML cases (red), 3 t(6;11) AML cases (light green), 1 t(10;11) AML cases (dark blue), and 2 t(11;19) AML cases (light blue). showed good separation between neutrophil-committed HPCs and AML blasts using tube 1 of the EF AML/MDS panel, based on HLA-DR, CD34, and CD13 expression; between monocyte-committed HPCs and AML blasts using tube 2 of the EF AML/MDS panel, based on CD64, HLA-DR, and CD34 expression and between erythroid-committed HPCs and AML blasts using tube 3 of the EF AML/MDS panel, based on HLA-DR, CD34, and CD33 expression. The circles represent the median values of the blast events for an individual case. The dotted line represents the 1 standard deviation (SD) curve for the group, and the solid line represents the 2 SD curve. The tables show the contributions of each parameter to the first (PC1, x-axis) or second (PC2, y-axis) principal components, reflected as percentages. (A) tube 1 EF AML/MDS panel; (B) tube 2 EF AML/MDS panel, (C) tube 3 EF AML/MDS panel.

Similar articles

Cited by

References

    1. Swerdlow SH, Campo E, Pileri SA, Lee Harris N, Stein H, Siebert R, et al. . The 2016 Revision of the World Health Organization Classification of Lymphoid Neoplasms. Blood (2016) 127:2375–90. doi: 10.1182/blood-2016-01-643569 - DOI - PMC - PubMed
    1. Voso MT, Ottone T, Lavorgna S, Venditti A, Maurillo L, Lo-Coco F, et al. . MRD in AML: The Role of New Techniques. Front Oncol (2019) 2:655. doi: 10.3389/fonc.2019.00655 - DOI - PMC - PubMed
    1. Schuurhuis GJ, Heuser M, Freeman S, Béné M-C, Buccisano F, Clooset J, et al. . Minimal/measurable Residual Disease in AML: A Consensus Document From the European LeukemiaNet MRD Working Party. Blood (2018) 131(12):1275–91. doi: 10.1182/blood-2017-09-801498 - DOI - PMC - PubMed
    1. Brooimansa RA, van der Velden VHJ, Boeck N, Slomp J, Preijers F, te Marvelde JG, et al. . Immunophenotypic Measurable Residual Disease (MRD) in Acute Myeloid Leukemia: Is Multicentric MRD Assessment Feasible? Leukemia Res (2019) 76:39–47. doi: 10.1016/j.leukres.2018.11.014 - DOI - PubMed
    1. van Dongen J, Lhermitte L, Böttcher S, Almeida J, van der Velden VHJ, Flores-Montero J, et al. . EuroFlow Antibody Panels for Standardised N-Dimensional Flow Cytometric Immunophenotyping of Normal, Reactive and Malignant Leukocytes. Leukemia (2012) 26:1908–75. doi: 10.1038/leu.2012.120 - DOI - PMC - PubMed

LinkOut - more resources