. 2021 Nov 5:11:752933.
doi: 10.3389/fonc.2021.752933. eCollection 2021.

Mitotic Errors Promote Genomic Instability and Leukemia in a Novel Mouse Model of Fanconi Anemia

Affiliations

Mitotic Errors Promote Genomic Instability and Leukemia in a Novel Mouse Model of Fanconi Anemia

Donna M Edwards et al. Front Oncol. .

Abstract

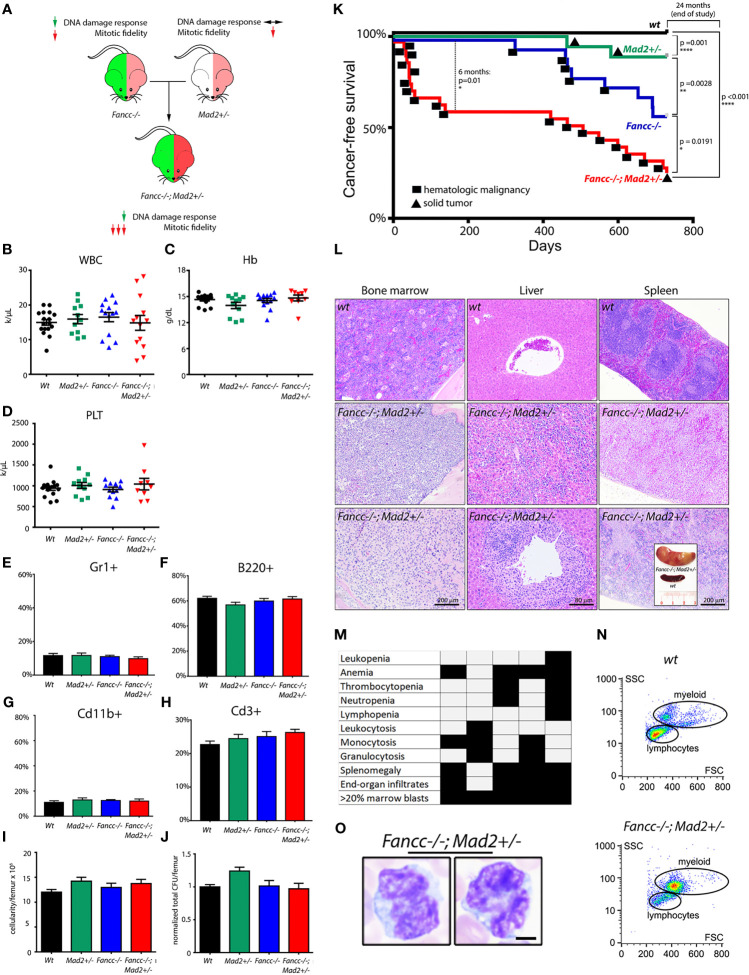
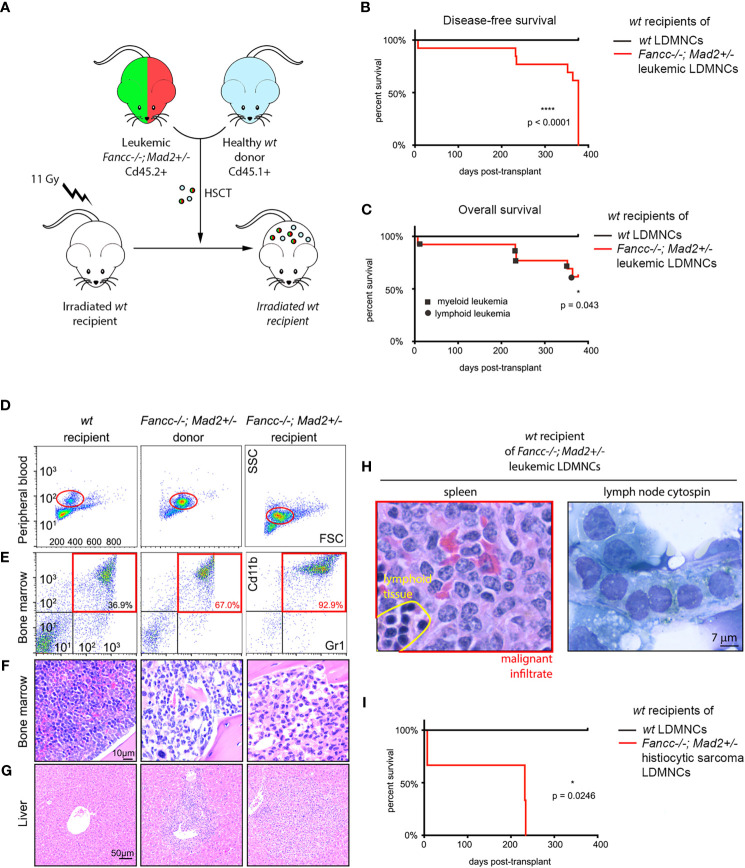
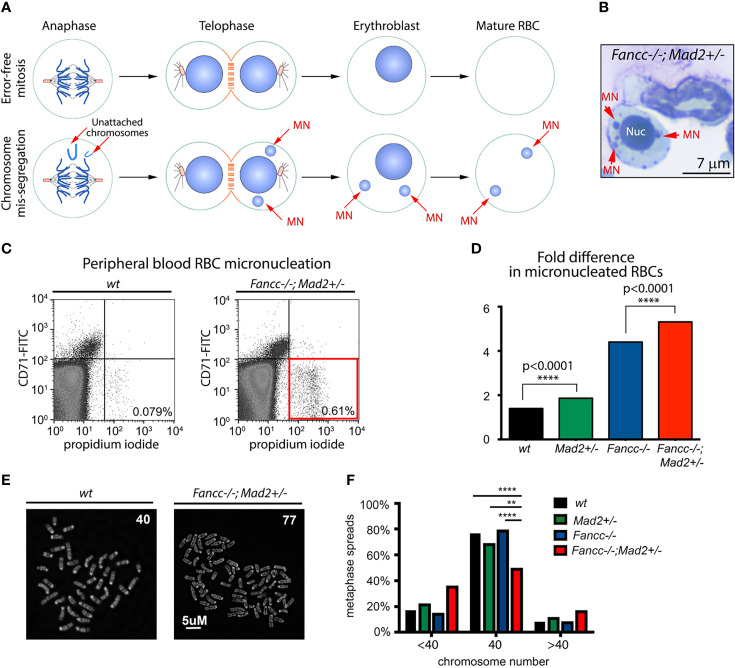
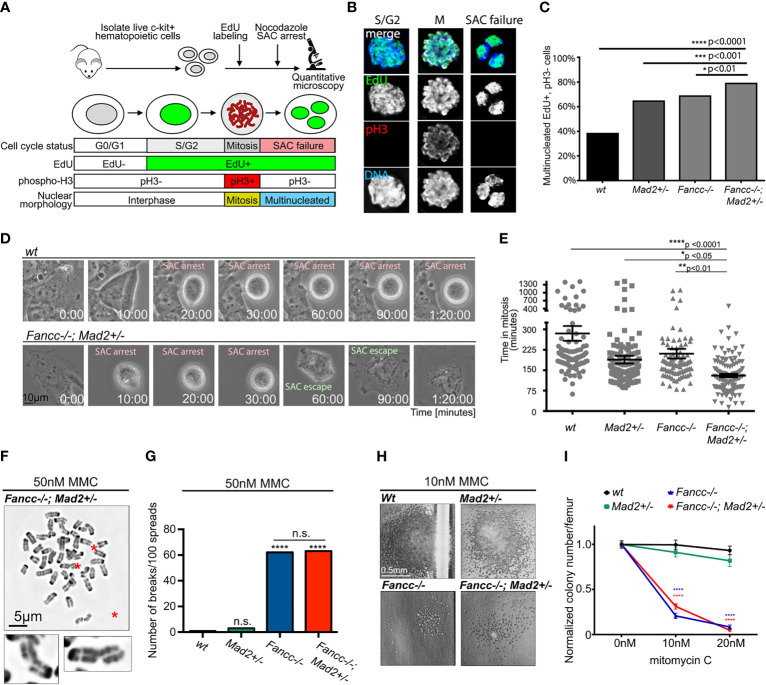
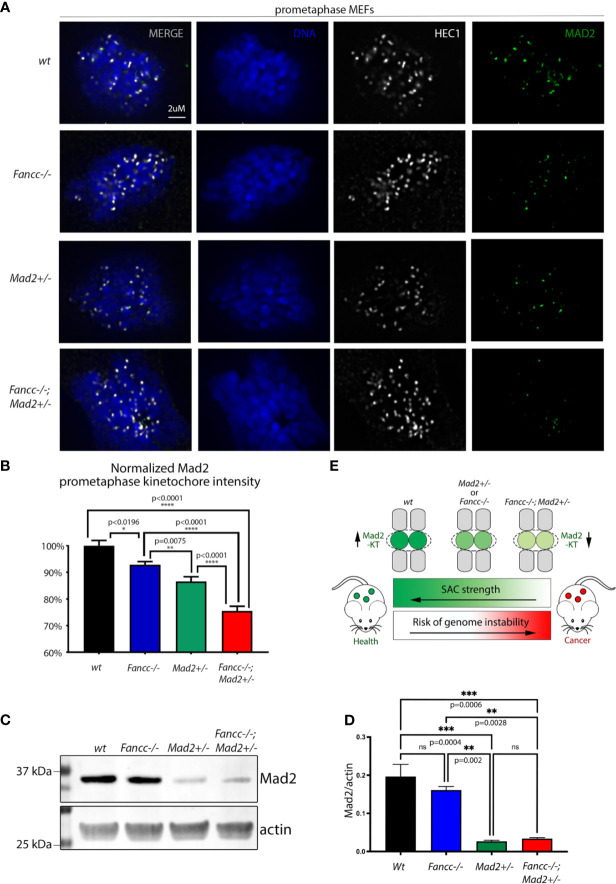
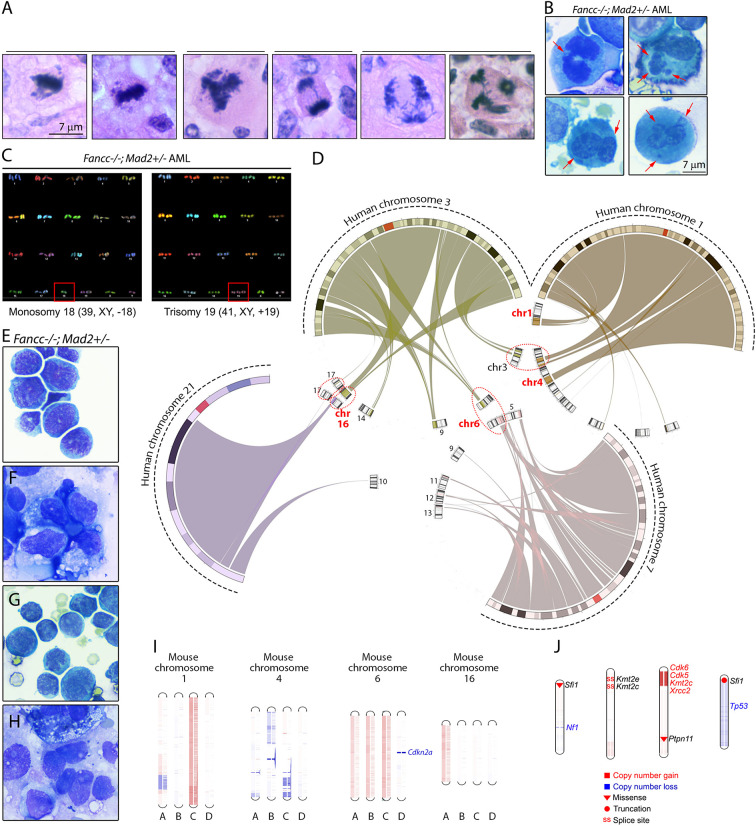
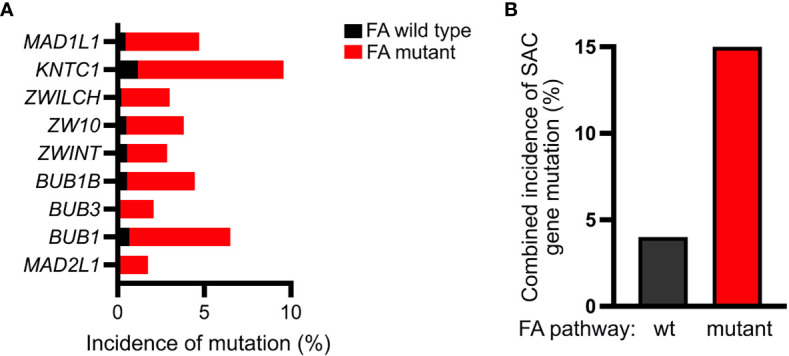
Fanconi anemia (FA) is a disease of genomic instability and cancer. In addition to DNA damage repair, FA pathway proteins are now known to be critical for maintaining faithful chromosome segregation during mitosis. While impaired DNA damage repair has been studied extensively in FA-associated carcinogenesis in vivo, the oncogenic contribution of mitotic abnormalities secondary to FA pathway deficiency remains incompletely understood. To examine the role of mitotic dysregulation in FA pathway deficient malignancies, we genetically exacerbated the baseline mitotic defect in Fancc-/- mice by introducing heterozygosity of the key spindle assembly checkpoint regulator Mad2. Fancc-/-;Mad2+/- mice were viable, but died from acute myeloid leukemia (AML), thus recapitulating the high risk of myeloid malignancies in FA patients better than Fancc-/-mice. We utilized hematopoietic stem cell transplantation to propagate Fancc-/-; Mad2+/- AML in irradiated healthy mice to model FANCC-deficient AMLs arising in the non-FA population. Compared to cells from Fancc-/- mice, those from Fancc-/-;Mad2+/- mice demonstrated an increase in mitotic errors but equivalent DNA cross-linker hypersensitivity, indicating that the cancer phenotype of Fancc-/-;Mad2+/- mice results from error-prone cell division and not exacerbation of the DNA damage repair defect. We found that FANCC enhances targeting of endogenous MAD2 to prometaphase kinetochores, suggesting a mechanism for how FANCC-dependent regulation of the spindle assembly checkpoint prevents chromosome mis-segregation. Whole-exome sequencing revealed similarities between human FA-associated myelodysplastic syndrome (MDS)/AML and the AML that developed in Fancc-/-; Mad2+/- mice. Together, these data illuminate the role of mitotic dysregulation in FA-pathway deficient malignancies in vivo, show how FANCC adjusts the spindle assembly checkpoint rheostat by regulating MAD2 kinetochore targeting in cell cycle-dependent manner, and establish two new mouse models for preclinical studies of AML.

Keywords: FANCC; Fanconi anemia; genomic instability; leukemia; spindle assembly checkpoint.


Conflict of interest statement

The authors declare that the research was conducted in the absence of any commercial or financial relationships that could be construed as a potential conflict of interest.

Figures

Figure 1
Figure 1
Fancc-/-; Mad2+/- mice suffer from premature death and abnormal hematopoiesis. (A) Experimental design. Mad2 heterozygosity in Fancc-/- background is hypothesized to exacerbate mitotic abnormalities but not DNA damage repair response. Normal total white blood count (B), hemoglobin (C), platelet count (D), percentage of Cd11b+ and Gr1+ myeloid cells (E, G) and B220+ and Cd3+ lymphoid cells (F, H) in the peripheral blood of healthy-appearing Fancc-/-; Mad2+/- mice compared to age/sex-matched wt, Mad2+/- and Fancc-/- mice at 2-3 months of age. Well-appearing 16-week old Fancc-/-; Mad2+/- mice had the same bone marrow cellularity (I) and were able to form the same number of colonies in methylcellulose-based colony forming assays supplemented with progenitor growth factors (see Methods) (J) as age/sex-matched wt, Fancc-/- and Mad2+/- controls. Statistical analysis was performed by one-way ANOVA with Dunnett’s multiple comparison correction. No statistically significant differences were found. (K) Decreased cancer-free survival in Fancc-/-; Mad2+/- mice compared to wt, Mad2+/- and Fancc-/- age/sex-matched controls. Kaplan-Meier curves with p values determined by log-rank Mantel-Cox tests at 6-month and 24-month time points (n≥17 mice per genotype) are shown. Squares denote death due to hematopoietic malignancies; circles represent deaths from solid tumors. (L) Bone marrow, liver, and spleen infiltrates in representative Fancc-/-; Mad2+/- mice compared to wt controls. Insert (lower right) shows nodular splenomegaly in a representative leukemic Fancc-/-; Mad2+/- mouse. (M) Histopathological evidence of findings consistent with leukemia in five representative Fancc-/-; Mad2+/- mice. (N) flow cytometry demonstrating increased populations of large myeloid cells in a representative moribund Fancc-/-; Mad2+/- mouse. (O) Large myeloid blast cells, characterized by increased nucleus-to-cytoplasm ratio, irregular nuclei, and open chromatin from the peripheral blood. *p < 0.05, **p < 0.01, ****p < 0.0001.
Figure 2
Figure 2
Lethal hematopoietic malignancy in wt mice transplanted with marrows of moribund Fancc-/-; Mad2+/- mice. (A) Experimental design of competitive hematopoietic cell transplantation. (B) Disease-free survival (p<0.0001) and (C) overall survival (p=0.043) of wt recipients transplanted with bone marrows of indicated genotypes, n =8 recipients of wt donor marrow and n=13 recipients of marrow from leukemic Fancc-/-; Mad2+/- donors. Statistical significance was calculated via log-rank Kaplan-Meier Mantel-Cox tests. (D–G) Comparison of peripheral blood and marrow flow cytometry, bone marrow and liver morphology in a wt mouse, Fancc-/-; Mad2+/- donor and wt recipient of Fancc-/-; Mad2+/- marrow. (D, E) Myeloid marker flow cytometry, (F) evaluation of bone marrow architecture and (G) liver infiltrates demonstrating similar immunophenotype and histopathologic findings in leukemic donor and recipients. (H) Malignant cell infiltration of lymph nodes and spleen in a representative moribund transplant recipient. (I) Survival of three recipient mice transplanted with bone marrow from a Fancc-/-; Mad2+/- donor mouse (p=0.0246). Statistical significance was determined with log-rank Kaplan-Meier Mantel-Cox tests. *p < 0.05, ****p < 0.0001.
Figure 3
Figure 3
Spontaneous chromosomal instability in Fancc-/-; Mad2+/- mice. (A) Graphic illustrating the rationale of the quantitative red blood cell (RBC) micronucleation flow cytometry assay. Unlike normal nuclei, micronuclei (MN) arising from mitotic chromosome mis-segregation are not efficiently removed from maturing erythroblasts and therefore, DNA-positive mature RBCs signify abnormal chromosome sorting during erythropoiesis. (B) Example of a micronucleated cell in Fancc-/-; Mad2+/- bone marrow. Red arrows point to micronuclei (MNs). Nuc, nucleus. (C, D) Flow cytometry demonstrating an increased frequency of chromosome mis-segregation (p<0.0001) during Fancc-/-; Mad2+/- erythropoiesis compared to all other mouse genotypes. CD71 was used as a marker for immature peripheral blood red blood cells (RBCs). Frequencies of DNA-containing mature RBCs (CD71-, propidium iodide+) were statistically compared using Fisher’s exact test with n of at least 9 age-matched mice per genotype. (E, F) Karyotype demonstrating genomic instability in non-malignant Fancc-/-;Mad2+/- hematopoietic cells. Normal murine chromosome complement is 40, thus the presence of cells with <40 or >40 chromosomes is suggestive of aneuploidy. Statistical analysis was performed using Fisher’s exact test and Bonferroni post-hoc analysis (n=150 metaphase spreads per genotype, ****p < 0.0001, **p = 0.001).
Figure 4
Figure 4
Exacerbation of SAC defect but not of DNA cross-linker hypersensitivity in Fancc-/-; Mad2+/- mice. (A) Graphic illustrating assay design for quantifying SAC impairment in primary low-density mononuclear hematopoietic cells (LDMNCs). Live c-kit+ cells were labeled with EdU and treated with 100 ng/mL nocodazole for 12 hours. Immunofluorescence microscopy quantifies cells that progressed through S-phase (EdU+) and escaped nocodazole-mediated SAC arrest to exit mitosis (pH3-) and undergo multi-nucleation (DNA). (B) Representative immunofluorescent images of c-kit+ cells in S/G2 phase (EdU+, pH3-, single nucleus), mitosis (M) (EdU+, pH3+, condensed chromosomes) and after SAC slippage (EdU+, pH3-, multi-nucleated). (C) Percentage of multinucleated Edu+, pH3- cells in wt, Mad2+/- and Fancc-/- and Fancc-/-; Mad2+/- c-kit+ cells, suggesting that SAC deficiency in Fancc-/-; Mad2+/- c-kit+ cells is more severe compared to wt (p<0.0001), Mad2+/- (p<0.001) and Fancc-/- (p<0.01) genotypes. Fancc-/- and Mad2+/- cells demonstrate an intermediate SAC defect. For each genotype, >200 cells were quantified, and results were compared by Fisher’s exact test. (D) Representative time-lapse video frames of wt and Fancc-/-; Mad2+/- BMDMs exposed to 2 μm taxol and imaged on a live imaging microscope at 2-minute intervals for 24 hours. SAC-arrested cells are round. SAC escape is followed by mitotic exit and flattening of multi-nucleated cells. (E) Evaluation of taxol-induced SAC arrest in Fancc-/-; Mad2+/- BMDMs. Time in mitosis (defined as the time from nuclear envelope breakdown to the time the nuclear envelope reforms) was recorded for at least 90 cells/genotype and analyzed by one-way ANOVA and Tukey’s post-hoc multiple comparisons test. The length of taxol-induced arrest in Fancc-/-; Mad2+/- BMDMs was significantly shorter compared to wt (p<0.0001), Mad2+/- (p<0.05) and Fancc-/- (p<0.01) genotypes. (F) Chromosome breaks (red asterisks) in Fancc-/-; Mad2+/- hematopoietic cells exposed to 50 nM MMC. Enlarged examples of fractured chromosomes are shown. (G) Mad2 haploinsufficiency does not affect chromosome breakage in hematopoietic cells exposed to 50 nM MMC. Note that expected high frequency of MMC-induced chromosome breaks in Fancc-/- cells does not differ from Fancc-/-; Mad2+/- cells. Statistical significance was compared using Fisher’s exact test with at least 100 cells per genotype analyzed. ("ns" denotes "not significant"). (H) Images of representative hematopoietic colonies of indicated genotypes in MMC methylcellulose assays. (I) Evaluation of colony forming ability following MMC demonstrates that Mad2 heterozygosity does not affect MMC hypersensitivity of Fancc-/- cells. *p < 0.05, **p < 0.01, ***p < 0.001, ****p < 0.0001.
Figure 5
Figure 5
FANCC facilitates SAC function through recruitment of Mad2 to prometaphase KTs. (A) Representative immunofluorescent images and (B) quantification of endogenous MAD2 (green) signal intensity at MEF prometaphase KTs demonstrating decreased KT recruitment of MAD2 upon loss of Fancc (p<0.0196) compared to wt. Endogenous HEC1 (white) is used as a kinetochore marker. Endogenous MAD2 kinetochore immunofluorescence intensity was determined by deconvolution microscopy, quantified via Imaris and compared between genotypes using one-way ANOVA with Bonferroni post-hoc correction. Recruitment of MAD2 to prometaphase KTs is significantly decreased in Fancc-/-; Mad2+/- cells compared to wt (p<0.0001), Mad2+/- (p<0.0001) and Fancc-/- (p<0.0001) genotypes. (C) Western blotting of MEFs demonstrates that MAD2 expression is not altered upon loss of Fancc [Fancc vs. wt: (p=0.4789). and Mad2+/- vs. Fancc-/-;Mad2+/-: (p=0.9896)], with quantification of MAD2 signal normalized to actin shown in (D) ("ns" denotes "not significant"). (E) Summary schematic illustrating that Fancc-/-; Mad2+/- mice have decreased targeting of MAD2 to KTs, resulting in impaired SAC function and heightened genomic instability. *p < 0.05, **p < 0.01, ***p < 0.001, ****p < 0.0001.
Figure 6
Figure 6
Mitotic infidelity and genomic lesions in Fancc-/-; Mad2+/- malignancies. (A) Representative images of abnormal mitotic figures in Fancc-/-; Mad2+/- hematopoietic malignancies in situ and (B) in bone marrow cytospins. Red arrows indicate lagging anaphase chromosomes, multi-nucleation and bi-nucleation in bone marrow cells isolated from Fancc-/-; Mad2+/- AML mice. (C) SKY analysis of Fancc-/-; Mad2+/- leukemia shows clonal hematopoiesis with whole-chromosome gains and losses. (D) Circular synteny map shows mapping of human chromosomes 1, 3, 7 and 21, whose changes had been implicated in FA MDS/AML in previous studies, to mouse chromosomes. Mouse chromosomes containing regions of more than one of the four human chromosomes are highlighted in circles. (E–H) Representative images of Fancc-/-; Mad2+/- malignancies. (I) Whole-exome sequencing of four Fancc-/-; Mad2+/- malignancies revealed copy-number variations of mouse chromosomes 1, 4, 6 and 16. Unique Fancc-/-; Mad2+/- malignancies are represented by letters A-D. Red denotes amplifications and blue represents copy number losses. Additional somatic variants of genes implicated in human cancer and genome stability identified by WES in Fancc-/-; Mad2+/- malignancies are shown in (J). Types of mutations are shown in the visual legend.
Figure 7
Figure 7
FA-deficient cancers exhibit a higher incidence of mutations within genes encoding SAC proteins. (A) Analysis of the TCGA pan-cancer dataset acquired through UCSC Xena browser (xenabrowser.net) demonstrating increased frequency of mutations within genes encoding the indicated SAC proteins in FA-mutant (red) compared to FA-wildtype (black) cancers (B) Accordingly, relative to FA-wildtype cancers (black), FA-mutant (red) cancers exhibit a nearly 4-fold increase in the mutation frequency of one or more of the following SAC genes: MAD1L1, KNTC1, ZWILCH, ZW10, ZWINT, BUB1B, BUB3, BUB1, or MAD2L1.

Similar articles

Cited by

References

    1. Nalepa G, Clapp DW. Fanconi Anaemia and Cancer: An Intricate Relationship. Nat Rev Cancer (2018) 18(3):168–85. doi: 10.1038/nrc.2017.116 - DOI - PubMed
    1. Cerami E, Gao J, Dogrusoz U, Gross BE, Sumer SO, Aksoy BA, et al. . The Cbio Cancer Genomics Portal: An Open Platform for Exploring Multidimensional Cancer Genomics Data. Cancer Discov (2012) 2(5):401–4. doi: 10.1158/2159-8290.CD-12-0095 - DOI - PMC - PubMed
    1. Gao J, Aksoy BA, Dogrusoz U, Dresdner G, Gross B, Sumer SO, et al. . Integrative Analysis of Complex Cancer Genomics and Clinical Profiles Using the Cbioportal. Sci Signal (2013) 6(269):pl1. doi: 10.1126/scisignal.2004088 - DOI - PMC - PubMed
    1. Nalepa G, Enzor R, Sun Z, Marchal C, Park SJ, Yang Y, et al. . Fanconi Anemia Signaling Network Regulates the Spindle Assembly Checkpoint. J Clin Invest (2013) 123(9):3839–47. doi: 10.1172/JCI67364 - DOI - PMC - PubMed
    1. Parmar K, D'Andrea A, Niedernhofer LJ. Mouse Models of Fanconi Anemia. Mutat Res (2009) 668(1-2):133–40. doi: 10.1016/j.mrfmmm.2009.03.015 - DOI - PMC - PubMed