Potential of Prebiotic D-Tagatose for Prevention of Oral Disease
- PMID: 34804997
- PMCID: PMC8604381
- DOI: 10.3389/fcimb.2021.767944
Potential of Prebiotic D-Tagatose for Prevention of Oral Disease
Abstract
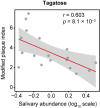
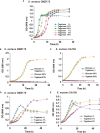
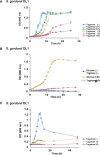
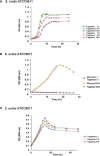
Recent studies have shown phenotypic and metabolic heterogeneity in related species including Streptococcus oralis, a typical oral commensal bacterium, Streptococcus mutans, a cariogenic bacterium, and Streptococcus gordonii, which functions as an accessory pathogen in periodontopathic biofilm. In this study, metabolites characteristically contained in the saliva of individuals with good oral hygiene were determined, after which the effects of an identified prebiotic candidate, D-tagatose, on phenotype, gene expression, and metabolic profiles of those three key bacterial species were investigated. Examinations of the saliva metabolome of 18 systemically healthy volunteers identified salivary D-tagatose as associated with lower dental biofilm abundance in the oral cavity (Spearman's correlation coefficient; r = -0.603, p = 0.008), then the effects of D-tagatose on oral streptococci were analyzed in vitro. In chemically defined medium (CDM) containing D-tagatose as the sole carbohydrate source, S. mutans and S. gordonii each showed negligible biofilm formation, whereas significant biofilms were formed in cultures of S. oralis. Furthermore, even in the presence of glucose, S. mutans and S. gordonii showed growth suppression and decreases in the final viable cell count in a D-tagatose concentration-dependent manner. In contrast, no inhibitory effects of D-tagatose on the growth of S. oralis were observed. To investigate species-specific inhibition by D-tagatose, the metabolomic profiles of D-tagatose-treated S. mutans, S. gordonii, and S. oralis cells were examined. The intracellular amounts of pyruvate-derived amino acids in S. mutans and S. gordonii, but not in S. oralis, such as branched-chain amino acids and alanine, tended to decrease in the presence of D-tagatose. This phenomenon indicates that D-tagatose inhibits growth of those bacteria by affecting glycolysis and its downstream metabolism. In conclusion, the present study provides evidence that D-tagatose is abundant in saliva of individuals with good oral health. Additionally, experimental results demonstrated that D-tagatose selectively inhibits growth of the oral pathogens S. mutans and S. gordonii. In contrast, the oral commensal S. oralis seemed to be negligibly affected, thus highlighting the potential of administration of D-tagatose as an oral prebiotic for its ability to manipulate the metabolism of those targeted oral streptococci.
Keywords: Streptococcus gordonii; Streptococcus mutans (S. mutans); Streptococcus oralis; biofilm; d-tagatose; metabolomics (OMICS); transcriptomics.
Copyright © 2021 Mayumi, Kuboniwa, Sakanaka, Hashino, Ishikawa, Ijima and Amano.
Conflict of interest statement
The authors declare that the research was conducted in the absence of any commercial or financial relationships that could be construed as a potential conflict of interest.
Figures


Similar articles
-
Amino Sugars Modify Antagonistic Interactions between Commensal Oral Streptococci and Streptococcus mutans.Appl Environ Microbiol. 2019 May 2;85(10):e00370-19. doi: 10.1128/AEM.00370-19. Print 2019 May 15. Appl Environ Microbiol. 2019. PMID: 30877119 Free PMC article.
-
Amino Sugars Reshape Interactions between Streptococcus mutans and Streptococcus gordonii.Appl Environ Microbiol. 2020 Dec 17;87(1):e01459-20. doi: 10.1128/AEM.01459-20. Print 2020 Dec 17. Appl Environ Microbiol. 2020. PMID: 33097515 Free PMC article.
-
Antagonistic interactions by a high H2 O2 -producing commensal streptococcus modulate caries development by Streptococcus mutans.Mol Oral Microbiol. 2022 Dec;37(6):244-255. doi: 10.1111/omi.12394. Epub 2022 Oct 11. Mol Oral Microbiol. 2022. PMID: 36156446
-
D-Tagatose: A Rare Sugar with Functional Properties and Antimicrobial Potential against Oral Species.Nutrients. 2024 Jun 19;16(12):1943. doi: 10.3390/nu16121943. Nutrients. 2024. PMID: 38931297 Free PMC article. Review.
-
Biology of Oral Streptococci.Microbiol Spectr. 2018 Oct;6(5):10.1128/microbiolspec.gpp3-0042-2018. doi: 10.1128/microbiolspec.GPP3-0042-2018. Microbiol Spectr. 2018. PMID: 30338752 Free PMC article. Review.
Cited by
-
Inhibitory Effects of Shikonin Dispersion, an Extract of Lithospermum erythrorhizon Encapsulated in β-1,3-1,6 Glucan, on Streptococcus mutans and Non-Mutans Streptococci.Int J Mol Sci. 2024 Jan 16;25(2):1075. doi: 10.3390/ijms25021075. Int J Mol Sci. 2024. PMID: 38256148 Free PMC article.
-
Transforming monosaccharides: Recent advances in rare sugar production and future exploration.BBA Adv. 2025 Jan 18;7:100143. doi: 10.1016/j.bbadva.2025.100143. eCollection 2025. BBA Adv. 2025. PMID: 39926187 Free PMC article.
-
Polymicrobial Infections and Biofilms: Clinical Significance and Eradication Strategies.Antibiotics (Basel). 2022 Dec 1;11(12):1731. doi: 10.3390/antibiotics11121731. Antibiotics (Basel). 2022. PMID: 36551388 Free PMC article. Review.
-
The effect of different sweeteners on the oral microbiome: a randomized clinical exploratory pilot study.J Oral Microbiol. 2024 Jun 24;16(1):2369350. doi: 10.1080/20002297.2024.2369350. eCollection 2024. J Oral Microbiol. 2024. PMID: 38919384 Free PMC article.
-
Oral Microbiome: Getting to Know and Befriend Neighbors, a Biological Approach.Biomedicines. 2022 Mar 14;10(3):671. doi: 10.3390/biomedicines10030671. Biomedicines. 2022. PMID: 35327473 Free PMC article. Review.
References
-
- Bernabe E., Marcenes W., Hernandez C. R., Bailey J., Abreu L. G., Alipour V., et al. . (2020). Global, Regional, and National Levels and Trends in Burden of Oral Conditions From 1990 to 2017: A Systematic Analysis for the Global Burden of Disease 2017 Study. J. Dent. Res. 99 (4), 362–373. doi: 10.1177/0022034520908533 - DOI - PMC - PubMed
-
- Chahed A., Lazazzara V., Moretto M., Nesler A., Corneo P. E., Barka E. A., et al. . (2021). The Differential Growth Inhibition of Phytophthora spp. Caused by the Rare Sugar Tagatose Is Associated With Species-Specific Metabolic and Transcriptional Changes. Front. Microbiol. 12, 711545. doi: 10.3389/fmicb.2021.711545 - DOI - PMC - PubMed
-
- Chahed A., Nesler A., Navazio L., Baldan B., Busato I., Ait Barka E., et al. . (2020). The Rare Sugar Tagatose Differentially Inhibits the Growth of Phytophthora infestans and Phytophthora Cinnamomi by Interfering With Mitochondrial Processes. Front. Microbiol. 11, 128. doi: 10.3389/fmicb.2020.00128 - DOI - PMC - PubMed
Publication types
MeSH terms
Substances
LinkOut - more resources
Full Text Sources
Miscellaneous

