. 2021 Nov 3:9:765408.
doi: 10.3389/fcell.2021.765408. eCollection 2021.

Mitochondrial Defects in Fibroblasts of Pathogenic MAPT Patients

Affiliations

Mitochondrial Defects in Fibroblasts of Pathogenic MAPT Patients

Vinita Bharat et al. Front Cell Dev Biol. .

Abstract

Mutations in MAPT gene cause multiple neurological disorders, including frontal temporal lobar degeneration and parkinsonism. Increasing evidence indicates impaired mitochondrial homeostasis and mitophagy in patients and disease models of pathogenic MAPT. Here, using MAPT patients' fibroblasts as a model, we report that disease-causing MAPT mutations compromise early events of mitophagy. By employing biochemical and mitochondrial assays we discover that upon mitochondrial depolarization, the recruitment of LRRK2 and Parkin to mitochondria and degradation of the outer mitochondrial membrane protein Miro1 are disrupted. Using high resolution electron microscopy, we reveal that the contact of mitochondrial membranes with ER and cytoskeleton tracks is dissociated following mitochondrial damage. This membrane dissociation is blocked by a pathogenic MAPT mutation. Furthermore, we provide evidence showing that tau protein, which is encoded by MAPT gene, interacts with Miro1 protein, and this interaction is abolished by pathogenic MAPT mutations. Lastly, treating fibroblasts of a MAPT patient with a small molecule promotes Miro1 degradation following depolarization. Altogether, our results show molecular defects in a peripheral tissue of patients and suggest that targeting mitochondrial quality control may have a broad application for future therapeutic intervention.

Keywords: ER; FTLD; MAPT; Miro; mitochondria; mitophagy; parkinsonism; tau.


Conflict of interest statement

XW is a co-founder, adviser, and shareholder of AcureX Therapeutics Inc., and a shareholder of Mitokinin Inc. C-HH is a shareholder of AcureX Therapeutics Inc. The remaining author declares that the research was conducted in the absence of any commercial or financial relationships that could be construed as a potential conflict of interest.

Figures
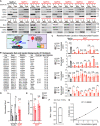
FIGURE 1
FIGURE 1
Mitochondrial protein changes following CCCP treatment in fibroblasts. (A) Mitochondrial (Mito) and cytosolic (Cyto) fractions were immunoblotted as indicated. Below: Schematic representation of our readouts. (B) Demographic and genetic information of all cell lines used in this study or described in Text. (C) Quantifications of mitochondrial protein levels. The intensity of each band in the mitochondrial fraction is normalized to that of the mitochondrial loading control VDAC from the same blot and expressed as a fraction of Mean of Healthy-1 with DMSO treatment; this control was included in every experiment. Student T Test is performed for comparing normalized band intensities within the same subject (DMSO vs. CCCP). N = 3–9 independent experiments. Please note that Healthy-2 to 12 show similar mitochondrial protein responses to CCCP as Healthy-1, previously published in Hsieh et al. (2019). (D,E) ELISA of Miro1 protein. Comparison within the same subject. Mann-Whitney U Test. (D) N = 4 with duplicates each time. (E) N = 3. (F) Intra-plate variability of ELISA shown in (E), measured by running the same fibroblast sample 4 times in the same plate. (G) The standard curve for (E) is shown. Sigmoidal 4PL is used. P < 0.05, ∗∗P < 0.01, ∗∗∗P < 0.001. n.s.: not significant.
FIGURE 2
FIGURE 2
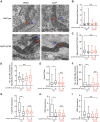
Ultrastructural changes of mitochondria in fibroblasts. (A) Representative TEM images of Healthy-6 (WT) and MAPT-1 (MAPT-N279K) with and without CCCP treatment. Scale bar: 500 nm. (B–I) Quantifications from images as in (A). (B) Quantification of mitochondrial size (minor × major diameter). (C) Quantification of mitochondrial perimeter. (D) Quantification of cristae junction number normalized to mitochondrial perimeter. (E) Quantification of aspect ratio (minor/major diameter). (F) Quantification of ER-mitochondrial contact number normalized to mitochondrial size (contact is defined where the distance between ER and mitochondrial membranes is less than 10 nm). (G) Quantification of total ER abundance (the total number of ER-mitochondrial contact divided by the total number of mitochondria per image). (H) Quantification of rough ER (RER) abundance. Similar to (G) but only RER is counted. (I) Quantification of smooth ER (SER) abundance. Similar to (G) but only SER is counted. N = 57 (WT, DMSO), 51 (WT, CCCP), 53 (MAPT-N279K, DMSO), and 64 (MAPT-N279K, CCCP) mitochondria from 15 different images from 3 independent cultures. Two-Way ANOVA Post Hoc Tukey Test. *P < 0.05, **P < 0.01. n.s.: not significant.
FIGURE 3
FIGURE 3
Phenotypes of cytoskeleton and other organelles in fibroblasts. (A) Representative TEM images of Healthy-6 (WT) and MAPT-1 (MAPT-N279K) with and without CCCP treatment, showing cytoskeleton tracks (Tracks) next to mitochondria. (B) From images as in (A), the percentage of total mitochondria with or without adjacent cytoskeleton tracks is counted. N = 30 (WT, DMSO), 28 (WT, CCCP), 31 (MAPT-N279K, DMSO), and 36 (MAPT-N279K, CCCP) mitochondria from 15 images from 3 independent cultures. Chi Square Test. (C) Representative TEM images of Healthy-6 (WT) and MAPT-1 (MAPT-N279K) with and without CCCP treatment, showing vacuole-like structures (Vac), structures similar to multi-vesicular bodies (MV), and structures similar to lamellar bodies (LB). Scale bars: 500 nm. ***P < 0.001. n.s.: not significant.
FIGURE 4
FIGURE 4
The mitochondrial network in fibroblasts, tau interaction with Miro1, and effect of Miro1 Reducer. (A) Confocal images show mitochondria stained with TMRM in fibroblasts. The mean TMRM intensity of each cell is normalized to the background intensity and quantified. N = 43 (Healthy-6), 46 (Healthy-7), and 42 (MAPT-1) cells from 4 to 5 images per coverslip from 3 coverslips. One-Way ANOVA Post Hoc Tukey Test. Scale bar: 10 μM. (B,C) Co-IP with anti-GFP from HEK cells transfected as indicated. (D) HEK cells transfected with different tau and Miro1 constructs were lysed and blotted. (E) ELISA of Miro1 protein in MAPT-1 fibroblasts treated as indicated, N = 4. Mann-Whitney U Test. *P < 0.05. n.s.: not significant.

References

    1. Bardai F. H., Ordonez D. G., Bailey R. M., Hamm M., Lewis J., Feany M. B. (2018). Lrrk promotes tau neurotoxicity through dysregulation of actin and mitochondrial dynamics. PLoS Biol. 16:e2006265. 10.1371/journal.pbio.2006265 - DOI - PMC - PubMed
    1. Basso V., Marchesan E., Peggion C., Chakraborty J., von Stockum S., Giacomello M., et al. (2018). Regulation of ER-mitochondria contacts by Parkin via Mfn2. Pharmacol. Res. 138 43–56. 10.1016/j.phrs.2018.09.006 - DOI - PubMed
    1. Birsa N., Norkett R., Wauer T., Mevissen T. E., Wu H. C., Foltynie T., et al. (2014). Lysine 27 ubiquitination of the mitochondrial transport protein Miro is dependent on serine 65 of the Parkin ubiquitin ligase. J. Biol. Chem. 289 14569–14582. 10.1074/jbc.M114.563031 - DOI - PMC - PubMed
    1. Bonello F., Hassoun S. M., Mouton-Liger F., Shin Y. S., Muscat A., Tesson C., et al. (2019). LRRK2 impairs PINK1/Parkin-dependent mitophagy via its kinase activity: pathologic insights into Parkinson’s disease. Hum. Mol. Genet. 28 1645–1660. 10.1093/hmg/ddz004 - DOI - PubMed
    1. Bonifati V. (2002). Deciphering Parkinson’s disease–PARK8. Lancet Neurol. 1:83. - PubMed

LinkOut - more resources