. 2021 Nov 17;8(11):ofab518.
doi: 10.1093/ofid/ofab518. eCollection 2021 Nov.

SARS-CoV-2 Genomic Surveillance Reveals Little Spread From a Large University Campus to the Surrounding Community

Affiliations

SARS-CoV-2 Genomic Surveillance Reveals Little Spread From a Large University Campus to the Surrounding Community

Andrew L Valesano et al. Open Forum Infect Dis. .

Abstract

Background: Coronavirus disease 2019 (COVID-19) has had high incidence rates at institutions of higher education (IHE) in the United States, but the transmission dynamics in these settings are poorly understood. It remains unclear to what extent IHE-associated outbreaks have contributed to transmission in nearby communities.

Methods: We implemented high-density prospective genomic surveillance to investigate these dynamics at the University of Michigan and the surrounding community during the Fall 2020 semester (August 16-November 24). We sequenced complete severe acute respiratory syndrome coronavirus 2 (SARS-CoV-2) genomes from 1659 individuals, including 468 students, representing 20% of cases in students and 25% of total cases in Washtenaw County over the study interval.

Results: Phylogenetic analysis identified >200 introductions into the student population, most of which were not related to other student cases. There were 2 prolonged student transmission clusters, of 115 and 73 individuals, that spanned multiple on-campus residences. Remarkably, <5% of nonstudent genomes were descended from student clusters, and viral descendants of student cases were rare during a subsequent wave of infections in the community.

Conclusions: The largest outbreaks among students at the University of Michigan did not significantly contribute to the rise in community cases in Fall 2020. These results provide valuable insights into SARS-CoV-2 transmission dynamics at the regional level.

Keywords: SARS-CoV-2; genomic epidemiology; infection prevention; transmission; university.


Figures

Figure 1.
Figure 1.
Case curves and sequencing density. A, New lab-confirmed cases of COVID-19 in Washtenaw County, Michigan, from the week of 8/16/2020 through 11/23/2020, displayed by day of symptom onset (as reported by MDHHS). New cases per week are shown on the y-axis and time in weeks on the x-axis. The fraction of new lab-confirmed cases in University of Michigan students is shown in yellow. The Washtenaw County “shelter-in-place” order for undergraduates is indicated (10/20/2020 through 11/03/2020). B, Sampling density is displayed as the fraction of new lab-confirmed COVID-19 cases with complete genome sequences (y-axis) per week during the fall term (x-axis). The fraction of student cases sequenced is shown in yellow, all Washtenaw County cases in blue, and all cases in Region 2S in violet (includes Washtenaw, Wayne, and Monroe counties). Abbreviations: COVID-19, coronavirus disease 2019; MDHHS, Michigan Department of Health and Human Services.
Figure 2.
Figure 2.
Introductions into the student population. A, Time-calibrated maximum likelihood phylogenetic tree of 7149 SARS-CoV-2 genomes, including 1657 genomes sequenced for this study. Month is shown on the x-axis. Genomes from students are shown in red, other genomes from Michigan in light blue, other genomes from North America in dark blue, and global genomes in gray. B, Counts of genomes from students (y-axis) per week during the fall term (x-axis) by inferred transmission lineage group. Singleton introductions are shown in dark blue, genomes from Cluster A in yellow, genomes from Cluster B in violet, and genomes from smaller clusters (2–8 individuals) in teal. C, Inferred transmission lineages in students, with genomes from each lineage or cluster (y-axis) shown as points with time on the x-axis. Only inferred transmission lineages with ≥5 students are shown. Point colors reflect on-campus residences, if known (unknown residence is light gray). Abbreviation: SARS-CoV-2, severe acute respiratory syndrome coronavirus 2.
Figure 3.
Figure 3.
Frequency of lineages B.1.1.304 and B.1.593 in Michigan. All genomes from Michigan available on GISAID from July 2020 to January 2021 are shown. Count of genomes is shown on the y-axis with time on the x-axis (binwidth = 1 day). Genomes from lineage B.1.593 are shown in blue, genomes from B.1.1.304 in yellow, and genomes from all other lineages are shown in gray.
Figure 4.
Figure 4.
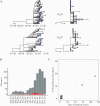
Spillover from student-associated clusters. A, Maximum likelihood phylogenetic trees of student Cluster A (top) and Cluster B (bottom). Time-calibrated trees are displayed on the left and divergence trees on the right. Tip colors reflect genomes from students (blue) and nonstudents (red). B, Bar plot of the number of nonstudent genomes sequenced (y-axis, n = 1191) per week over the fall term (x-axis). Genomes that are derived from inferred “student” nodes are shown in red, and genomes not derived from “student” nodes are shown in gray. C, For each nonsingleton transmission lineage in students, the number of nonstudent descendants is shown (y-axis) by the number of students in the cluster (x-axis).

References

    1. Andersen MS, Bento AI, Basu A, et al. College openings, mobility, and the incidence of COVID-19. medRxiv 2020.09.22.20196048 [Preprint]. 23 February 2021. Available at: 10.1101/2020.09.22.20196048. Accessed 10 August 2021. - DOI
    1. Leidner AJ. Opening of large institutions of higher education and county-level COVID-19 incidence — United States, July 6–September 17, 2020. MMWR Morb Mortal Wkly Rep 2021; 70:14–19. - PMC - PubMed
    1. Vang KE. Participation in fraternity and sorority activities and the spread of COVID-19 among residential university communities — Arkansas, August 21–September 5, 2020. MMWR Morb Mortal Wkly Rep 2021; 70:20–23. - PMC - PubMed
    1. Currie DW, Moreno GK, Delahoy MJ, et al. Description of a University COVID-19 outbreak and interventions to disrupt transmission, Wisconsin, August - October 2020. medRxiv 2021.05.07.21256834 [Preprint]. 10 May 2021. Available at: 10.1101/2021.05.07.21256834. Accessed 10 August 2021. - DOI
    1. Fox MD. Response to a COVID-19 outbreak on a University Campus — Indiana, August 2020. MMWR Morb Mortal Wkly Rep 2021; 70:118–22. - PMC - PubMed