Review
. 2021 Nov 12;6(11):4023-4054.
doi: 10.1021/acsenergylett.1c01868. Epub 2021 Oct 26.

Spatial and Temporal Analysis of Sodium-Ion Batteries

Affiliations
Review

Spatial and Temporal Analysis of Sodium-Ion Batteries

Dewen Hou et al. ACS Energy Lett. .

Abstract

As a promising alternative to the market-leading lithium-ion batteries, low-cost sodium-ion batteries (SIBs) are attractive for applications such as large-scale electrical energy storage systems. The energy density, cycling life, and rate performance of SIBs are fundamentally dependent on dynamic physiochemical reactions, structural change, and morphological evolution. Therefore, it is essential to holistically understand SIBs reaction processes, degradation mechanisms, and thermal/mechanical behaviors in complex working environments. The recent developments of advanced in situ and operando characterization enable the establishment of the structure-processing-property-performance relationship in SIBs under operating conditions. This Review summarizes significant recent progress in SIBs exploiting in situ and operando techniques based on X-ray and electron analyses at different time and length scales. Through the combination of spectroscopy, imaging, and diffraction, local and global changes in SIBs can be elucidated for improving materials design. The fundamental principles and state-of-the-art capabilities of different techniques are presented, followed by elaborative discussions of major challenges and perspectives.


Conflict of interest statement

The authors declare no competing financial interest.

Figures

Figure 1
Figure 1
Schematic of major advantages of SIBs. “EC” in the bottom-left panel represents ethylene carbonate (indispensible solvent in LIBs) that hampers low-temperature performances. The figure in the top-right panel is reprinted with permission from ref (9). Copyright 2016 Elsevier.
Figure 2
Figure 2
Scheme of a battery at different scales and underlying scientific information correlated with electrochemical properties. The image at atomic scale is from Wikipedia, while the image at the macroscopic scale is adapted from ref (19), copyright 2020 Springer Nature.
Figure 3
Figure 3
Schematic of in situ TEM experimental configurations: (a) open-cell setup and (b) sealed liquid-cell setup.
Figure 4
Figure 4
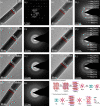
Sodiation of hard carbon studied by in situ TEM. (a, c) TEM image of the pristine and sodiated hard carbon. (b, d) Corresponding electron diffraction patterns. (e) Illustration of Na absorption and intercalation; the curves show the volume change of the hard carbon during sodiation. Adapted with permission from ref (40). Copyright 2019 Royal Society of Chemistry.
Figure 5
Figure 5
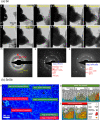
In situ TEM studies for alloying electrode materials in sodiation/desodiation cycles. Microstructural evolution of the (a) Sn nanoparticles. Reprinted with permission from ref (41). Copyright 2012 American Chemical Society. (b) Microstructure evolution during sodiation in SnSb thin-film anodes. Adapted with permission from ref (47). Copyright 2019 American Chemical Society.
Figure 6
Figure 6
In situ TEM investigation of the microstructural evolution of conversion-type α-MoO3 electrode during Na diffusion. Reprinted with permission from ref (54). Copyright 2016 Elsevier.
Figure 7
Figure 7
Intercalation–conversion reaction: FeS2. Reprinted with permission from ref (76). Copyright 2019 Elsevier.
Figure 8
Figure 8
(a) In situ heating of black phosphorus. Adapted with permission from ref (86). (b) In situ compression and unloading processes for a Na particle and (c) in situ tensile tests of a Na dendrite. Reprinted with permission from ref (87). Copyright 2020 American Chemical Society
Figure 9
Figure 9
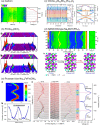
In situ/operando XRD investigations in intercalation-type electrode materials. (a) In situ XRD mapping of hard carbon anode during the first cycle at 200 mA g–1 at room temperature. Adapted permission from ref (97). Copyright 2017 Wiley. (b) Operando XRD of P2-Na2/3MnO2 (top panel) and P2-Na2/3[Mn0.8Co0.2]O2 (bottom panel). Reprinted with permission from ref (111). Copyright 2019 American Chemical Society. (c) In situ XRD of Na1.2Ni0.2Mn0.2Ru0.4O2 (left panel) and the corresponding lattice parameters evolutions (right panel). Adapted with permission from ref (120). Copyright 2018 Elsevier. (d) In situ XRD of the Na3MnTi(PO4)3 cathode cycled at 50 mA g–1 and schematic illustration showing Na+ (de)intercalating from/into Na3MnTi(PO4)3 cathode upon electrochemical processes. Adapted with permission from ref (122). Copyright 2019 Wiley. (e) 2D contour map of (012) reflection plan of Na2-xFeFe(CN)6 (top-left panel), and normalized volume during cycling obtained from in situ SXRD patterns (bottom-left panel), as well as (012), (110)/(104), and (024) reflection planes of in situ SXRD patterns (right panel). Reprinted with permission from ref (123). Copyright 2020 Springer Nature.
Figure 10
Figure 10
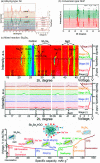
In situ/operando XRD in alloying-type and conversion-type electrode materials. (a) In situ XRD patterns of Sn and corresponding voltage profiles. Reprinted with permission from ref (124). Copyright 2019 Wiley. (b) In situ XRD of MoP during the first cycle at a voltage range between 0.01 and 3.0 V. The green and red curves represent the charge and discharge process. Reprinted with permission from ref (134). (c) In situ XRD of Sb2Se3 during the initial cycle and schematic of the reaction mechanism during charge/discharge process. Adapted with permission from ref (138). Copyright 2017 Wiley.
Figure 11
Figure 11
In situ/operando XRD investigation during materials synthesis and for thermal stability of electrode materials. (a) Contour plot of in situ XRD patterns collected during the solid-state synthesis and corresponding covariance analysis. Reprinted with permission from ref (139). Copyright 2017 Elsevier. (b) Contour plots of high-temperature in situ XRD patterns of charged state NaxNi2/3Sb1/3O2 electrode and corresponding selected diffraction patterns. Reprinted with permission from ref (140). Copyright 2017 Elsevier.
Figure 12
Figure 12
(a) Observation of Ti K-edge XANES of TiO2 anatase structure. Dashed line and dashed-dotted line present the end of first charge and end of charge positions. The inset panel is the evolution of the pre-edge features. (b) Corresponding electrochemical cycling curves. Reprinted with permission from ref (147). Copyright 2020 MPDI.
Figure 13
Figure 13
In situ/operando XANES at Ni K-edge XANES of the (a) P2-type Na0.78Ni0.23Mn0.69O2 material. Reprinted with permission from ref (151). Copyright 2017 American Chemical Society. (b) Prussian blue analogue. Reprinted with permission from ref (155). Copyright 2020 American Chemical Society.
Figure 14
Figure 14
(a) Operando Sb K-edge XANES and EXAFS spectra collected during the first one and a half cycles. Reprinted with permission from ref (161). Copyright 2018 Batteries MDPI. (b) Operando Sn and Sb K-edge EXAFS spectra measured during the first three cycles. Reprinted with permission from ref (162). Copyright 2018 Royal Society of Chemistry.
Figure 15
Figure 15
Operando XANES spectra and corresponding EXAFS analysis along with discharge/charge profiles of porous cobalt oxide electrode. Reprinted with permission from ref (167).
Figure 16
Figure 16
(a) Ni L-edge of NaTi0.5Ni0.5O2 and NaFe0.5Ni0.5O2 at different charged/discharged states in PFY mode. Linear combination was applied based on calculated patterns. Reprinted with permission from ref (175). Copyright 2016 American Chemical Society. (b) O K-edge O3-NaFeO2 at different charged/discharged states in TFY mode. C0-C7 means charging from 2.5 to 4.5 V continuously. D7-D1 is the reverse process. Adapted with permission from ref (159). (c) Mn and Ni L-edge of NaNi1/3Fe1/3Mn1/3O2 at different charged (C)/discharged (D) states. Ni was performed in total electron yield and fluorescence yield mode while Mn was under total electron yield mode. Reprinted with permission from ref (189). Copyright 2018 Wiley. (d) L-edge of Ni for Na0.78Ni0.23Mn0.69O2. Adapted with permission from ref (195).
Figure 17
Figure 17
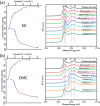
P K-edge of (a) sodium alginate-SA and (b) sodium carboxymethyl cellulose-CMC binders in electrodes at different charged/discharged states (left). Total fluorescence yield mode is applied. Reprinted with permission from ref (200). Copyright 2020 Wiley.
Figure 18
Figure 18
K-edge of C under total electron yield mode for cycled (a) graphite, (b) soft carbon, and (c) hard carbon anodes. Graphite is operated in ether-based electrolytes, and the others are in carbonate-based electrolytes. Reprinted with permission from ref (204). Copyright 2018 American Chemical Society.
Figure 19
Figure 19
Reconstructed images of NaNi1/3Fe1/3Mn1/3O2 cathode at different states of charge derived from operando TXM. Reprinted with permission from ref (219). Copyright 2016 Wiley.
Figure 20
Figure 20
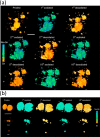
(a) 3D reconstructed images from in situ synchrotron hard X-ray nanotomography for tin anode during the first 10 sodiation–desodiation cycles. Scale bar, 10 μm. (b) Comparison of volume change of three particles of distinct size after the 1st cycle and the 10th cycle. Scale bars: 10, 2, and 1 μm. Reprinted with permission from ref (221). Copyright 2015 Springer Nature.
Figure 21
Figure 21
Reconstructed 2D chemical mapping images of CuO intercalated with sodium ions from in situ TXM. Reprinted with permission from ref (223). Copyright 2019 American Chemical Society.
Figure 22
Figure 22
(a) Operando PDF study of the dynamic change of the graphene structure during sodiation/desodiation. (Top) Operando PDF data in the r-range. (Below) Selected operando PDFs of the first discharge. Reprinted with permission from ref (233). Copyright 2019 Royal Society of Chemistry. (b) Discharge–charge profiles obtained for Sb during the operando PDF study (left), and corresponding selected PDFs obtained from different discharge/charge states. Reprinted with permission from ref (235). Copyright 2016 American Chemical Society.
Figure 23
Figure 23
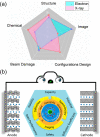
(a) Radar chart comparing electron and X-ray based methods. (b) An overview of various in situ and operando characterizations which promote the research and development of SIBs.

References

    1. Whittingham M. S. Electrical Energy Storage and Intercalation Chemistry. Science 1976, 192 (4244), 1126–1127. 10.1126/science.192.4244.1126. - DOI - PubMed
    1. Whittingham M. S.; Gamble F. R. The Lithium Intercalates of the Transition Metal Dichalcogenides. Mater. Res. Bull. 1975, 10 (5), 363–371. 10.1016/0025-5408(75)90006-9. - DOI
    1. Fouassier C.; Delmas C.; Hagenmuller P. Evolution structurale et proprietes physiques des phases AXMO2 (A = Na, K, M = Cr, Mn, Co) (x ⩽ 1). Mater. Res. Bull. 1975, 10 (6), 443–449. 10.1016/0025-5408(75)90166-X. - DOI
    1. Braconnier J.-J.; Delmas C.; Fouassier C.; Hagenmuller P. Comportement electrochimique des phases NaxCoO2. Mater. Res. Bull. 1980, 15 (12), 1797–1804. 10.1016/0025-5408(80)90199-3. - DOI
    1. Slater M. D.; Kim D.; Lee E.; Johnson C. S. Sodium-Ion Batteries. Adv. Funct. Mater. 2013, 23 (8), 947–958. 10.1002/adfm.201200691. - DOI