. 2021 Aug 19;3(4):fcab182.
doi: 10.1093/braincomms/fcab182. eCollection 2021.

Posterior cortical atrophy phenotypic heterogeneity revealed by decoding 18F-FDG-PET

Affiliations

Posterior cortical atrophy phenotypic heterogeneity revealed by decoding 18F-FDG-PET

Ryan A Townley et al. Brain Commun. .

Abstract

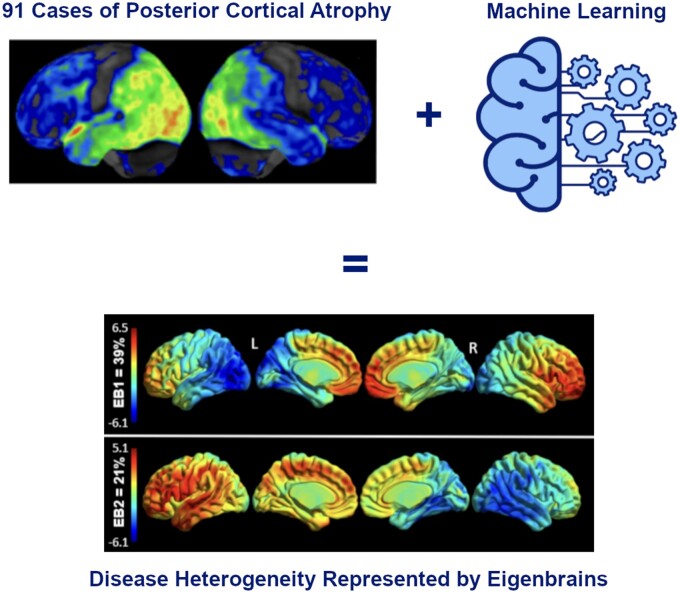
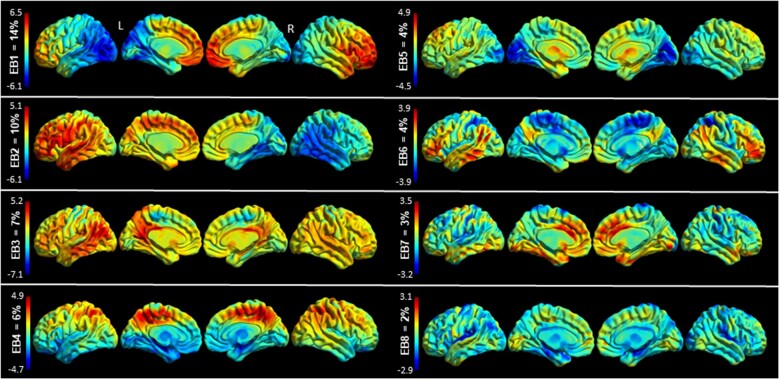
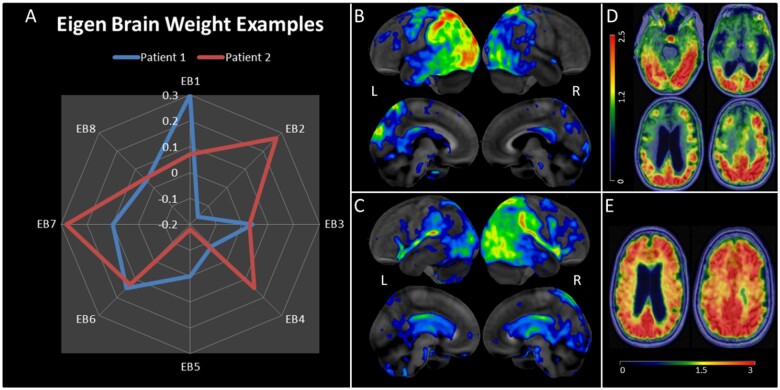
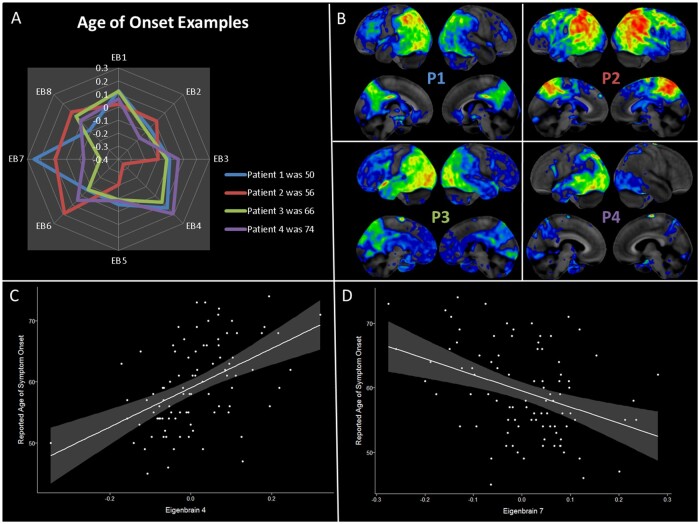
Posterior cortical atrophy is a neurodegenerative syndrome with a heterogeneous clinical presentation due to variable involvement of the left, right, dorsal and ventral parts of the visual system, as well as inconsistent involvement of other cognitive domains and systems. 18F-fluorodeoxyglucose (FDG)-PET is a sensitive marker for regional brain damage or dysfunction, capable of capturing the pattern of neurodegeneration at the single-participant level. We aimed to leverage these inter-individual differences on FDG-PET imaging to better understand the associations of heterogeneity of posterior cortical atrophy. We identified 91 posterior cortical atrophy participants with FDG-PET data and abstracted demographic, neurologic, neuropsychological and Alzheimer's disease biomarker data. The mean age at reported symptom onset was 59.3 (range: 45-72 years old), with an average disease duration of 4.2 years prior to FDG-PET scan, and a mean education of 15.0 years. Females were more common than males at 1.6:1. After standard preprocessing steps, the FDG-PET scans for the cohort were entered into an unsupervised machine learning algorithm which first creates a high-dimensional space of inter-individual covariance before performing an eigen-decomposition to arrive at a low-dimensional representation. Participant values ('eigenbrains' or latent vectors which represent principle axes of inter-individual variation) were then compared to the clinical and biomarker data. Eight eigenbrains explained over 50% of the inter-individual differences in FDG-PET uptake with left (eigenbrain 1) and right (eigenbrain 2) hemispheric lateralization representing 24% of the variance. Furthermore, eigenbrain-loads mapped onto clinical and neuropsychological data (i.e. aphasia, apraxia and global cognition were associated with the left hemispheric eigenbrain 1 and environmental agnosia and apperceptive prosopagnosia were associated with the right hemispheric eigenbrain 2), suggesting that they captured important axes of normal and abnormal brain function. We used NeuroSynth to characterize the eigenbrains through topic-based decoding, which supported the idea that the eigenbrains map onto a diverse set of cognitive functions. These eigenbrains captured important biological and pathophysiologic data (i.e. limbic predominant eigenbrain 4 patterns being associated with older age of onset compared to frontoparietal eigenbrain 7 patterns being associated with younger age of onset), suggesting that approaches that focus on inter-individual differences may be important to better understand the variability observed within a neurodegenerative syndrome like posterior cortical atrophy.

Keywords: FDG-PET; early-onset Alzheimer's disease; eigenvectors; posterior cortical atrophy; tau PET.


Figures

Graphical Abstract
Graphical Abstract
Figure 1
Figure 1
Eigenbrains Surface renderings of the eight eigenbrains that explain over 50% of the variance of this sample. The percentage of cumulative variance explained by each eigenbrain is displayed above each colour bar. The colour bar encodes positive (red) and negative (blue) intensities for each eigenbrain. While a given participants’ scan can be approximated by a weighted linear combination of the above eigenbrains, the above images are not direct representations of hypometabolism or preserved metabolism. Rather, positive (red) regions indicate relatively preserved metabolism, and negative (blue) regions indicate relatively reduced metabolism. Furthermore, the signs of all the eigenbrains are indeterminate—if all the eigenbrain signs and participant weight signs are flipped about zero the decomposition would be equally valid. Inference occurs at the pattern—or eigenbrain—level, using the participant weights on the entire pattern.
Figure 2
Figure 2
Participant level examples of the relationship between eigenbrain weights and participant PET data. (A) Eigenbrain weight distributions (EB1–EB8 shown in Fig. 1) for two individuals. (B) Patient 1 18F-FDG-PET (Cortex ID from GE Healthcare, z-score is 0 to −7): a 63-year-old female presented with a 7-year history of visual predominant symptoms. She went to multiple eye doctors, tried numerous eyeglass prescriptions, and underwent an operation for cataracts which did not improve her visual problems. Within two years she developed significant apraxia of her right hand, being unable to shift gears in her car, difficulties writing, and difficulties opening jars. She developed aphasia after 4 years. By the time she presented to the clinic, she was not testable on STMS due to severe aphasia. She had prominent optic apraxia, myoclonic jerks and severe right upper extremity apraxia. CSF AD biomarkers were positive (A+/T+). The FDG-PET revealed left-sided asymmetric hypometabolism and was consistent with the EB1 positive weighting and EB2 negative weighting. The presence of aphasia and ideomotor apraxia was consistent with EB1 odds ratios as well. (C) Patient 2 18F-FDG-PET: a 66-year-old female presented with a 5-year history of progressive visual predominant symptoms. Her first symptom was described as visual blurriness which did not improve with LASIK surgery. This progressed to exhibiting inattentiveness and getting lost in familiar locations. Two years after symptoms she developed left visual hemifield neglect along with left upper extremity apraxia and myoclonic jerks. She scored 32/38 on STMS, 0/4 points on construction and 2/4 points on delayed recall. She had optic apraxia, simultanagnosia, left upper extremity apraxia, and astereognosis of the left hand. She was enrolled in a Mayo Clinic neuroimaging study and had a positive amyloid and tau PET scan. (D) Patient 2 18F-AV1451 tau PET axial slices (SUVR range to the left—mean SUVR 1.64). (E) Patient 2 PiB amyloid PET (SUVR range at the bottom—mean SUVR 2.48).
Figure 3
Figure 3
Relationship between age of onset and eigenbrain weights. Age of reported symptom onset was significant across multiple eigenbrain vectors (with over 50% of variance explained by eigenbrain vectors), but this association was strongest in EB4 and EB7. (A) Four individuals with a wide variation in age are mapped onto the eight primary eigenbrains. Positive weighting to EB7 and/or negative weighting to EB4 are associated with younger age of symptom onset (Patient 1 and 2). Positive weighting to EB4 and/or negative weighting to EB7 are associated with older age of symptom onset (Patient 3 and 4). (B) The four individual FDG PET scans are shown in the same anatomical orientation as Fig. 2. (C) Eigenbrain 4 has a significant association with reported age of symptom onset (r2 = 0.23, t-value 5.2, P < 0.001). (D) Eigenbrain 7 had an opposite but significant association with reported age of symptom onset (r2 = 0.15, t-value −3.8, P < 0.001).

References

    1. Renner J, Burns J, Hou C, McKeel D, Storandt M, Morris J.. Progressive posterior cortical dysfunction: A clinicopathologic series. Neurology. 2004;63(7):1175–1180. - PubMed
    1. Tang-Wai DF, Graff-Radford N, Boeve BF, et al.Clinical, genetic, and neuropathologic characteristics of posterior cortical atrophy. Neurology. 2004;63(7):1168–1174. - PubMed
    1. Firth NC, Primativo S, Marinescu R-V, et al.Longitudinal neuroanatomical and cognitive progression of posterior cortical atrophy. Brain. 2019;142(7):2082–2095. - PMC - PubMed
    1. Benson DF, Davis RJ, Snyder BD.. Posterior cortical atrophy. Case reports. Arch Neurol. 1988;45(7):789–793. - PubMed
    1. Crutch SJ, Schott JM, Rabinovici GD, et al.Alzheimer's Association ISTAART Atypical Alzheimer's Disease and Associated Syndromes Professional Interest Area. Consensus classification of posterior cortical atrophy. Alzheimers Dement. 2017;13(8):870–884. - PMC - PubMed

LinkOut - more resources