. 2022 Jan;39(1-2):211-226.
doi: 10.1089/neu.2021.0204.

Mild Traumatic Brain Injury/Concussion Initiates an Atypical Astrocyte Response Caused by Blood-Brain Barrier Dysfunction

Affiliations

Mild Traumatic Brain Injury/Concussion Initiates an Atypical Astrocyte Response Caused by Blood-Brain Barrier Dysfunction

Kijana K George et al. J Neurotrauma. 2022 Jan.

Abstract

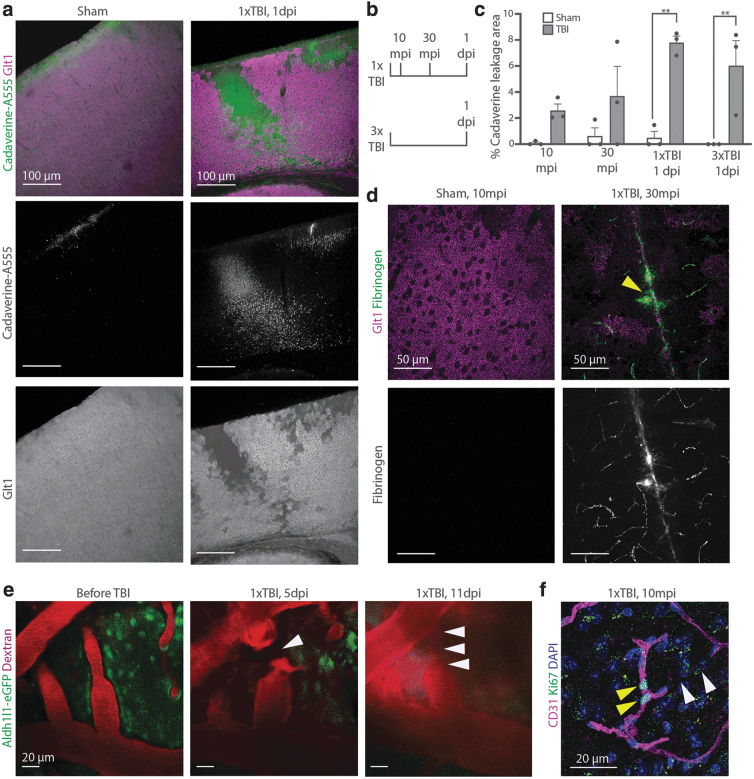
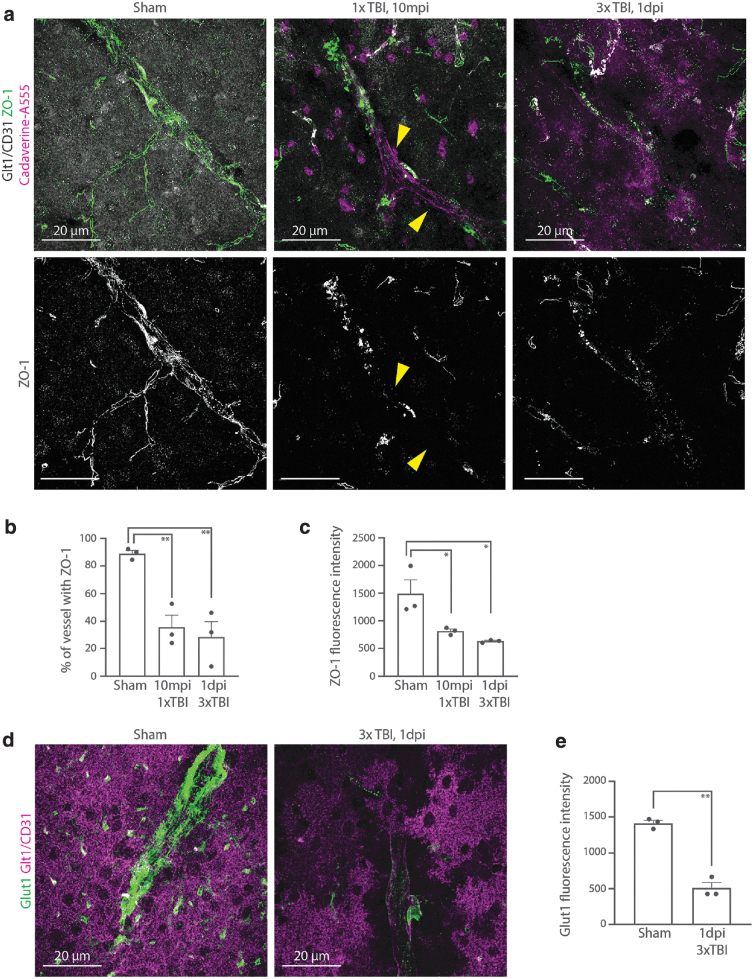
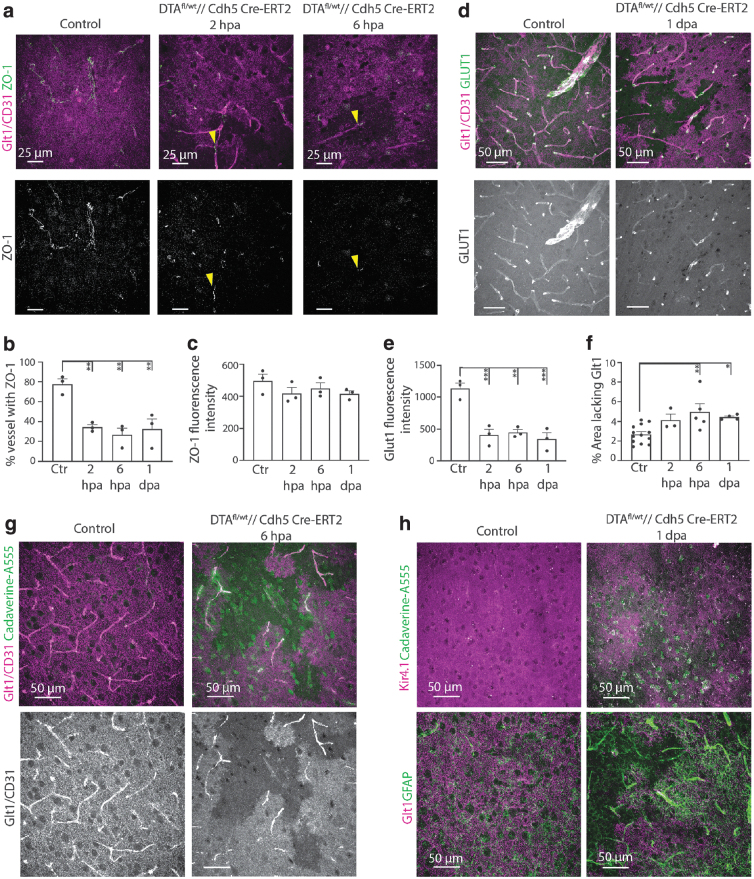
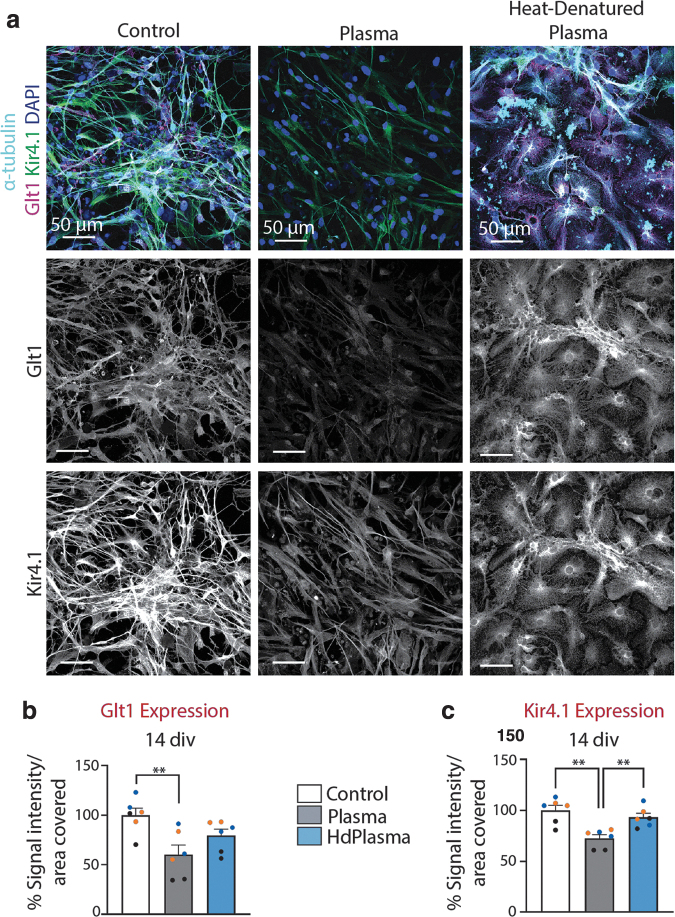
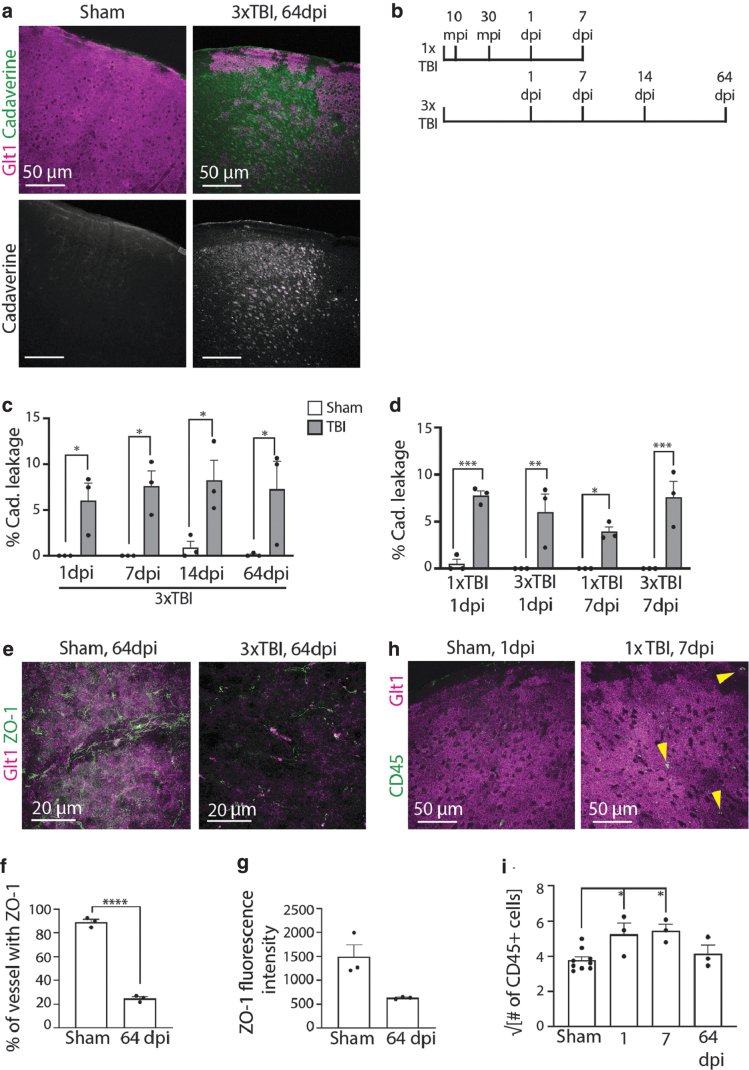
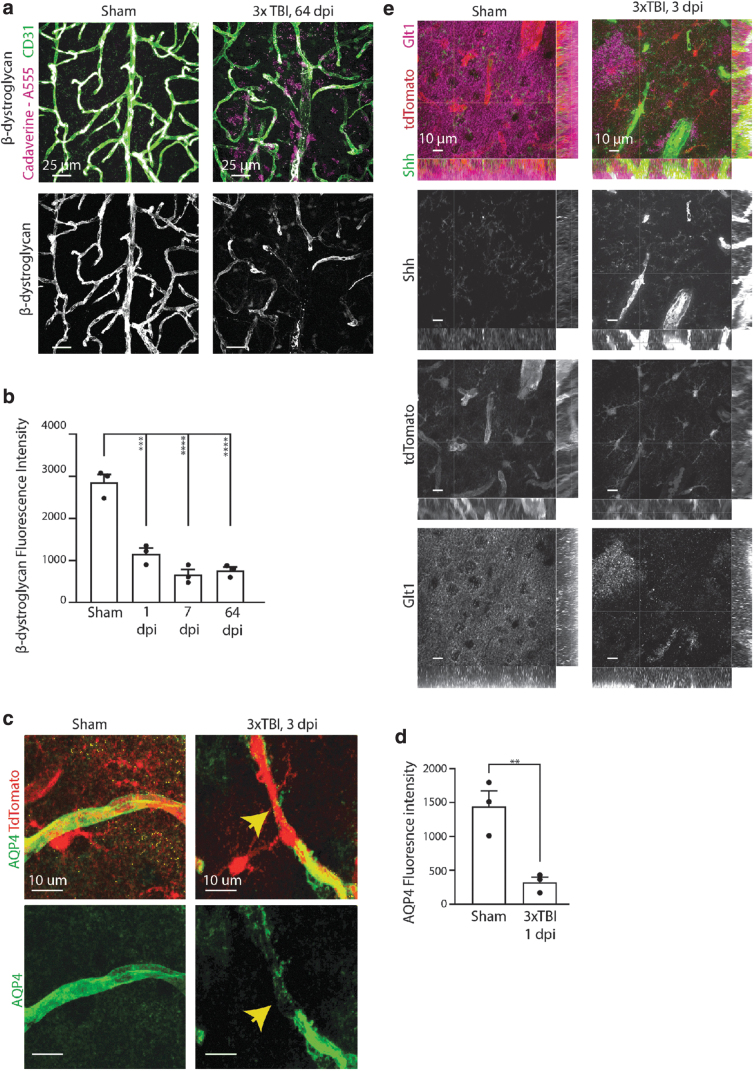
Mild traumatic brain injury/concussion (mTBI) accounts for 70-90% of all reported TBI cases and causes long-lasting neurological consequences in 10-40% of patients. Recent clinical studies revealed increased blood-brain barrier (BBB) permeability in mTBI patients, which correlated with secondary damage after mTBI. However, the cascade of cellular events initiated by exposure to blood-borne factors resulting in sustained damage is not fully understood. We previously reported that astrocytes respond atypically to mTBI, rapidly losing many proteins essential to their homeostatic function, while classic scar formation does not occur. Here, we tested the hypothesis that mTBI-induced BBB damage causes atypical astrocytes through exposure to blood-borne factors. Using an mTBI mouse model, two-photon imaging, an endothelial cell-specific genetic ablation approach, and serum-free primary astrocyte cultures, we demonstrated that areas with atypical astrocytes coincide with BBB damage and that exposure of astrocytes to plasma proteins is sufficient to initiate loss of astrocyte homeostatic proteins. Although mTBI resulted in frequent impairment of both physical and metabolic BBB properties and leakage of small-sized blood-borne factors, deposition of the coagulation factor fibrinogen or vessel rupture were rare. Surprisingly, even months after mTBI, BBB repair did not occur in areas with atypical astrocytes. Together, these findings implicate that even relatively small BBB disturbances are sustained long term, and render nearby astrocytes dysfunctional, likely at the cost of neuronal health and function.

Keywords: BBB repair; astrogliosis; brain injury; brain vasculature; repeated mild TBI; tight junctions.


Conflict of interest statement

No competing financial interests exist.

Figures

FIG. 1.
FIG. 1.
Blood–brain barrier leakage occurs in areas of atypical astrocytes after mild/concussive traumatic brain injury (TBI). (a) Cadaverine leakage occurred in the cortex by 10 min after a single mild TBI (mTBI) and overlapped with regions of atypical astrocytes indicated by lack of expression of glutamate transporter-1 (Glt1). (b) Cadaverine was injected 30 min before perfusion for each time point. Single (1xTBI) and/or repeated (3xTBI) were induced at the time points listed. (c) Cadaverine leakage was quantified as percent area of total cortex and plotted by animal. For 1 day post-injury (dpi), both 1xTBI and 3xTBI were examined. Data points are plotted by animal. (1x sham 10 minutes post-injury [mpi], 0.0864 ± 0.0834, n = 3;1xTBI 10 mpi, 2.5886 ± 0.4985, n = 3; sham 30 mpi, 0.6329 ± 0.6329 1xTBI 30 mpi, 3.6953 ± 2.2832, n = 3; 1x sham 1 dpi; 0.4930 ± 0.4930 1xTBI 1 dpi, 9.072 ± 2.086, n = 3; 3x sham 1dpi, 0 ± 0;3xTBI 1 dpi, 6.0253 ± 1.9186, n = 3. Two -way analysis of variance [ANOVA] significant for post-injury time point, p < 0.0001; Sidak's multiple comparisons test. Sham vs. 1xTBI 10 mpi, p = 0.4375; sham vs. 1xTBI 30 mpi, p = 0.2560; Sham vs. 1xTBI 1 dpi, p = 0.0012; sham vs. 3xTBI 1 dpi, p = 0.0063). (d) Areas of fibrinogen deposition (yellow arrowhead), a large plasma protein, were found in sparse numbers in regions of atypical astrocytes indicated by lack of Glt1 expression. (e) Live imaging of dextran-labeled vessels using two-photon microscopy revealed vessel rupture (white arrowheads) and reduced perfusion at 5 dpi. Reperfusion and repair of the same vessel (multiple white arrowheads) was observed at 11 dpi. (f) The cell cycle marker Ki67 co-localized with the vessel marker cluster of differentiation (CD)31 (yellow arrowheads) in areas of abruptly short vessel patterns (white arrowheads), which indicated vessel proliferation. Of the nine mice and 27 slices examined after mTBI, only three mice and 3 slices (one slice in each mouse) showed Ki67+/CD31+ co-localization. For nine sham mice and 12 slices examined, no co-localization was detected. Color image is available online.
FIG. 2.
FIG. 2.
The blood–brain barrier is damaged after mild traumatic brain injury (mTBI). (a) Labeling of the tight junction protein zonula occludens-1 (ZO-1) was reduced and discontinuous after single and repeated mTBI, occurring in areas of atypical astrocytes (indicated by lack of glutamate transporter-1 [Glt1] expression) and Cadaverine leakage. Some vessels completely lacked ZO-1 labeling (yellow arrowheads). (b) Continuity in ZO-1 labeling of vessels was quantified by binarizing the ZO-1 signal and drawing a line along the vessel using the vessel marker cluster of differentiation (CD31) as a guide. The percentage of pixels with ZO-1 was calculated as percent of vessel with ZO-1 and was plotted by animal. Data points are plotted by animal. (Sham, 89.05 ± 2.301, n = 3; 1xTBI 10 minutes post-injury [mpi], 35.65 ± 8.654, n = 3; 3xTBI 1 days post-injury [dpi], 28.33 ± 11.40, n = 3. One-way analysis of variance [ANOVA] significant for post-injury time point, p = 0. 0041. Dunn's multiple comparisons test. Sham vs. 1xTBI 10 mpi, p = 0. 0073; sham vs. 3xTBI 1 dpi, p = 0. 0039). (c) Fluorescence intensity for the lines drawn in b were quantified and reported as mean gray scale (GS) units. (Sham, 1492 ± 251.6, n = 3; 1xTBI 10 mpi, 814.7 ± 38.31, n = 3; 3xTBI 1 dpi, 632.6 ± 14.37, n = 3; one-way ANOVA significant for post-injury time point, p = 0.0139. Tukey's multiple comparisons test. Sham vs. 1xTBI 10 mpi, p = 0.0398; sham vs. 3xTBI 1 dpi, p = 0.0145). (d) The endothelial glucose transporter-1 (GLUT1) was greatly reduced in its labeling at vessels after mTBI in areas of atypical astrocytes indicated by lack of expression of Glt1. (e) Fluorescence intensity of GLUT1 was quantified after mTBI and reported as mean GS units. Data points are plotted by animal. (Sham, 1416 ± 41.32, n = 3; 3xTBI 1 dpi, 508.8 ± 79.17, n = 3; Mann–Whitney test. Sham vs. 3xTBI 1 dpi, p = 0.002). Color image is available online.
FIG. 3.
FIG. 3.
Blood–brain barrier (BBB) leakage induced via endothelial-cell specific genetic ablation is sufficient to trigger atypical astrocytes in the absence of mild traumatic brain injury (mTBI)/ concussion. (a) Zonula occludens-1 (ZO-1) covering of cluster of differentiation (CD)31+ vessels was reduced as early as 2 h after endothelial cell ablation and occurred in areas of atypical astrocytes, indicated by lack of glutamate transporter-1 (Glt1) expression (yellow arrowheads). (b) Continuity in ZO-1 labeling of vessels overlapping with atypical astrocytes was calculated as shown in Figure 2b. Data points are plotted by animal. (Control, 77.60 ± 5.497, n = 3; 2 hours post-administration [hpa], 34.52 ± 2.570, n = 3; 6 hpa, 26.82 ± 6.802, n = 3; 1 days post-administration [dpa], 32.61 ± 10.08, n = 3. One-way analysis of variance [ANOVA] significant for post-administration time point. p = 0.0026. Dunnett's multiple comparisons tests. p < 0.0001. Control vs. 2 hpa, p = 0.0053; control vs. 6 hpa, p = 0.0019; control vs. 1 dpa, p = 0.0041). (c) Fluorescence intensity for the ZO-1 lines drawn in b were reported as gray scale values. Data points are plotted by animal. (Control, 495.4 ± 44.22, n = 3; 2 hpa, 417.1 ± 37.37, n = 3; 6 hpa, 448.5 ± 35.16, n = 3, 1 dpa, 415 ± 19.10, n = 3. One-way ANOVA not significant for post-administration time point. p = 0.3907. Dunnett's multiple comparisons test. p = 0.2543. Control vs. 2 hpa, p = 0.329; control vs. 6 hpa, p = 0.681; control vs. 1 dpa, p = 0.3118). (d) Glucose transporter-1 (GLUT1) labeling was reduced at vessels in atypical astrocyte areas lacking Glt1 after genetically ablating endothelial cells after 2 hpa. (e) Fluorescence intensity of GLUT1 in areas of atypical astrocytes was calculated and reported as gray scale values. Data points are plotted by animal. (Control, 1134 ± 88.85, n = 3; 2 hpa, 404.1 ± 93.97, n = 3; 6 hpa, 446.4 ± 47.41, n = 3; 1 dpa, 338.5 ± 102.9, n = 3. One-way ANOVA significant for post-administration time point. p = 0.0006. Dunnett's multiple comparisons tests. p < 0.0001. Control vs. 2 hpa, p = 0.0008; control vs. 6 hpa, p = 0.0013; control vs. 1 dpa, p = 0.0005). (f) The percent area lacking Glt1 in cortex was quantified per slice at 2 h, 6 h, and 1 day after endothelial cell ablation. Data points represent the percentage of area lacking Glt1 per animal in each group. (Control, 2.703 ± 0.2573, n = 12; 2 hpa, 4.139 ± 0.6135, n = 3; 6 hpa, 4.960 ± 0.8508, n = 5; 1 dpa, 4.436 ± 0.1246, n = 4. One-way ANOVA significant for post-administration time point. p = 0.004. Dunnett's multiple comparisons tests. p = 0.0002. Control vs. 2 hpa, p = 0.1663; control vs. 6 hpa, p = 0.0033; control vs. 1 dpa, p = 0.0415). (g) A decrease in Glt1 labeling occurred as early as 2 hpa and overlapped with areas of Cadaverine leakage. (h) Kir4.1 loss occurred in areas of atypical astrocytes (areas lacking Glt1), while glial fibrillary acidic protein (GFAP) boundary formation occurred in areas adjacent to atypical astrocytes at 1 dpa. Color image is available online.
FIG. 4.
FIG. 4.
Glutamate transporter-1 (Glt1) and Kir4.1 expression in astrocytes is reduced 24 h after plasma treatment in vitro. (a) Treatment with heat-denatured plasma rescued both Glt1 and Kir4.1 expression in primary astrocyte cultures maintained in serum-free media for 14 days in vitro (div). (b, c) Glt1 and Kir4.1 expression was quantified by dividing the mean gray value by the area coverage of each protein, then data were normalized with respect to the control group. Data points represent cover-slip and are color coded in respect to each independent culture. Glt1: control, 100 ± 7.133, six cover-slips in three independent cultures; Plasma: 60.19 ± 9.743, six cover-slips in three independent cultures; HdPlasma: 79.53 ± 6.402, six cover-slips in three independent cultures. One-way analysis of variance (ANOVA) significant for treatment. p = 0.01. Tukey's multiple comparisons test. p < 0.0001. Control versus plasma, p = 0.0074; control versus HdPlasma, p = 0.1922; plasma versus HdPlasma, p = 0.2257. Kir4.1: control, 100 ± 5.006, six cover-slips in three independent cultures; plasma, 72.45 ± 3.705, six cover-slips in three independent cultures; HdPlasma, 93.30 ± 4.001, six cover-slips in three independent cultures. One-way ANOVA significant for treatment. p = 0.001. Tukey's multiple comparisons test. p < 0.0001. Control versus plasma, p = 0.001. Control versus HdPlasma, p = 0.0.5236. Plasma versus HdPlasma, p = 0.0094. HdPlasma, heat denatured plasma. Color image is available online.
FIG. 5.
FIG. 5.
The blood–brain barrier (BBB) fails to repair after mild traumatic brain injury (mTBI). (a) Cadaverine leakage was still present at 64 days post-injury (dpi). (b) Mice were examined at later time points after 3xTBI or 1xTBI. (c) Cadaverine leakage was quantified at later time points after 3xTBI as percent area of total cortex and plotted by animal. Data points are plotted by animal. (3x sham 1dpi, 0 ± 0, n = 3; 3xTBI 1 dpi, 6.0253 ± 1.9186, n = 3; 3x sham 7 dpi, 0 ± 0; 3xTBI 7 dpi, 7.5890 ± 1.6852, n = 3; 3x sham 14 dpi, 0.8845 ± 0.6973; 3xTBI 14 dpi, 8.2640 ± 2.1837, n = 3; 3x sham 64 dpi, 0.0963 ± 0.0963; 3xTBI 64 dpi, 7.2668 ± 3.051, n = 3. Kruskal–Wallis test significant for post-injury time point, p < 0.0001. Sidak multiple comparisons test. 3xSham vs. 3xTBI 1 dpi, p = 0.0717; sham vs. 3xTBI 7 dpi, p = 0.0178; sham vs. 3xTBI 14 dpi, p = 0.0215; sham vs. 3xTBI 64 dpi, p = 0.0260). (d) Cadaverine leakage quantifications were compared between the 1 dpi and 7 dpi time points after either 1xTBI or 3xTBI. (1x sham 1dpi, 0.0493 ± 0.0493, n = 3; 1xTBI 1 dpi, 7.7900 ± 0.50.62, n = 3; 1x sham 7dpi, 0 ± 0, n = 3; 1xTBI 7 dpi, 6.0253 ± 1.9186, n = 3; 3x sham 1 dpi, 0 ± 0 =  n = 3; 3xTBI 1 dpi, 3.9183 ± 0.5503, n = 3; 3x sham 7 dpi, 0 ± 0, n = 3; 3xTBI 7 dpi, 3xTBI 7 dpi, 7.5890 ± 1.6853, n = 3. Two-way analysis of variance [ANOVA] significant for number of injuries, p < 0.0001; 1x sham 7 dpi vs. 1xTBI 7 dpi, p = 0.0415; 3x sham 7 dpi vs. 3xTBI 7 dpi, p = 0.0002; 1x sham 1 dpi vs. 1xTBI 1 dpi, p = 0.0002, 3x sham vs. 3xTBI 1 dpi, p = 0.0002; Tukey's multiple comparisons test. 1x sham 1dpi vs. 3x sham 1 dpi, p = 0.9898; 1x sham 1dpi vs. 1x sham 7 dpi, p = 0.9829; 1x sham 1dpi vs. 3x sham 7 dpi, p = 0.9829; 3x sham 1dpi vs. 1x sham 7 dpi, p > 0.9999; 3x sham 1 dpi vs. 3x sham 7 dpi, p > 0.9999; 1x sham 7dpi vs. 3x sham 7dpi, p > 0.9999; 1xTBI 1 dpi vs. 1xTBI 7 dpi, p = 0.0.05; 3xTBI 1 dpi vs. 3xTBI 7 dpi, p = 0.5737.) (e) Lack of zonula occludens-1 (ZO-1) persists at 64 dpi. (f) Continuity of ZO-1 labeling along vessels was quantified at 64 dpi 3xTBI in areas of atypical astrocytes as shown in Fig 2b. Data points are plotted by animal (Sham, 11.02 ± 2.602, n = 3; 3xTBI 8 weeks post-injury [wpi], 75.08 ± 1.531, n = 3. Unpaired t test for sham vs. 3xTBI 8 wpi, p < 0.0001). (g) Fluorescence intensity for the ZO-1 lines drawn in e were reported as gray scale values. (Sham, 1492 ± 251.5, n = 3; 3xTBI 8 wpi, 632.5 ± 14.13, n = 3; unpaired t test for sham vs. 3xTBI 8 wpi, p = 0.0755). (h) Clusters of CD45+ cells appeared in cortex after mTBI, while CD45+ in sham mice were found localized to meninges. (i) Immune cell infiltration was quantified by taking the square root of the total number of CD45+ cells per animal. Data points are plotted by animal. (Sham, 3.772 ± 0.2013, n = 9; 1 dpi, 5.241 ± 0.0.6588, n = 3; 7 dpi, 5.452 ± 0.3717, n = 3; 64 dpi, 4.145 ± 0.4912, n = 3. One-way ANOVA significant for post-injury time point. p < 0.0001 Tukey's multiple comparisons tests. p = 0.0106. Sham vs. 1 dpi, p = 0.0461; sham vs. 7 dpi, p = 0.0209, sham vs. 64 dpi, p = 0.8754; 1 dpi vs. 7 dpi, p = 0.851 1 dpi vs. 64 dpi, p = 0.1032; 7 dpi vs. 64 dpi, p = 0.1872). Color image is available online.
FIG. 6.
FIG. 6.
(a) β-dystroglycan is significantly lost after mild traumatic brain injury (mTBI) at 1 day post-injury (dpi). (b) Fluorescence intensity for the β-dystroglycan in areas of atypical astrocytes was calculated and reported as gray scale values. Data points are plotted by animal. (Sham, 2856 ± 188.7, n = 3; 3xTBI 1 dpi, 1158 ± 135, n = 3, 3xTBI 7 dpi, 659.9 ± 123.5, n = 3; 3xTBI 64 dpi, 760.2 ± 83.51. One-way analysis of variance [ANOVA] significant for post-injury time point. p < 0.0001. Tukey's multiple comparisons test. Sham vs. 1 dpi, p = 0.0001; sham vs. 7 dpi, p < 0.0001; sham vs. 64 dpi, p < 0.0001; 1 dpi vs. 7 dpi, p = 0.1244; 1 dpi vs. 64 dpi, p = 0.2503; 7 dpi vs. 64 dpi, p = 0.9533). (c) Astrocytic end feet remain intact, but aquaporin-4 (AQP4) is reduced after mTBI. (d) Fluorescence intensity of AQP4 in areas of atypical astrocytes was calculated and reported as gray scale values. Data points are plotted by animal. (Sham, 1440 ± 229.7, n = 3, 3xTBI 1 dpi, 320.6 ± 78.54, n = 3. Unpaired t test for sham vs. 3xTBI. p = 0.0099). (e) Sonic hedgehog (Shh) signaling is localized mostly along blood vessel after mTBI, compared with sham, in which Shh signaling is located more along the fine processes of tdTomato+ astrocytes. Color image is available online.

References

    1. Cassidy, J.D., Carroll, L.J., Peloso, P.M., Borg, J., von Holst, H., Holm, L., Kraus, J., and Coronado, V.G. (2004). Incidence, risk factors and prevention of mild traumatic brain injury: results of the WHO Collaborating Centre Task Force on Mild Traumatic Brain Injury. J. Rehabil. Med. 43, Suppl., 28–60. - PubMed
    1. Fehily, B., and Fitzgerald, M. (2017). Repeated mild traumatic brain injury: potential mechanisms of damage. Cell Transplant. 26, 1131–1155. - PMC - PubMed
    1. Fehily, B., and Fitzgerald, M. (2017). Repeated mild traumatic brain injury: potential mechanisms of damage. Cell Transplant. 26, 1131–1155. - PMC - PubMed
    1. Willer, B., and Leddy, J.J. (2006). Management of concussion and post-concussion syndrome. Curr. Treat. Options Neurol. 8, 415–426. - PubMed
    1. Bolton-Hall, A.N., Hubbard, W.B., and Saatman, K.E. (2019). Experimental designs for repeated mild traumatic brain injury: challenges and considerations. J. Neurotrauma 36, 1203–1221. - PMC - PubMed

Publication types