. 2021 Jan-Dec:20:15330338211052154.
doi: 10.1177/15330338211052154.

Exploration of the Tumor Mutational Burden as a Prognostic Biomarker and Related Hub Gene Identification in Prostate Cancer

Affiliations

Exploration of the Tumor Mutational Burden as a Prognostic Biomarker and Related Hub Gene Identification in Prostate Cancer

Licheng Wang et al. Technol Cancer Res Treat. 2021 Jan-Dec.

Abstract

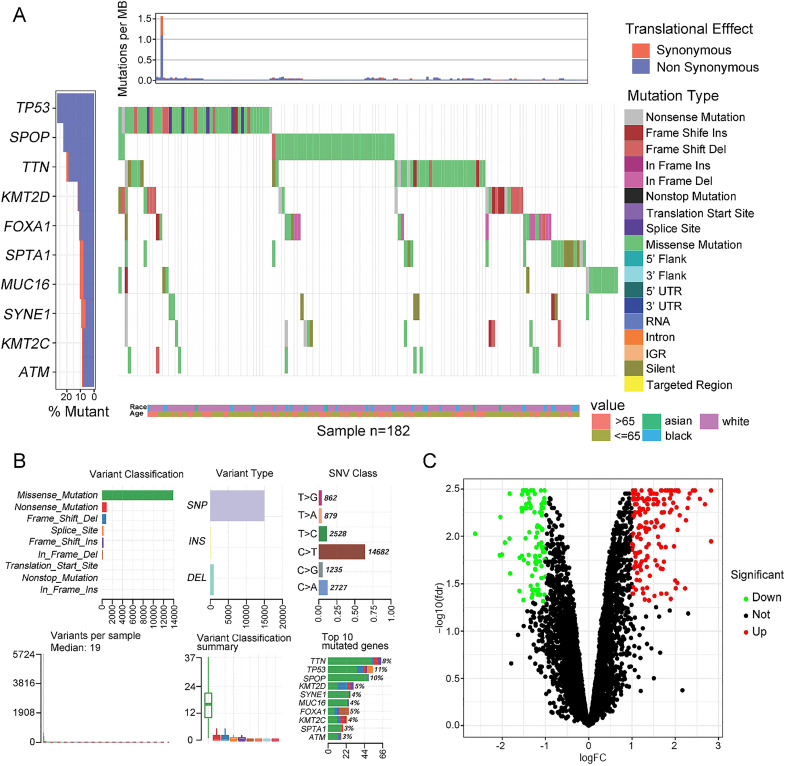
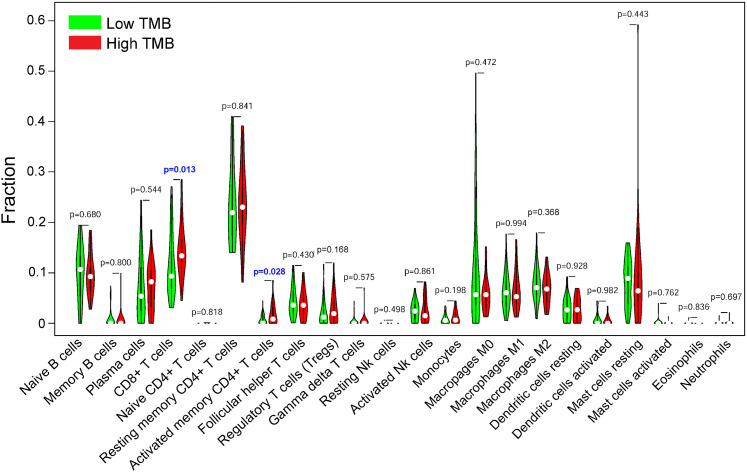
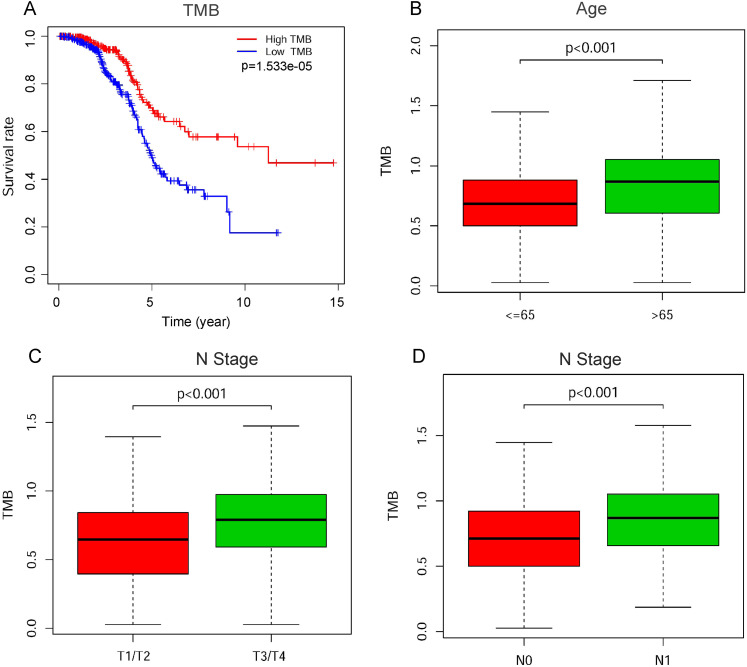
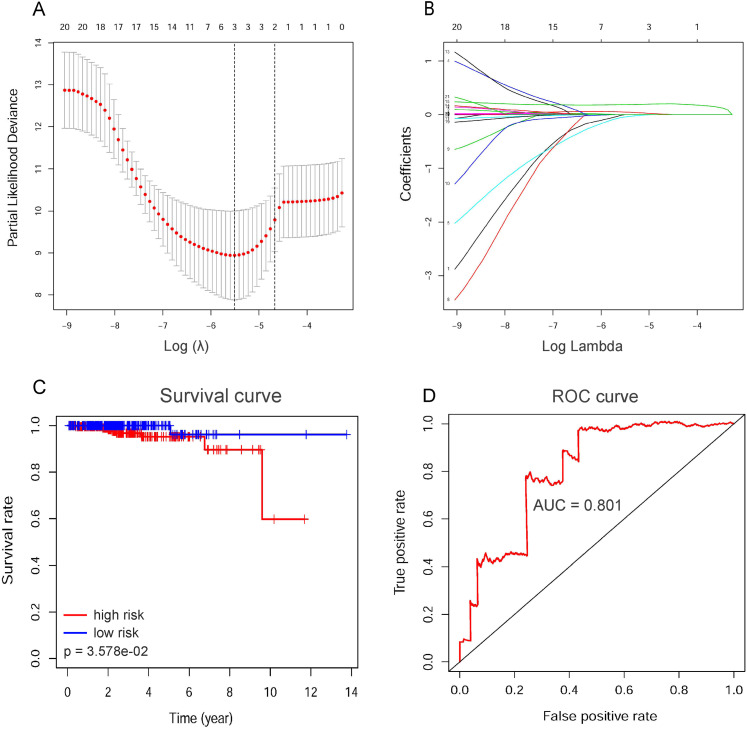
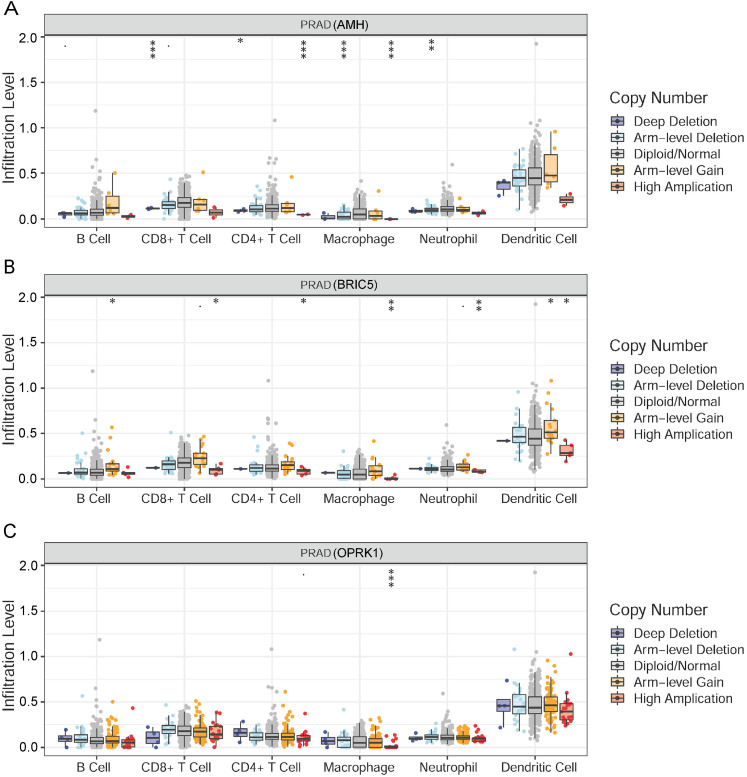
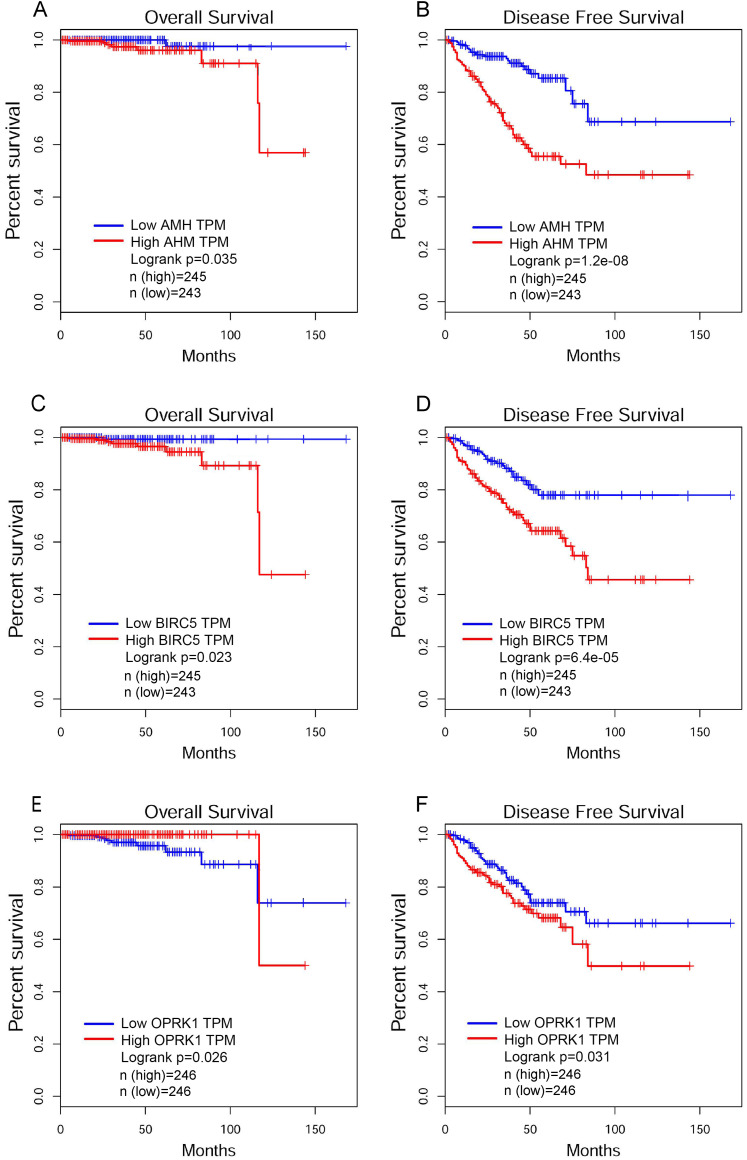
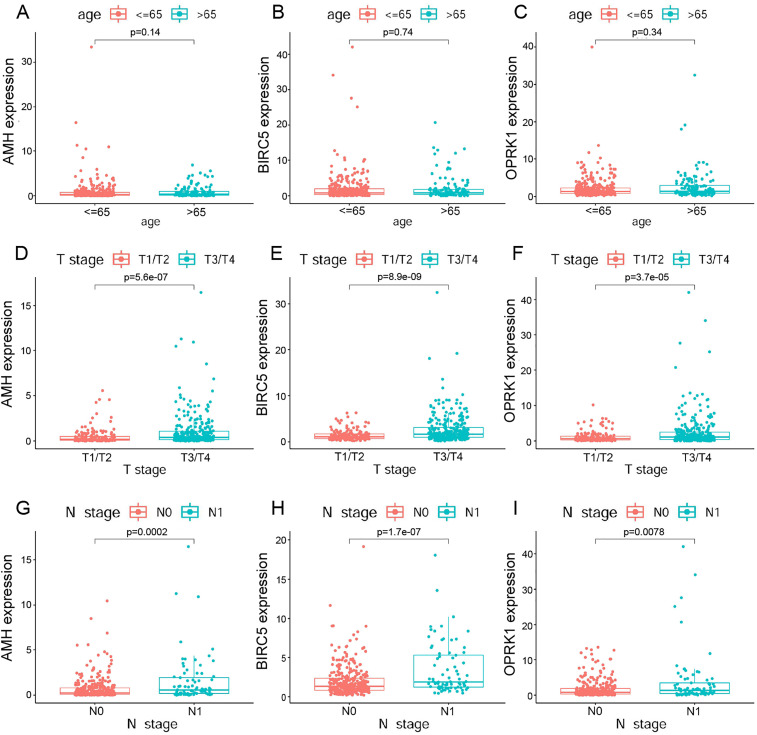
To explore the signature function of the tumor mutational burden (TMB) and potential biomarkers in prostate cancer (PCa), transcriptome profiles, somatic mutation data, and clinicopathologic feature information were downloaded from The Cancer Genome Atlas (TCGA) database. R software package was used to generate a waterfall plot to summarize the specific mutation information and calculate the TMB value of PCa. Least absolute shrinkage and selection operator (LASSO) Cox regression analysis was used to select the hub genes related to the TMB from the ImmPort network to build a risk score (RS) model to evaluate prognostic values and plot Kaplan-Meier (K-M) curves to predict PCa patients survival. The results showed that PCa patients with a high TMB exhibited higher infiltration of CD8+ T cells and CD4+ T cells and better overall survival (OS) than those with a low TMB. The anti-Mullerian hormone (AMH), baculoviral IAP repeat-containing 5 (BIRC5), and opoid receptor kappa 1 (OPRK1) genes were three hub genes and their copy number variation (CNV) was relatively likely to affect the infiltration of immune cells. Moreover, PCa patients with low AMH or BIRC5 expression had a longer survival time and lower cancer recurrence, while elevated AMH or BIRC5 expression favored PCa progression. In contrast, PCa patients with low OPRK1 expression had poorer OS in the early stage of PCa and a higher recurrent rate than those with high expression. Taken together, these results suggest that the TMB may be a promising prognostic biomarker for PCa and that AMH, OPRK1, and BIRC5 are hub genes affecting the TMB; AMH, OPRK1, and BIRC5 could serve as potential immunotherapeutic targets for PCa treatment.

Keywords: biomarker; hub gene; immune cell infiltration; prostate cancer; tumor mutational burden.


Conflict of interest statement

Declaration of Conflicting Interests: The author(s) declared no potential conflicts of interest with respect to the research, authorship, and/or publication of this article.

Figures

Figure 1.
Figure 1.
PCa mutation cohort in the TCGA. (A) Waterfall plot of the top 10 mutated genes in the TCGA PCa cohort. (B) Overview of mutations in the TCGA PCa cohort. (C) Volcano plot of DEGs between the high- and low-TMB groups. Upregulated genes are shown in green, downregulated genes are shown in red, and non-DEGs are shown in black.
Figure 2.
Figure 2.
Differential analysis of 22 types of TIICs between the high- and low-TMB groups. CD8+ T cells and activated memory CD4+ T cells showed higher infiltration in the high-TMB group than in the low-TMB group (P < 0.05). There were no significant differences in the other 20 types of TIICs between the 2 TMB groups.
Figure 3.
Figure 3.
TMB-related clinical feature analysis. (A) Overall survival (OS) of the high- and low-TMB groups. The high-TMB group had longer survival than the low-TMB group (P < 0.001). (B) R software analysis of patients stratified by age. PCa patients older than 65 years had a significantly higher TMB than those younger than 65 years (P < 0.001). (C) R software analysis of patients stratified by T stage. The higher the T stage was, the higher the TMB value. (D) R software analysis of patients stratified by N stage. The TMB value of N1 patients was higher than that of N0 patients (P < 0.001).
Figure 4.
Figure 4.
Construction of the RS model for evaluating the prognostic value of three hub genes. (A) RS modeling by the LASSO Cox regression algorithm to screen 21 overlapping genes. (B) Distribution of the LASSO coefficients of the 21 overlapping genes. (D) Kaplan–Meier (K-M) plots of overall survival (OS) were generated with the RS model. (D) ROC curve evaluating the predictive efficiency of the RS model.
Figure 5.
Figure 5.
Effects of the CNV of AMH, BIRC5, and OPRK1 genes on immune cell infiltration. (A) The effect of the CNV of the AMH gene on six types of infiltrating immune cells in PCa. The CNV of the AMH gene relatively stronger affected the infiltration of CD8+ T cells, CD4+ T cells, macrophages, and neutrophils. (B) The effect of the CNV of the BIRC5 gene on six types of infiltrating immune cells in PCa. All six immune cell types were influenced by the CNV of the BIRC5 gene. (C) The effect of the CNV of the OPRK1 gene on six types of infiltrating immune cells in PCa. The CNV of the OPRK1 gene had a strong impact on macrophage infiltration.
Figure 6.
Figure 6.
K-M plots of the OS and DFS of PCa patients stratified by AMH, BIRC5, or OPRK1. (A–B) OS and DFS of AMH analyses based on AMH showed that high expression of AMH could shorten survival time and promote disease progression. (C–D) OS and DFS analyses based on BIRC5 showed that elevated BIRC5 expression could decrease the survival rates and promote disease progression. (E–F) OS analysis based on OPRK1 showed that high expression of OPRK1 might result in an elevated death rate in the early stage of PCa. DFS analysis based on OPRK1 showed that elevated OPRK1 expression might decrease the survival rate and increase tumor progression.
Figure 7.
Figure 7.
The relationship of the expression of the three hub genes and clinicopathologic features in PCa. (A–C) There were no significant differences in the expression of AMH, BIRC5, or OPRK1 between the two age groups (all P values > 0.05). (D–F) The expression levels of AMH, BIRC5, and OPRK1 were higher in T3/T4 than in T1/T2 (all P values < 0.001), which showed that the expression of the three hub genes might promote tumor progression. (G–I) The expression levels of AMH, BIRC5, and OPRK1 were higher in the N1 stage than in the N0 stage (all P values < 0.01), which revealed that the expression of the three hub genes might promote tumor metastasis.

Similar articles

Cited by

References

    1. Bray F, Ferlay J, Soerjomataram I, et al. Global cancer statistics 2018: GLOBOCAN estimates of incidence and mortality worldwide for 36 cancers in 185 countries. CA Cancer J Clin. 2018;68(6):394-424. - PubMed
    1. Antonarakis ES, Lu C, Wang H, et al. AR-V7 and resistance to enzalutamide and Abiraterone in prostate cancer. N Engl J Med. 2014;371(11):1028-1038. - PMC - PubMed
    1. Asangani IA, Dommeti VL, Wang X, et al. Therapeutic targeting of BET bromodomain proteins in castration-resistant prostate cancer. Nature. 2014;510(7504):278-282. - PMC - PubMed
    1. Litwin MS, Tan HJ. The diagnosis and treatment of prostate cancer: a review. JAMA. 2017;317(24):2532-2542. - PubMed
    1. Hong Z, Zhang W, Ding D, et al. DNA damage promotes TMPRSS2-ERG oncoprotein destruction and prostate cancer suppression via signaling converged by GSK3beta and WEE1. Mol Cell. 2020;79(6):1008-1023. e1004. - PubMed

Publication types

MeSH terms

Substances