. 2022;85(1):415-429.
doi: 10.3233/JAD-210677.

Site-Specific Cerebrospinal Fluid Tau Hyperphosphorylation in Response to Alzheimer's Disease Brain Pathology: Not All Tau Phospho-Sites are Hyperphosphorylated

Affiliations

Site-Specific Cerebrospinal Fluid Tau Hyperphosphorylation in Response to Alzheimer's Disease Brain Pathology: Not All Tau Phospho-Sites are Hyperphosphorylated

Nicolas R Barthélemy et al. J Alzheimers Dis. 2022.

Abstract

Background: Understanding patterns of association between CSF phosphorylated tau (p-tau) species and clinical disease severity will aid Alzheimer's disease (AD) diagnosis and treatment.

Objective: To evaluate changes in tau phosphorylation ratios to brain imaging (amyloid PET, [18F]GTP1 PET, and MRI) and cognition across clinical stages of AD in two different cohorts.

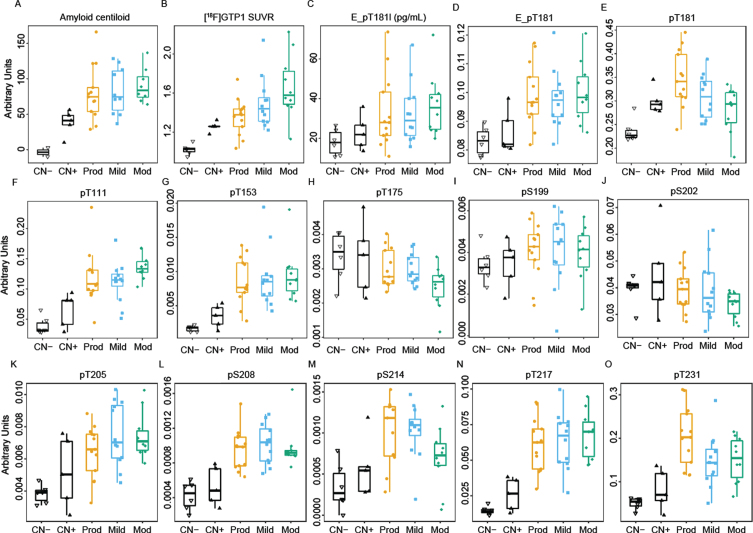
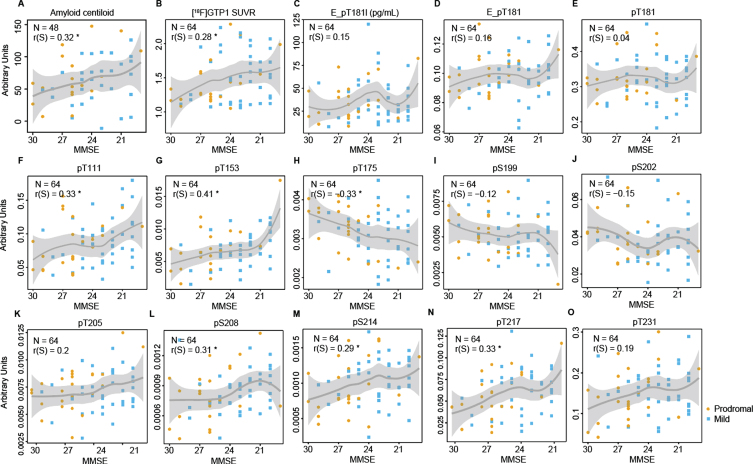
Methods: A mass spectrometry (MS)-based method was used to evaluate the relationship between p-tau/tau phosphorylation ratios on 11 sites in CSF and AD pathology measured by tau PET ([18F]GTP1) and amyloid PET ([18F]florbetapir or [18F]florbetaben). Cohort A included cognitively normal amyloid negative (n = 6) and positive (n = 5) individuals, and amyloid positive prodromal (n = 13), mild (n = 12), and moderate AD patients (n = 10); and Cohort B included amyloid positive prodromal (n = 24) and mild (n = 40) AD patients.

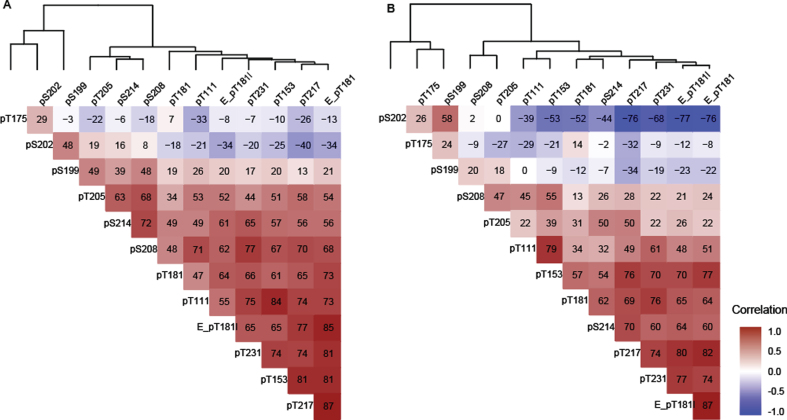
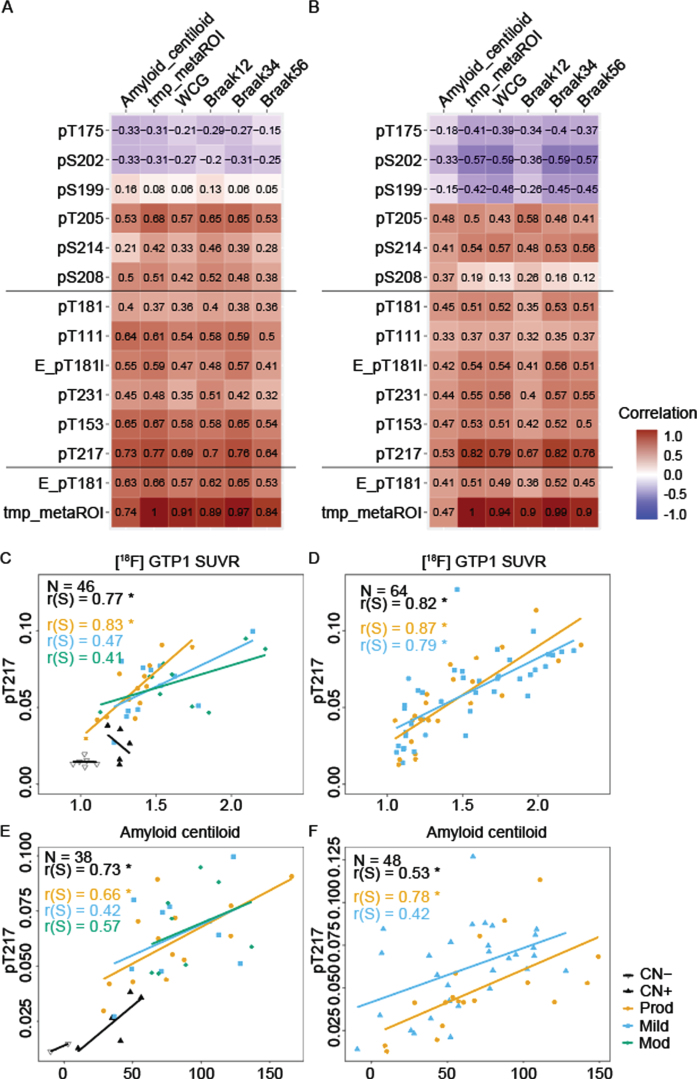
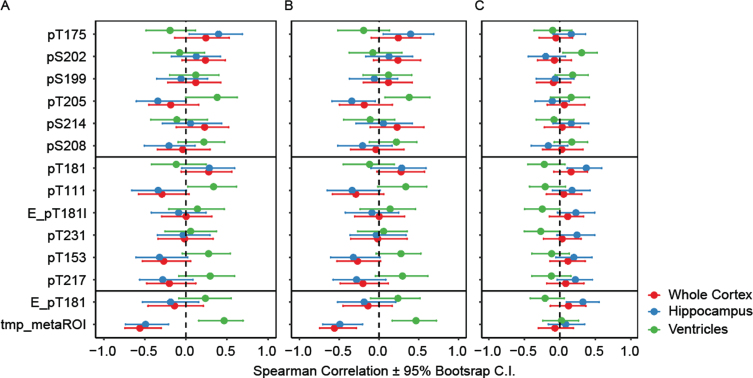
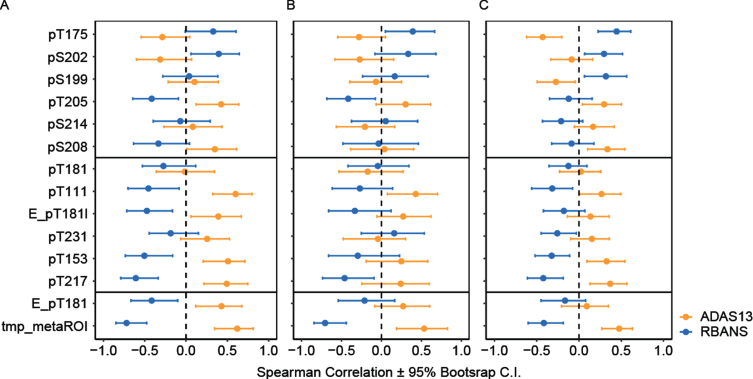
Results: In this cross-sectional analysis, we identified clusters of phosphosites with different profiles of phosphorylation ratios across stages of disease. Eight of 11 investigated sites were hyperphosphorylated and associated with SUVR measures from [18F]GTP1 and amyloid PET. Novel sites 111, 153, and 208 may be relevant biomarkers for AD diagnosis to complement tau hyperphosphorylation measures on previously established sites 181, 205, 217, and 231. Hypophosphorylation was detected on residues 175, 199, and 202, and was inversely associated with [18F]GTP1 and amyloid PET.

Conclusion: Hyperphosphorylated and hypophosphorylated forms of tau are associated with AD pathologies, and due to their different site-specific profiles, they may be used in combination to assist with staging of disease.

Keywords: Alzheimer’s disease; PET; [18F]GTP1; biomarker; cerebrospinal fluid; tau.


Conflict of interest statement

Authors’ disclosures available online (https://www.j-alz.com/manuscript-disclosures/21-0677r2).

Figures

Fig. 1
Fig. 1
Cross-sectional boxplots from Cohort A comparing brain amyloid deposition (A) measured by FBP tracer (Amyloid centiloid), (B) [18F]GTP1 SUVR measuring brain tau aggregates, (C) Elecsys immunoassay measures of pTau181 level (E_pT181l), and (D) ratio of pTau181/tTau (E_pT181), (E) ratio of pTau181/uTau by MS, and (F–O) ratio of other phosphorylated residues by MS. CN-, cognitively normal, amyloid-low control; CN+, amyloid-high control; prod, prodromal; mod, moderate.
Fig. 2
Fig. 2
Scatter plot from Cohort B comparing MMSE and brain amyloid deposition measured by (A) florbetaben or florbetapir tracer (Amyloid centiloid), (B) [18F]GTP1 SUVR measuring brain tau aggregates, (C) Elecsys immunoassay measures of pTau181 level (E_pT181l), and (D) ratio of pTau181/tTau (E_pT181), (E) ratio of pTau181/uTau by MS, and (F–O) on other phosphorylated residues by MS. The polynomial curve and the shaded area show the locally weighted average (tricube weight function with quadratic local regressions) phosphorylation and its 95% confidence interval. orange, prodromal; blue, mild; PET, positron emission tomography; SUVR, standardized uptake value ratio; MMSE, Mini-Mental State Examination.
Fig. 3
Fig. 3
Spearman correlation (x 100) between tau phosphorylation ratios on monitored sites in (A) Cohort A, (B) Cohort B. The two cohorts support the identification of independent groups of association on site-specific phosphorylation occupancies that shift with disease severity. The dendrogram represents clusters of CSF hyperphosphorylation at different sites in Cohort A and resembles the pattern similarities seen in Fig. 1. Red highlight indicates positive correlation, white no correlation, blue negative correlation. Elecsys level (pg/mL):E_pT181l, Elecsys ratio (pTau181/tTau):(E_pT181), others are corresponding MS ratio pTau/uTau).
Fig. 4
Fig. 4
Association between [18F]GTP1 SUVR and CSF p-tau measures. Correlation comparison (Spearman r) between measures of amyloid PET centiloid and brain tau aggregation in various regions of interest using [18F]GTP1 SUVR in select regions of interest (temporal meta: tmp_metaROI, whole cortical grey:WCG, Braak12, Braak34, Braak56) with CSF p-tau measures (middle sites: “pT217 cluster”) and amyloid PET in (A) Cohort A, and (B) Cohort B. Correlation between [18F]GTP1 SUVR (tmp_metaROI) and CSF tau phosphorylation occupancy on T217 in (C) Cohort A and (D) Cohort B. Correlation between Aβ PET(centiloid) and CSF tau phosphorylation occupancy on T217 in (E) Cohort A and (F) Cohort B. Empty triangle, CN- (cognitively normal); solid triangle, CN+; orange, prodromal AD; blue, mild AD; gray, moderate AD. Elecsys pTau181 level (pg/mL):E_pT181l, Elecsys pTau181/tTau ratio: E_pT181, MS pTau/uTau ratios: pX###
Fig. 5
Fig. 5
Association measured by Spearman r between [18F]GTP1 SUVR and CSF p-tau measures with brain atrophy as measured by MRI in different regions in (A) Cohort A, (B) Cohort A excluding cognitively normal individuals, and (C) Cohort B. Middle sites: “pT217 cluster”, Elecsys pTau181 level (pg/mL):E_pT181l, Elecsys pTau181/tTau ratio: E_pT181, MS pTau/uTau ratios: pX###, temporal meta ROI: tmp_metaROI.
Fig. 6
Fig. 6
Association between [18F]GTP1 SUVR (tmp_metaROI) and CSF p-tau measures with cognitive scores in different regions in (A) Cohort A, (B) in Cohort A excluding cognitively normal individuals, and (C) in Cohort B. Middle sites: “pT217 cluster”, Elecsys pTau181 level (pg/mL):E_pT181l, Elecsys pTau181/tTau ratio: E_pT181, MS pTau/uTau ratios: pX###, temporal meta ROI: tmp_metaROI.

References

    1. Nelson PT, Alafuzoff I, Bigio EH, Bouras C, Braak H, Cairns NJ, Castellani RJ, Crain BJ, Davies P, Del Tredici K, Duyckaerts C, Frosch MP, Haroutunian V, Hof PR, Hulette CM, Hyman BT, Iwatsubo T, Jellinger KA, Jicha GA, Kövari E, Kukull WA, Leverenz JB, Love S, Mackenzie IR, Mann DM, Masliah E, McKee AC, Montine TJ, Morris JC, Schneider JA, Sonnen JA, Thal DR, Trojanowski JQ, Troncoso JC, Wisniewski T, Woltjer RL, Beach TG (2012) Correlation of Alzheimer disease neuropathologic changes with cognitive status: A review of the literature. J Neuropathol Exp Neurol 71, 362–81. - PMC - PubMed
    1. Querfurth HW, LaFerla FM (2010) Alzheimer’s disease. N Engl J Med 362, 329–344. - PubMed
    1. Hanger DP, Anderton BH, Noble W (2009) Tau phosphorylation: The therapeutic challenge for neurodegenerative disease. Trends Mol Med 15, 112–9. - PubMed
    1. Despres C, Byrne C, Qi H, Cantrelle FX, Huvent I, Chambraud B, Baulieu EE, Jacquot Y, Landrieu I, Lippens G, Smet-Nocca C (2017) Identification of the Tau phosphorylation pattern that drives its aggregation. Proc Natl Acad Sci U S A 114, 9080–9085. - PMC - PubMed
    1. Augustinack JC, Schneider A, Mandelkow EM, Hyman BT (2002) Specific tau phosphorylation sites correlate with severity of neuronal cytopathology in Alzheimer’s disease. Acta Neuropathol 103, 26–3. - PubMed

Publication types