. 2021 Nov 22;6(22):e152014.
doi: 10.1172/jci.insight.152014.

Benign tumors in TSC are amenable to treatment by GD3 CAR T cells in mice

Affiliations

Benign tumors in TSC are amenable to treatment by GD3 CAR T cells in mice

Ancy Thomas et al. JCI Insight. .

Abstract

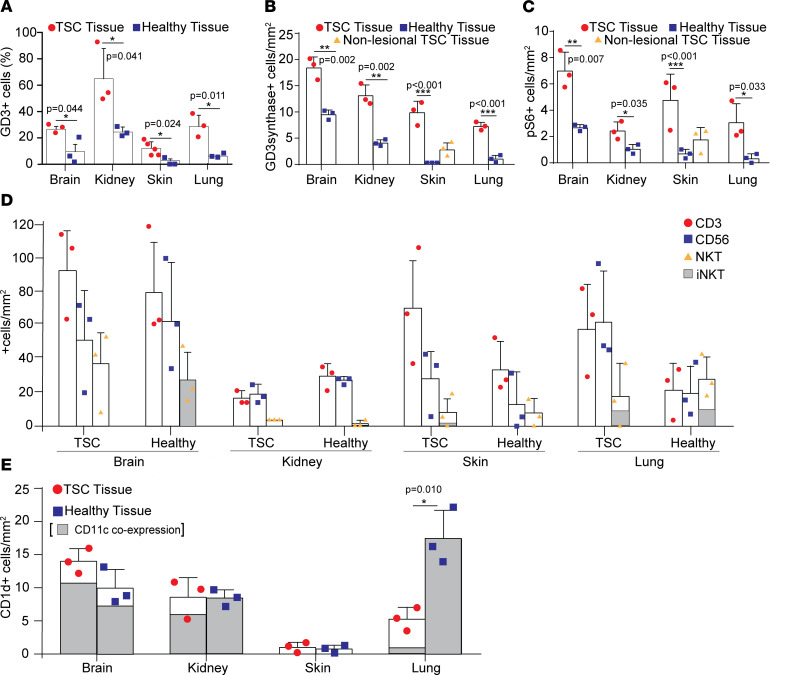
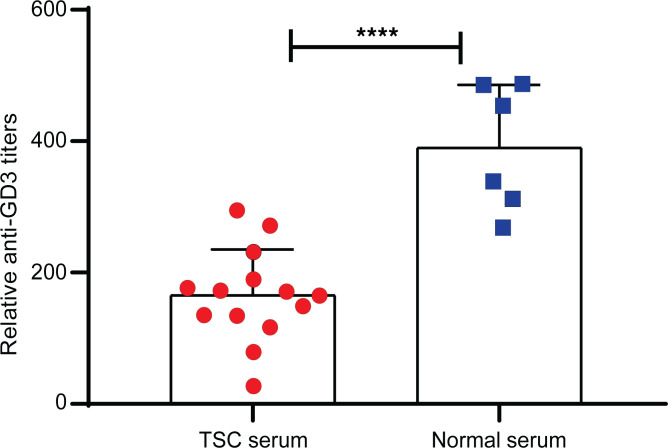
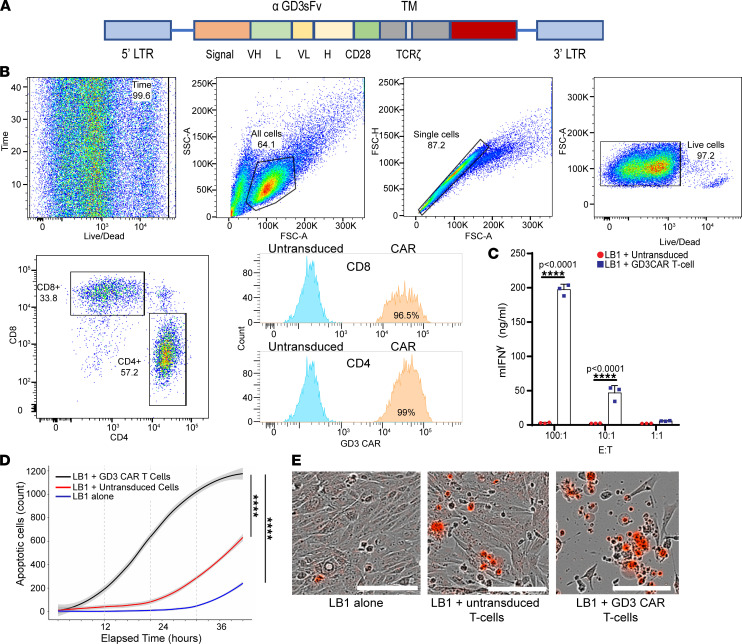
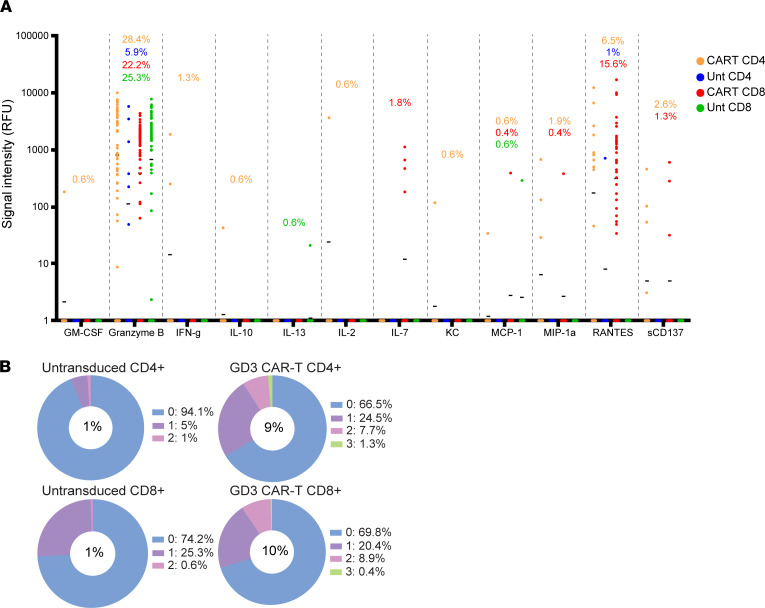
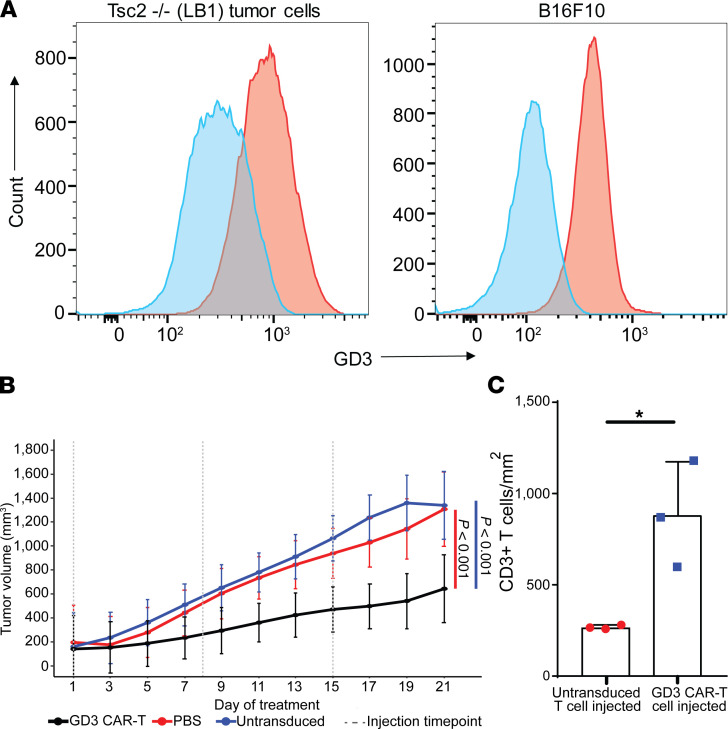
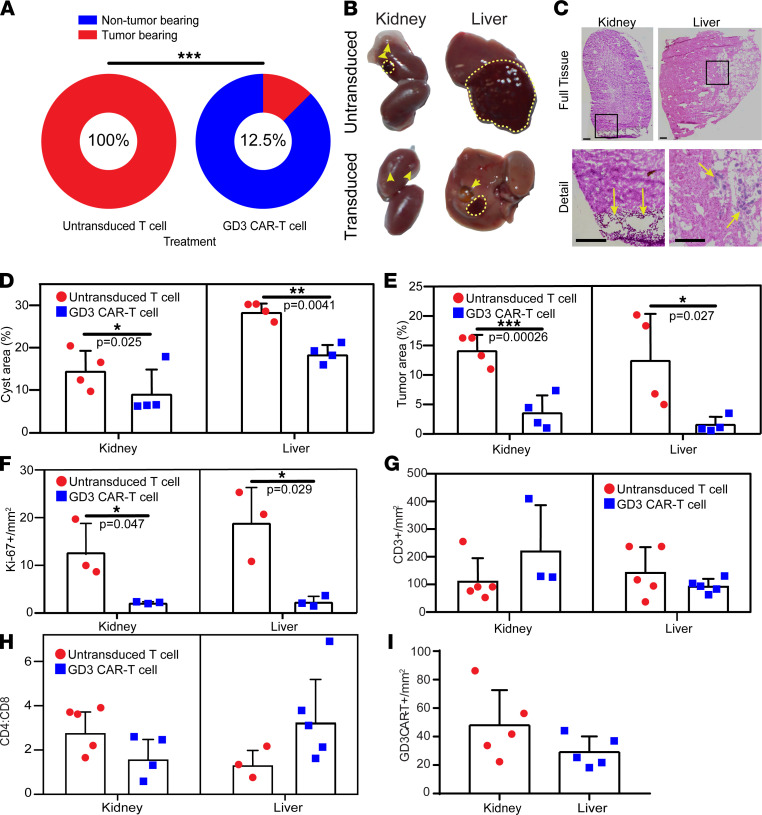
Mutations underlying disease in tuberous sclerosis complex (TSC) give rise to tumors with biallelic mutations in TSC1 or TSC2 and hyperactive mammalian target of rapamycin complex 1 (mTORC1). Benign tumors might exhibit de novo expression of immunogens, targetable by immunotherapy. As tumors may rely on ganglioside D3 (GD3) expression for mTORC1 activation and growth, we compared GD3 expression in tissues from patients with TSC and controls. GD3 was overexpressed in affected tissues from patients with TSC and also in aging Tsc2+/- mice. As GD3 overexpression was not accompanied by marked natural immune responses to the target molecule, we performed preclinical studies with GD3 chimeric antigen receptor (CAR) T cells. Polyfunctional CAR T cells were cytotoxic toward GD3-overexpressing targets. In mice challenged with Tsc2-/- tumor cells, CAR T cells substantially and durably reduced the tumor burden, correlating with increased T cell infiltration. We also treated aged Tsc2+/- heterozygous (>60 weeks) mice that carry spontaneous Tsc2-/- tumors with GD3 CAR or untransduced T cells and evaluated them at endpoint. Following CAR T cell treatment, the majority of mice were tumor free while all control animals carried tumors. The outcomes demonstrate a strong treatment effect and suggest that targeting GD3 can be successful in TSC.

Keywords: Antigen; Immunology; Immunotherapy; T cells; Therapeutics.


Conflict of interest statement

Conflict of interest: The authors have declared that no conflict of interest exists.

Figures

Figure 1
Figure 1. GD3 is overexpressed in human TSC lesions, and GD3 overexpression fails to raise cellular immune responses to the antigen in human TSC tissues.
(A) Percentage of GD3-expressing cells quantified (%). (B) GD3 expression quantified as GD3 synthase–positive cells per area. (C) Quantification of TSC lesional cells as phospho-S6+ cells per area. (D) Quantification of T cells and NK cells shown as CD3+ and CD56+; NKT cells are evaluated as CD3/CD56 double-positive cells in kidney tissue (enlarged representation) with iNKT cells quantified as CD3+ and CD56+, TCR Vα24-Jα18+ cells. (E) Quantification of CD1d- and CD1d-CD11c–expressing cells per area. Statistical analysis was performed using 2-tailed Student’s t tests assuming equal variance among groups. Where 3 tissue sources were displayed, we performed a 1-way ANOVA (***P < 0.001) followed by Holm-Šídák multiple comparisons test to compare TSC-affected tissues with controls. In all quantifications, n = 3; *P < 0.05, **P < 0.01, ***P < 0.001. Graphs show individual values and mean values ± SD.
Figure 2
Figure 2. TSC patients exhibit reduced anti-GD3 titers compared with controls.
Antibody titers were quantified in serum samples from 14 patients with TSC and compared with 6 healthy controls as measured by ELISA and compared by a 2-tailed Student’s t test assuming equal variance, n = 14. ****P < 0.0001.
Figure 3
Figure 3. GD3 CAR T cells respond to antigen in vitro.
(A) Schematic representation of the GD3 CAR construct used. Fv, variable domain of antibody; TM, transmembrane domain; LTR, long terminal repeat. (B) Efficient transduction of both CD4+ and CD8+ T cells by our second-generation GD3 CAR. (C) IFN-γ secretion by GD3 CAR T cells in response to LB1 Tsc2/ mouse kidney tumor cells. This experiment was performed 3 times with similar results. A representative experiment is shown. Results were analyzed by 2-way ANOVA followed by Bonferroni’s multiple comparisons test. m, murine; E:T, effector/target ratio. (D) Cytotoxicity of GD3 CAR T cells toward LB1 Tsc2–/– mouse kidney tumor cells when cocultured at an E:T ratio of 10:1. A generalized linear mixed model with log link and 0-inflated quasi-Poisson distribution assumption was used and included fixed effects for treatment group and a random effect for wells. Three images/well were acquired every 3 hours for 48 hours, and apoptotic cells stained by caspase-7 red dye were quantified. ****P < 0.0001. (E) Representative images of target cell death (red) induced by GD3 CAR T cells and untransduced T cells, scale bar: 400 μm.
Figure 4
Figure 4. Polyfunctional responses in CD4+ and CD8+ CAR T cells in response to antigen.
CD4 and CD8 subsets of untransduced or GD3 CAR transduced T cells were magnetically separated and individually cocultured 2:1 with GD3-expressing HEK293 cells for 20 hours before loading onto IsoCode chips. (A) Wells containing single live cells were analyzed by IsoSpeak data visualization software, and detection of individual analytes is represented by signal intensity per cell. Horizontal bars denote the mean for each analyte. (B) The percentages of single T cells secreting the indicated number of cytokines are shown in pie charts, with the percentage of polyfunctional T cells (expressing 2 or more cytokines) listed in the center of the pie.
Figure 5
Figure 5. GD3 CAR T cells target Tsc2–/– tumors in immunodeficient SCID/Bg mice.
(A) Surface GD3 expression by LB1 Tsc2/ kidney tumor cells used for subcutaneous tumor injections, and B16-F10 mouse melanoma cells for comparison with a shift of 545 in MFI for LB1 and a shift of 298 for B16-F10, representing a 2.7- and 3.6-fold increase in fluorescence over background for LB1 cells and B16 cells, respectively. (B) Tumor volumes in the treatment groups over time. Figure shows data from a representative experiment of 2 performed. Each group had 6 animals, and tumor volumes were documented every other day for 22 days after the first T cell treatment. Statistical analysis was carried out using R software, and splines were fit using the splines2 package. Two-sided P values are provided using a Bonferroni correction, with P values of P = 3.3 × 10⁻⁶ for the comparison of CAR T cells with PBS and P = 3.2 × 10⁻¹⁵ for the comparison of GD3 CAR T cells with the untransduced T cell group. (C) Quantification of CD3+ T cells infiltrating subcutaneous tumors after adoptive T cell transfer in SCID/Bg mice that received untransduced or GD3 CAR T cells, n = 3. *P = 0.022. A 2-tailed Student’s t test assuming equal variance was used to compare groups. Bar graphs show mean values ± SD.
Figure 6
Figure 6. GD3 CAR T cells effectively treat spontaneous tumors arising in Tsc2+/– mice.
(A) Tumor-bearing Tsc2+/ mice quantified 2 weeks after initial adoptive transfer of >60-week-old mice, n = 10 and 8 for CAR T and untransduced T cell recipients, respectively. The presence of visible tumors was evaluated in major organs, and mice were scored as tumor positive or negative. A 2-sided Fisher’s exact test for count data was used to compare the treatment groups at n = 10 and n = 8 for the control and treatment groups, respectively. ***P = 0.0002. (B) Representative images of the liver and kidney tumors of the untransduced T cell recipient and GD3 CAR T cell recipient mice. Dashed lines surround tumors and arrowheads point to cysts. (C) Representative histology images showing cysts in the kidney and tumors in the liver of untransduced T cell recipient mice. Arrows show lesions in cross section (cysts in kidney and tumor cells in liver tissue). (D) Area occupied by cysts or (E) tumors in representative kidney and liver tissues of untransduced and GD3 CAR T cell–injected mice quantified by multiple observers (n = 4). One-tailed paired Student’s t tests were used to compare outcomes for 4 evaluators. (F) Ki-67–expressing cells in kidney and liver tissues quantified by immunostaining (n = 3). One-tailed t tests with unequal variance were used to compare outcomes among both treatment groups within each tissue type. (G) CD3+ T cells in available liver and kidney tissues quantified by immunostaining (n = 3–5). (H) CD4/CD8 ratios in kidney and liver tissues (n = 3–5) and (I) GD3 CAR T cells observed in representative kidney and liver tissues (n = 5) quantified by immunostaining. One-tailed t tests with unequal variance were used to compare outcomes among both treatment groups within each tissue type. *P < 0.05, **P < 0.01, ***P < 0.001. Graphs show individual values, mean values ± SD.

References

    1. Henske EP, et al. Tuberous sclerosis complex. Nat Rev Dis Primers. 2016;2:16035. doi: 10.1038/nrdp.2016.35. - DOI - PubMed
    1. Nguyen QD, et al. The cutaneous manifestations of tuberous sclerosis complex. Am J Med Genet C Semin Med Genet. 2018;178(3):321–325. doi: 10.1002/ajmg.c.31649. - DOI - PubMed
    1. Ridler K, et al. Neuroanatomical correlates of memory deficits in tuberous sclerosis complex. Cereb Cortex. 2007;17(2):261–271. doi: 10.1093/cercor/bhj144. - DOI - PubMed
    1. de Vries PJ, et al. Natural clusters of tuberous sclerosis complex (TSC)-associated neuropsychiatric disorders (TAND): new findings from the TOSCA TAND research project. J Neurodev Disord. 2020;12(1):24. doi: 10.1186/s11689-020-09327-0. - DOI - PMC - PubMed
    1. Mizuguchi M, et al. Brain symptoms of tuberous sclerosis complex: pathogenesis and treatment. Int J Mol Sci. 2021;22(13):6677. doi: 10.3390/ijms22136677. - DOI - PMC - PubMed

Publication types