. 2021 Nov 22;6(22):e125635.
doi: 10.1172/jci.insight.125635.

Role of endothelial cells in pulmonary fibrosis via SREBP2 activation

Affiliations

Role of endothelial cells in pulmonary fibrosis via SREBP2 activation

Marcy Martin et al. JCI Insight. .

Abstract

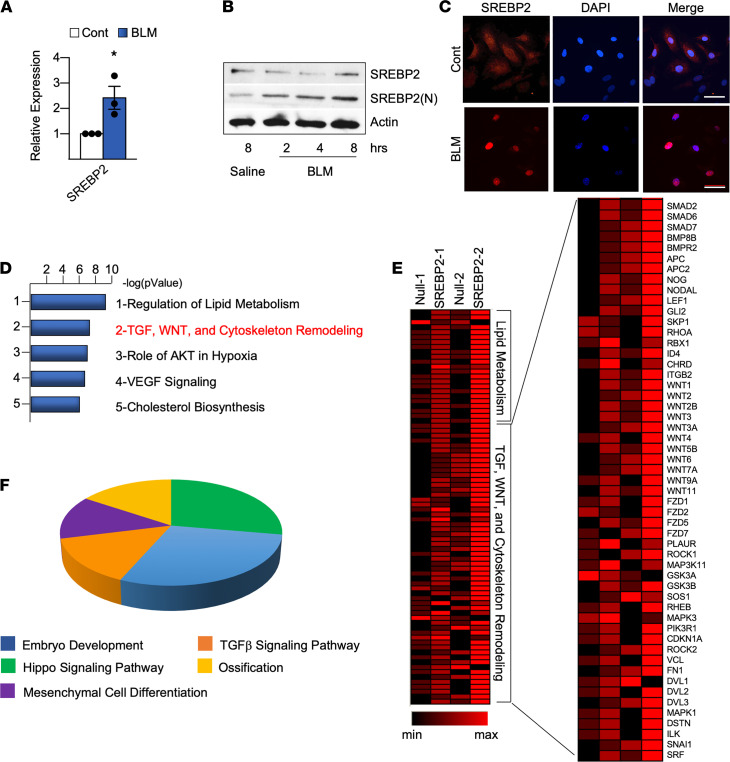
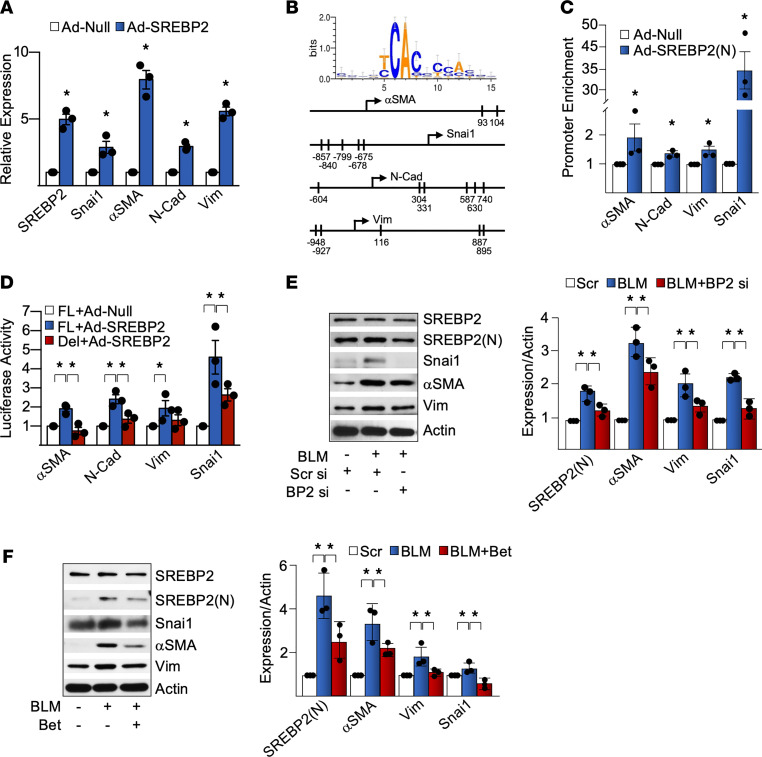
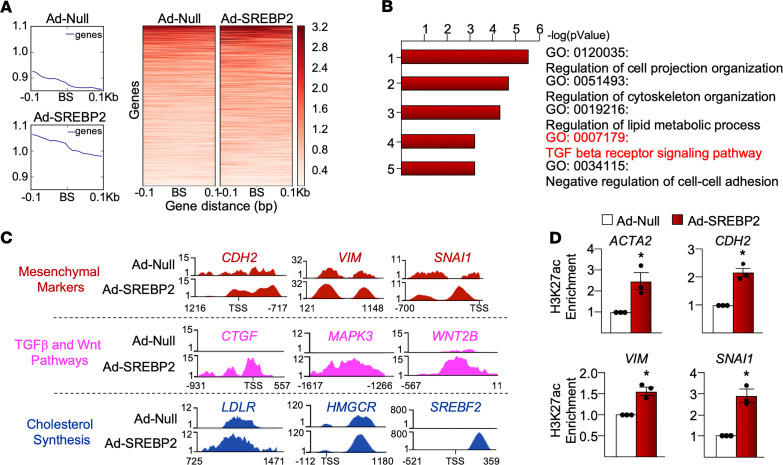
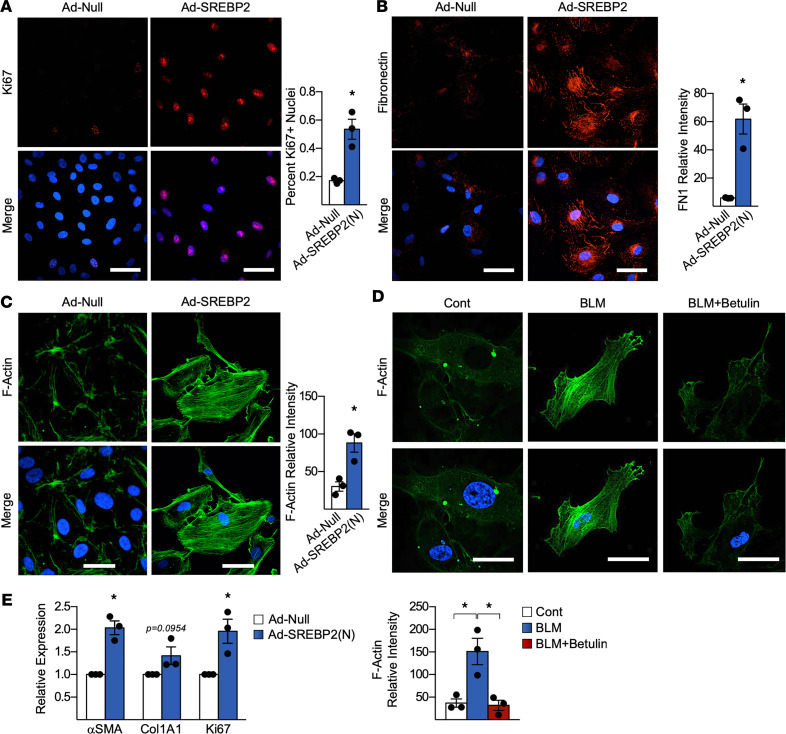
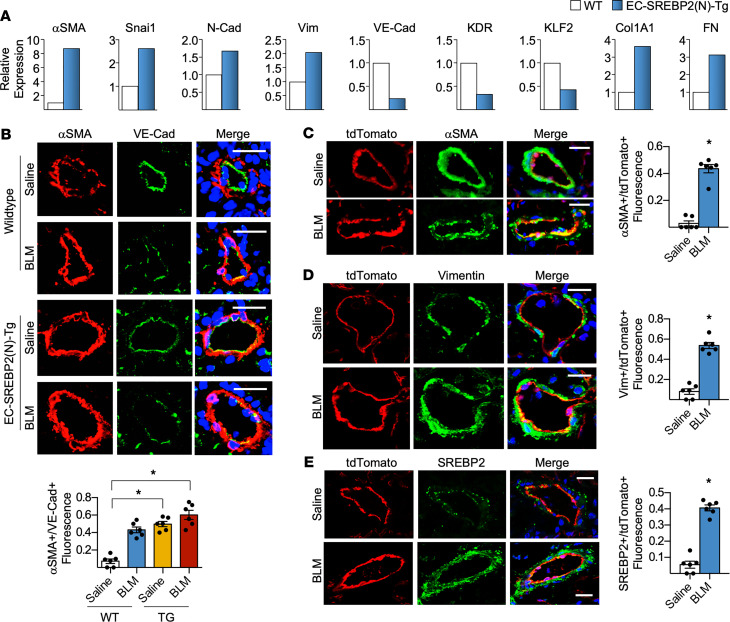
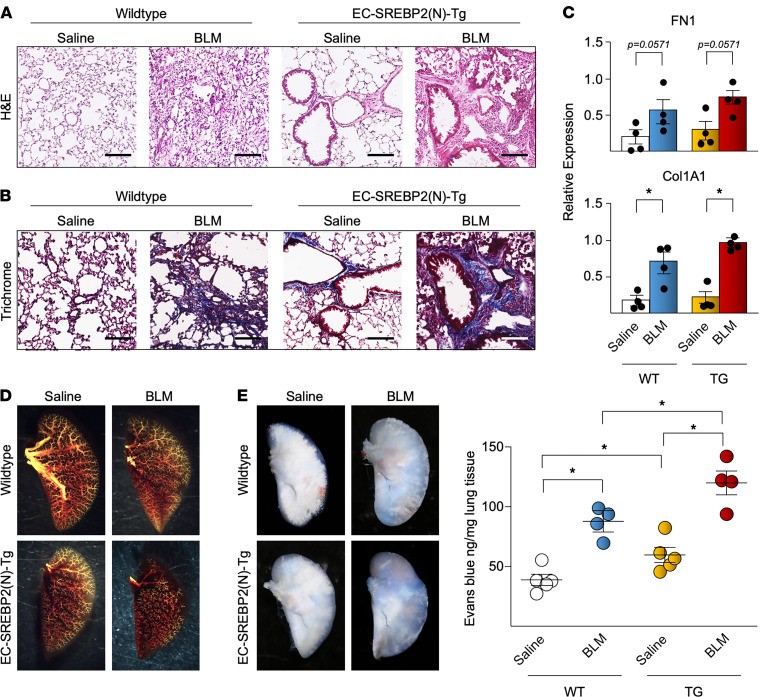
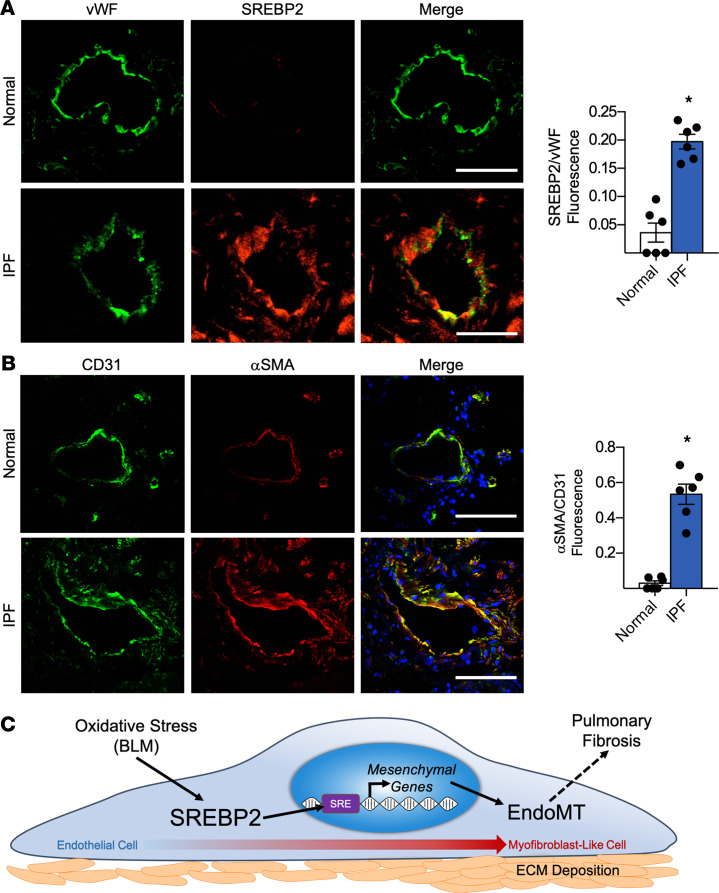
Idiopathic pulmonary fibrosis (IPF) is a progressive lung disease with limited treatment options. Despite endothelial cells (ECs) comprising 30% of the lung cellular composition, the role of EC dysfunction in pulmonary fibrosis (PF) remains unclear. We hypothesize that sterol regulatory element-binding protein 2 (SREBP2) plays a critical role in the pathogenesis of PF via EC phenotypic modifications. Transcriptome data demonstrate that SREBP2 overexpression in ECs led to the induction of the TGF, Wnt, and cytoskeleton remodeling gene ontology pathways and the increased expression of mesenchymal genes, such as snail family transcriptional repressor 1 (snai1), α-smooth muscle actin, vimentin, and neural cadherin. Furthermore, SREBP2 directly bound to the promoter regions and transactivated these mesenchymal genes. This transcriptomic change was associated with an epigenetic and phenotypic switch in ECs, leading to increased proliferation, stress fiber formation, and ECM deposition. Mice with endothelial-specific transgenic overexpression of SREBP2 (EC-SREBP2[N]-Tg mice) that were administered bleomycin to induce PF demonstrated exacerbated vascular remodeling and increased mesenchymal transition in the lung. SREBP2 was also found to be markedly increased in lung specimens from patients with IPF. These results suggest that SREBP2, induced by lung injury, can exacerbate PF in rodent models and in human patients with IPF.

Keywords: Endothelial cells; Fibrosis; Pulmonology; Vascular Biology.


Conflict of interest statement

Conflict of interest: The authors have declared that no conflict of interest exists.

Figures

Figure 1
Figure 1. Bleomycin-induced (BLM-induced) SREBP2(N) mediates profibrotic pathways in ECs.
(AC) HUVECs were stimulated with BLM (1 mU). (A) Following 72 hours of BLM treatment, mRNA was measured using qPCR. (B) N-terminal cleavage of SREBP2 was measured using Western blot. (C) Representative image of nuclear localization was determined with immunofluorescence using anti-SREBP2 (red) and DAPI (blue) (n = 3). Scale bar: 50 μm. (DF) HUVECs were infected with Ad-SREBP2(N) or Ad-null (empty vector) for 72 hours (n = 2). Total RNA was isolated and analyzed by RNA-Seq. (D) Gene ontology (GO) analysis was performed for the top 500 upregulated genes in ECs overexpressing SREBP2(N). (E) Heatmap indicates the upregulated genes of n = 2 data sets in the TGF, WNT, Cytoskeleton Remodeling pathways. (F) PANTHER analysis of the genes listed in E. Data in A were analyzed by 2-tailed Student’s t test, and data are represented as mean ± SEM from 3 independent experiments (n = 3). *P < 0.05 between the indicated groups. WNT, wingless related integration site.
Figure 2
Figure 2. SREBP2 transactivates mesenchymal genes.
(A) HUVECs were infected with Ad-SREBP2(N) or empty vector (Ad-null). The levels of mRNA of the indicated genes were measured by qPCR. (B) Depiction of the predicted sterol regulatory elements (SREs) in the promoter regions of snail family transcriptional repressor 1 (snai1), α-smooth muscle actin (αSMA), N-Cadherin (N-Cad), and vimentin (Vim). (C and D) HUVECs were infected with Ad-SREBP2(N) or empty vector (Ad-Null). (C) Chromatin immunoprecipitation (ChIP) assays were performed on the promoter region of SNAI1 (encoding snai1), ACTA2 (encoding αSMA), CDH2 (encoding N-Cad), and VIM (encoding Vim). (D) Luciferase activity was measured and normalized to that of Renilla. FL, full length promoter; Del, SRE site deletion. (E) HUVECs were transfected with SREBP2 or scrambled control siRNA (20 nM) for 16 hours prior to stimulation with bleomycin (BLM) for an additional 48 hours. (F) HUVECs were pretreated with betulin (Bet) (6 μg/mL) for 2 hours, followed by BLM treatment for an additional 72 hours. The expression of the indicated proteins was measured by Western blot. Data in A and C were analyzed by 2-tailed Student’s t test; data are represented as mean ± SEM from 3 independent experiments (n = 3). Data in DF were analyzed by 1-way ANOVA with Bonferroni post hoc; data are represented as mean ± SEM from 3 independent experiments (n = 3). *P < 0.05 between the indicated groups.
Figure 3
Figure 3. ATAC-Seq reveals SREBP2 modulation of the chromatin accessibility.
HUVECs were infected with Ad-SREBP2(N) or empty vector (Ad-Null) followed by ATAC-Seq (n = 2). (A) ATAC peaks were merged into a union set. SREBP2 putative binding sites within the ATAC peaks were predicted. The upper and lower panels show overall and per-loci ATAC signals at ± 0.1 kb flanking the putative SREBP2 binding sites (BS), respectively. (B) Genes specific to mesenchymal markers and TGF-β/Wnt pathways indicate chromatin decondensation upon SREBP2(N) overexpression by using WashU Epigenome Browser. Cholesterol biosynthesis genes were used as a positive control. (C) Gene ontology (GO) analysis reveals top activated pathways with SREBP2(N) transactivation. (D) H3K27ac ChIP-qPCR indicates the chromatin remodeling of the mesenchymal genes. Data in D were analyzed by 2-tailed Student’s t test; data are represented as mean ± SEM from 3 independent experiments (n = 3). *P < 0.05 between the indicated groups. ACTA2, α smooth muscle actin; CDH2, neural cadherin; CTGF, connective tissue growth factor; HMGCR, 3-Hydroxy-3-Methylglutaryl-CoA Reductase; LDLR, low density lipoprotein receptor; MAPK3, mitogen activated protein kinase 3; SNAI1, snail family transcriptional repressor 1; TGF, transforming growth factor; VIM, vimentin; Wnt, wingless integration site.
Figure 4
Figure 4. BLM-induced SREBP2 suppresses EC markers.
(A) HUVECs were treated with BLM (1 mU) for 72 hours. (B) HUVECs were infected with Ad-SREBP2(N) or empty vector (Ad-Null) for 72 hours. The mRNA expression levels of VE-Cadherin (VE-Cad), kinase insert domain receptor (KDR), and Krüppel-like factor 2 (KLF2) were measured using qPCR. (C) ATAC-Seq indicates the chromatin state of genes specific to EC markers upon SREBP2(N) overexpression. (D) H3K27ac ChIP-qPCR showing the chromatin state of indicated genes following 72 hours of Ad-SREBP2(N) infection compared with empty vector. (E) HUVECs were treated with the indicated concentration of BLM. DNA methyltransferase 1 (DNMT1) activity was measured using ELISA. (F and G) HUVECs were treated with BLM or infected with Ad-SREBP2(N) or Ad-Null for 72 hours. Isolated DNA was bisulfite converted and subjected to methylation-specific qPCR. Data in A, B, and DG were analyzed by 2-tailed Student’s t test; data are represented as mean ± SEM from 3 independent experiments (n = 3). *P < 0.05 between the indicated groups.
Figure 5
Figure 5. SREBP2 promotes a phenotypic switch in ECs that activated fibroblasts via paracrine effects.
(AC) Human umbilical vein ECs (HUVECs) infected with Ad-SREBP2(N) or empty vector (Ad-null) were analyzed by immunostaining. Proliferation was assessed using anti-Ki67 (red) (A), ECM deposition was observed using anti-fibronectin (red) (B), and stress fiber formation was examined using F-actin (green) (C). In all experiments, nuclei were counter stained with DAPI (blue). (D) HUVECs were pretreated with betulin for 2 hours, followed by bleomycin (BLM) for 72 hours. Stress fiber formation was assessed using F-actin (green). Nuclei were counter stained with DAPI (blue). Scale bar: 50 μm. (E) Human lung microvascular ECs (HLMECs) were infected with Ad-SREBP2(N) or Ad-Null, and they were then cocultured using a transwell system with human lung fibroblasts for 72 hours. mRNA expression was measured using qPCR. Data in AE were analyzed by 2-tailed Student’s t test; data are represented as mean ± SEM from 3 independent experiments (n = 3). *P < 0.05 between the indicated groups. Col1A1, collagen 1 type 1; FN1, fibronectin 1.
Figure 6
Figure 6. BLM-induced SREBP2 promotes EC phenotypic switch and partial EndoMT in mice.
(A) Lung microvascular ECs were isolated from age-matched EC-SREBP2(N)-Tg mice and compared with their WT littermates (pooled from n = 5 per group). The level of indicated mRNA was measured using qPCR. (BE) Age-matched EC-SREBP2(N)-Tg and WT littermates, or EC-specific tdTomato-expressing mice driven with tamoxifen inducible VE-Cad–Cre (EC-tdTomato mice) were administered BLM (8 units/injection) on days 0, 4, 7, 10, and 14 through i.p. injection. Twenty-eight days after BLM administration, lungs were harvested. (B) Frozen lung sections were immunostained for the EC marker VE-Cad (green) and the mesenchymal marker αSMA (red). Nuclei were counter stained with DAPI (blue). Scale bar: 20 μm. Quantitative analysis showing the number of αSMA+ cells compared with total VE-Cad+ cells in the intima is graphed below the representative images. (CE) Lineage-tracing experiments were performed with EC-specific expression of tdTomato (red), counterstained with αSMA (green) (C), vimentin (green) (D), or SREBP2 (green) (E). Nuclei are labeled with DAPI (blue). Scale bar: 20 μm. Quantitative analysis showing αSMA+, Vim+, or SREBP2+ cells are compared with total tdTomato+ cells in the intima, which is graphed on the right of the representative images. Data in B were analyzed by 2-way ANOVA with Kruskal-Wallis post hoc; data are represented as mean ± SEM from n = 6 mice per group. Data in CE were analyzed by 2-tailed Student’s t test; data are represented as mean ± SEM from n = 6 mice per group. *P < 0.05 between the indicated groups. Col1A1, collagen 1 type 1; FN1, fibronectin 1; KDR, kinase insert domain receptor; KLF2, Krüppel-like factor 2; N-Cad, neural cadherin; Snai1, snail family transcriptional repressor 1; VE-Cad, vascular endothelial cadherin; Vim, vimentin; Wnt, wingless integration site).
Figure 7
Figure 7. SREBP2 promotes EC-induced vascular damage in the mouse lung.
(A and B) Vascular remodeling resulting from bleomycin (BLM) administration and SREBP2(N) overexpression was revealed by representative images of H&E staining from n = 6 mice per group (cells stained in red, nuclei in black) (A) and representative images of Masson’s trichrome from n = 6 mice per group (cells stained in red, collagen in blue) (B). Scale bars: 100 μm. (C) The level of fibronectin (FN1) and collagen (Col1A1) mRNA from whole lung samples were measured using qPCR. (D) Representative images of an angiogram with the use of Microfil to reveal the lung vascularization (yellow) (n = 4 mice per group). (E) Evans blue was injected via tail vein, and mice were then sacrificed 30 minutes later (n = 4 mice per group). Evans blue effusion in the lung is visualized in the representative images and were quantified by spectrophotometry. Data in C were analyzed by 2-tailed Student’s t test; data are represented as mean ± SEM from n = 4 mice per group. Data in E were analyzed by 2-way ANOVA with Kruskal-Wallis post hoc; data are represented as mean ± SEM from n = 4 mice per group. *P < 0.05 between the indicated groups.
Figure 8
Figure 8. SREBP2 and mesenchymal markers are induced in human lung endothelium with idiopathic pulmonary fibrosis (IPF).
(A and B) Human lung tissue samples from patients with IPF were compared with normal lung transplant controls (n = 6 per group). Immunostaining was performed with the endothelial cell marker vWF (green) and SREBP2 (red) (A), or the endothelial cell marker CD31 (green) and mesenchymal marker αSMA (red) (B). In all images, nuclei were counter stained with DAPI (blue). Scale bar: 20 μm. Data in A and B were analyzed by 2-tailed Student’s t test; data are represented as mean ± SEM from n = 6 patient samples per group. *P < 0.05 between the indicated groups. BLM, bleomycin; CD31, PECAM-1; EndoMT, endothelial-to-mesenchymal transition; vWF, von Willebrand factor. (C) The involvement of BLM/SREBP2/EndoMT axis in the lung ECs during the onset of PF.

Similar articles

Cited by

References

    1. Wolters PJ, et al. Pathogenesis of idiopathic pulmonary fibrosis. Annu Rev Pathol. 2014;9:157–179. doi: 10.1146/annurev-pathol-012513-104706. - DOI - PMC - PubMed
    1. Blackwell TS, et al. Future directions in idiopathic pulmonary fibrosis research. An NHLBI workshop report. Am J Respir Crit Care Med. 2014;189(2):214–222. doi: 10.1164/rccm.201306-1141WS. - DOI - PMC - PubMed
    1. Bringardner BD, et al. The role of inflammation in the pathogenesis of idiopathic pulmonary fibrosis. Antioxid Redox Signal. 2008;10(2):287–301. doi: 10.1089/ars.2007.1897. - DOI - PMC - PubMed
    1. Karimi-Shah BA, Chowdhury BA. Forced vital capacity in idiopathic pulmonary fibrosis--FDA review of pirfenidone and nintedanib. N Engl J Med. 2015;372(13):1189–1191. doi: 10.1056/NEJMp1500526. - DOI - PubMed
    1. Juarez MM, et al. Acute exacerbation of idiopathic pulmonary fibrosis-a review of current and novel pharmacotherapies. J Thorac Dis. 2015;7(3):499–519. - PMC - PubMed

Publication types

Substances