Inhibitors of the Hippo Pathway Kinases STK3/MST2 and STK4/MST1 Have Utility for the Treatment of Acute Myeloid Leukemia
- PMID: 34807584
- PMCID: PMC10149138
- DOI: 10.1021/acs.jmedchem.1c00804
Inhibitors of the Hippo Pathway Kinases STK3/MST2 and STK4/MST1 Have Utility for the Treatment of Acute Myeloid Leukemia
Abstract
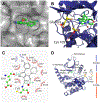
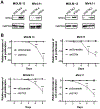
Serine/threonine-protein kinases 3 and 4 (STK3 and STK4, respectively) are key components of the Hippo signaling pathway, which regulates cell proliferation and death and provides a potential therapeutic target for acute myeloid leukemia (AML). Herein, we report the structure-based design of a series of pyrrolopyrimidine derivatives as STK3 and STK4 inhibitors. In an initial screen, the compounds exhibited low nanomolar potency against both STK3 and STK4. Crystallization of compound 6 with STK4 revealed two-point hinge binding in the ATP-binding pocket. Further characterization and analysis demonstrated that compound 20 (SBP-3264) specifically inhibited the Hippo signaling pathway in cultured mammalian cells and possessed favorable pharmacokinetic and pharmacodynamic properties in mice. We show that genetic knockdown and pharmacological inhibition of STK3 and STK4 suppress the proliferation of AML cells in vitro. Thus, SBP-3264 is a valuable chemical probe for understanding the roles of STK3 and STK4 in AML and is a promising candidate for further advancement as a potential therapy.
Figures


Similar articles
-
The Hippo kinases control inflammatory Hippo signaling and restrict bacterial infection in phagocytes.mBio. 2024 May 8;15(5):e0342923. doi: 10.1128/mbio.03429-23. Epub 2024 Apr 16. mBio. 2024. PMID: 38624208 Free PMC article.
-
STK3/STK4 signalling in adipocytes regulates mitophagy and energy expenditure.Nat Metab. 2021 Mar;3(3):428-441. doi: 10.1038/s42255-021-00362-2. Epub 2021 Mar 23. Nat Metab. 2021. PMID: 33758424
-
Non-canonical role of Hippo tumor suppressor serine/threonine kinase 3 STK3 in prostate cancer.Mol Ther. 2022 Jan 5;30(1):485-500. doi: 10.1016/j.ymthe.2021.08.029. Epub 2021 Aug 25. Mol Ther. 2022. PMID: 34450249 Free PMC article.
-
MST Kinases and Metabolism.Endocrinology. 2019 May 1;160(5):1111-1118. doi: 10.1210/en.2018-00898. Endocrinology. 2019. PMID: 30882881 Review.
-
MST kinases in development and disease.J Cell Biol. 2015 Sep 14;210(6):871-82. doi: 10.1083/jcb.201507005. J Cell Biol. 2015. PMID: 26370497 Free PMC article. Review.
Cited by
-
The Hippo signalling pathway and its implications in human health and diseases.Signal Transduct Target Ther. 2022 Nov 8;7(1):376. doi: 10.1038/s41392-022-01191-9. Signal Transduct Target Ther. 2022. PMID: 36347846 Free PMC article. Review.
-
Comprehensive bioinformatics analysis reveals biomarkers of DNA methylation-related genes in varicose veins.Front Genet. 2022 Nov 25;13:1013803. doi: 10.3389/fgene.2022.1013803. eCollection 2022. Front Genet. 2022. PMID: 36506327 Free PMC article.
-
Synthesis of new condensed naphthoquinone, pyran and pyrimidine furancarboxylates.Beilstein J Org Chem. 2025 Feb 12;21:340-347. doi: 10.3762/bjoc.21.24. eCollection 2025. Beilstein J Org Chem. 2025. PMID: 39968289 Free PMC article.
-
Targeting Hippo signaling in cancer: novel perspectives and therapeutic potential.MedComm (2020). 2023 Oct 3;4(5):e375. doi: 10.1002/mco2.375. eCollection 2023 Oct. MedComm (2020). 2023. PMID: 37799806 Free PMC article. Review.
-
Cognitive Skills and DNA Methylation Are Correlating in Healthy and Novice College Students Practicing Preksha Dhyāna Meditation.Brain Sci. 2023 Aug 17;13(8):1214. doi: 10.3390/brainsci13081214. Brain Sci. 2023. PMID: 37626570 Free PMC article.
References
-
- Chan EH; Nousiainen M; Chalamalasetty RB; Schafer A; Nigg EA; Sillje HH, The Ste20-like kinase Mst2 activates the human large tumor suppressor kinase Lats1. Oncogene 2005, 24 (12), 2076–86. - PubMed
-
- Huang J; Wu S; Barrera J; Matthews K; Pan D, The Hippo signaling pathway coordinately regulates cell proliferation and apoptosis by inactivating Yorkie, the Drosophila Homolog of YAP. Cell 2005, 122 (3), 421–34. - PubMed
Publication types
MeSH terms
Substances
Grants and funding
LinkOut - more resources
Full Text Sources
Other Literature Sources
Chemical Information
Medical
Molecular Biology Databases
Research Materials
Miscellaneous

