. 2021 Nov 22;16(11):e0260267.
doi: 10.1371/journal.pone.0260267. eCollection 2021.

Validating a model of architectural hazard visibility with low-vision observers

Affiliations

Validating a model of architectural hazard visibility with low-vision observers

Siyun Liu et al. PLoS One. .

Abstract

Pedestrians with low vision are at risk of injury when hazards, such as steps and posts, have low visibility. This study aims at validating the software implementation of a computational model that estimates hazard visibility. The model takes as input a photorealistic 3D rendering of an architectural space, and the acuity and contrast sensitivity of a low-vision observer, and outputs estimates of the visibility of hazards in the space. Our experiments explored whether the model could predict the likelihood of observers correctly identifying hazards. In Experiment 1, we tested fourteen normally sighted subjects with blur goggles that simulated moderate or severe acuity reduction. In Experiment 2, we tested ten low-vision subjects with moderate to severe acuity reduction. Subjects viewed computer-generated images of a walkway containing five possible targets ahead-big step-up, big step-down, small step-up, small step-down, or a flat continuation. Each subject saw these stimuli with variations of lighting and viewpoint in 250 trials and indicated which of the five targets was present. The model generated a score on each trial that estimated the visibility of the target. If the model is valid, the scores should be predictive of how accurately the subjects identified the targets. We used logistic regression to examine the correlation between the scores and the participants' responses. For twelve of the fourteen normally sighted subjects with artificial acuity reduction and all ten low-vision subjects, there was a significant relationship between the scores and the participant's probability of correct identification. These experiments provide evidence for the validity of a computational model that predicts the visibility of architectural hazards. It lays the foundation for future validation of this hazard evaluation tool, which may be useful for architects to assess the visibility of hazards in their designs, thereby enhancing the accessibility of spaces for people with low vision.


Conflict of interest statement

The authors have declared that no competing interests exist.

Figures

Fig 1
Fig 1. Workflow of the DeVAS software.
A: the original image of a step rendered by Radiance software. B: image filtered to simulate Severe low vision (VA 1.55 logMAR, CS 0.6 Pelli-Robson). C: luminance boundaries extracted from the filtered image. D: Pixels representing Geometric edges inferred from 3D data map of the space. E: Estimation of hazard visibility, based on a match between the luminance contours in C and the geometrical edges in D. Color coding represents the closeness of the match, ranging from red (poor match) to green (good match). F: A manually defined Region of Interest (ROI), G: The conjunction of E and F which specifies the hazard region of primary focus, which is used to generate the final Hazard Visibility Score (HVS).
Fig 2
Fig 2. Geometry, lighting, and viewpoint variation of stimuli.
The top row used the lighting setting “spotlight 1” and viewpoint setting “center” to demonstrate the five target types: flat, big step-up big step-down, small step-up, and small step-down. The middle row used big step-down and center viewpoint to show the five lighting variations: overhead, far panel, near panel, spotlight 1, and spotlight 2. The bottom row used big step-down and spotlight 1 to show the five viewpoints: center, pivot left, pivot right, rotate down, and rotate up.
Fig 3
Fig 3. Distribution of trials in ten HVS bins, each covering 0.1 width in a zero to one range.
The upper panel shows the trial distribution for Moderate blur (1.2 logMAR) and the lower panel shows the distribution for Severe blur (1.6 logMAR).
Fig 4
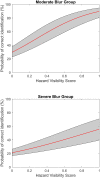
Fig 4. Logistic regression model of aggregated data from subjects viewing with artificial blur.
Top: Moderate Blur (seven subjects), mean acuity 1.2 logMAR. Bottom: Severe Blur (seven subjects), mean acuity 1.6 logMAR. The red line shows the logistic regression function, transformed as shown in Eq 2. the gray area represents 95% confidence intervals.
Fig 5
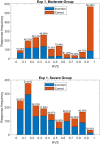
Fig 5. Histograms presenting correct and incorrect trials in each 0.1-wide bin of the HVS accumulated across seven subjects in each blur group.
The upper panel shows the distribution for moderate blur group trials, and the lower panel shows the distribution of severe blur group trials.
Fig 6
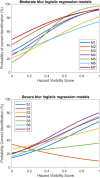
Fig 6. Logistic regression models of 14 subjects with artificial acuity reduction by blur.
Top: Moderate Blur Group. Bottom: Severe Blur Group.
Fig 7
Fig 7. Logistic regression model of aggregated data from low-vision subjects.
The red line shows the regression curve and the gray area outlines the upper and lower bounds of the 95% confidence interval of the slope and intercept.
Fig 8
Fig 8. Logistic regression models of 10 low-vision subjects.
Fig 9
Fig 9. A scatterplot of logistic regression slope values of individual subjects and their visual acuities (upper panel) and contrast sensitivities (lower panel).
Linear regression trend lines are also plotted.
Fig 10
Fig 10. ROI’s influence on visibility estimation.
A small downward step is shown in original resolution with three different definitions of ROI. From left to right, the first panel visualizes the visibility of the step with VA equivalent to 1.15 logMAR and CS 0.85 Pelli-Robson. Within this step, the left and right corners (green part) have high visibility, whereas the central horizontal edge (red part) has low visibility. The ROI can be defined as the side corners (second panel), or the central horizontal edge (third panel), or the whole step (fourth panel). The HVS derived from the corners ROI is 0.889, central ROI 0.051, while the ROI based on the entire step had HVS of 0.106. The definition of ROI will often lead to a significant change in HVS.

References

    1. Legge GE, Yu D, Kallie CS, Bochsler TM, Gage R. Visual accessibility of ramps and steps. Journal of Vision. 2010;10(11):8. doi: 10.1167/10.11.8 - DOI - PMC - PubMed
    1. Chan T, Friedman DS, Bradley C, Massof R. Estimates of incidence and prevalence of visual impairment, low vision, and blindness in the United States. JAMA Ophthalmology. 2018. Jan 1;136(1):12–19. doi: 10.1001/jamaophthalmol.2017.4655 - DOI - PMC - PubMed
    1. Ackland P, Resnikoff S, Bourne R. World Blindness and Visual Impairment: Despite Many Successes, the Problem Is Growing. Community Eye Health. 2017;30(100):71–73. - PMC - PubMed
    1. Kersten D, Shakespeare R, Thompson W. Predicting Visibility in Designs of Public Spaces.University of Utah Technical Report UUCS-13-001. 2013; https://www.cs.utah.edu/docs/techreports/2013/pdf/UUCS-13-001.pdf.
    1. Thompson WB, Shakespeare RA, Liu S, Creem-Regehr SH, Kersten DJ, Legge GE. Evaluating visual accessibility for low vision—A Quantitative approach. LEUKOS. 2021. April. 10.1080/15502724.2021.1890115. - DOI - PMC - PubMed

Publication types