. 2021 Nov 22;17(11):e1010084.
doi: 10.1371/journal.ppat.1010084. eCollection 2021 Nov.

The architecture of the simian varicella virus transcriptome

Affiliations

The architecture of the simian varicella virus transcriptome

Shirley E Braspenning et al. PLoS Pathog. .

Abstract

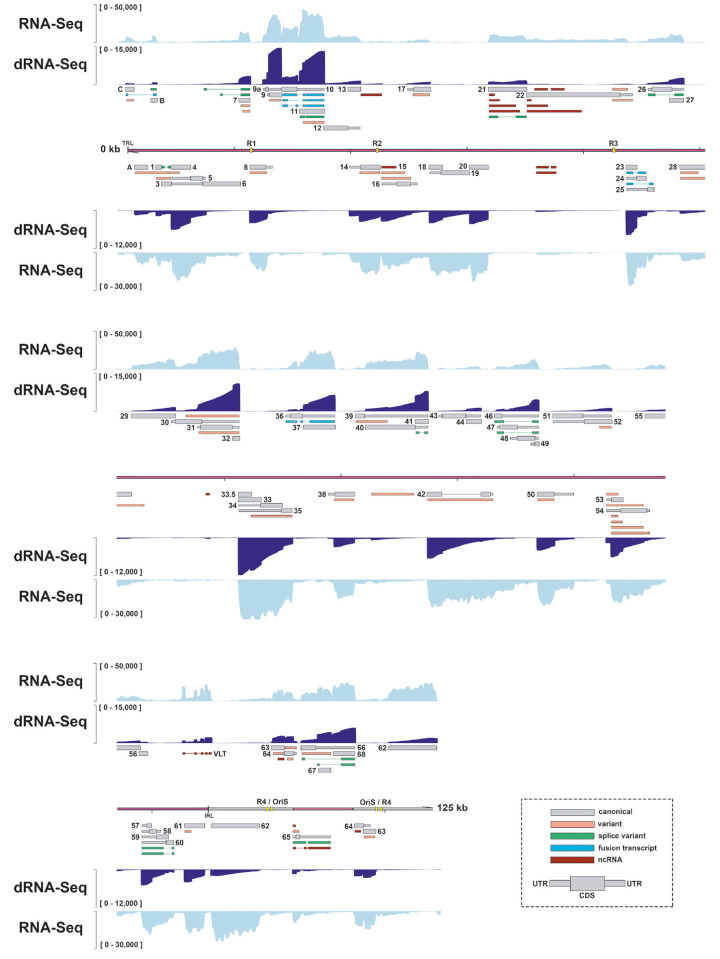
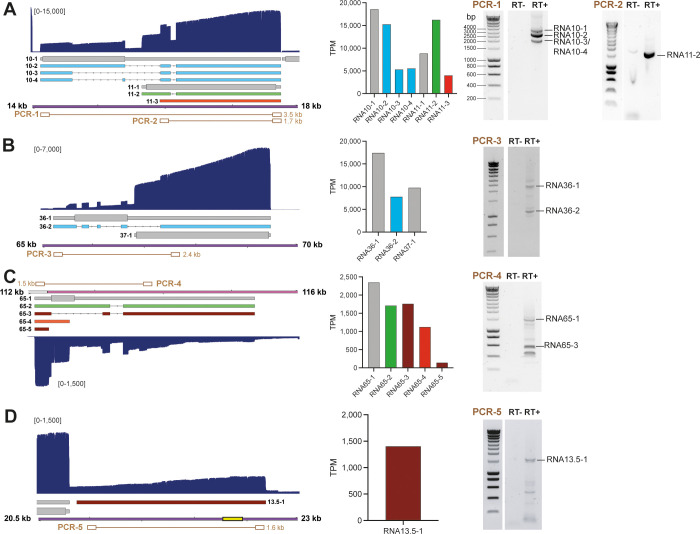
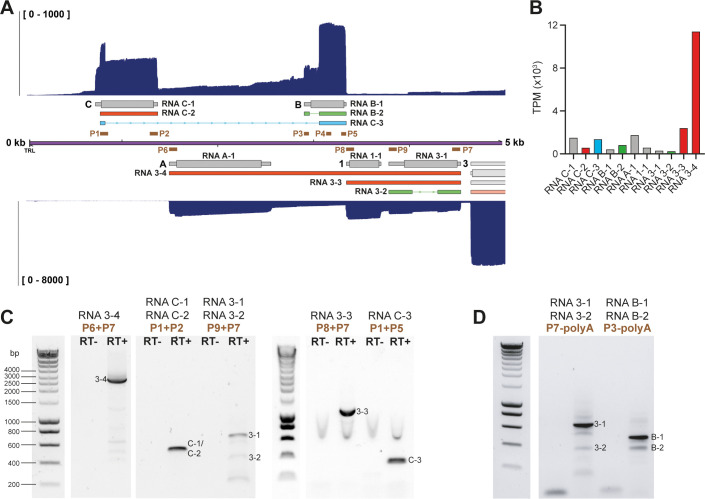
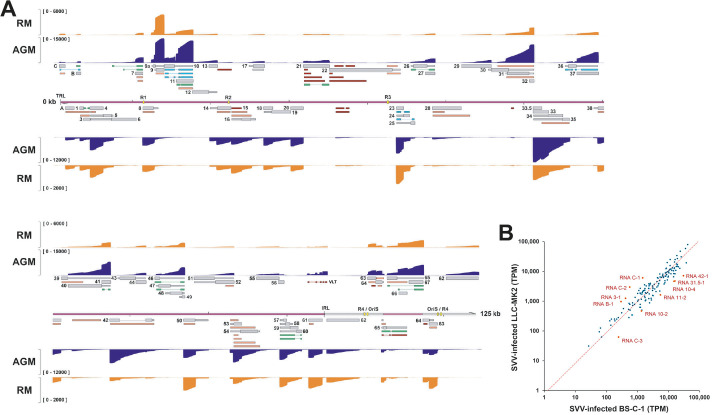
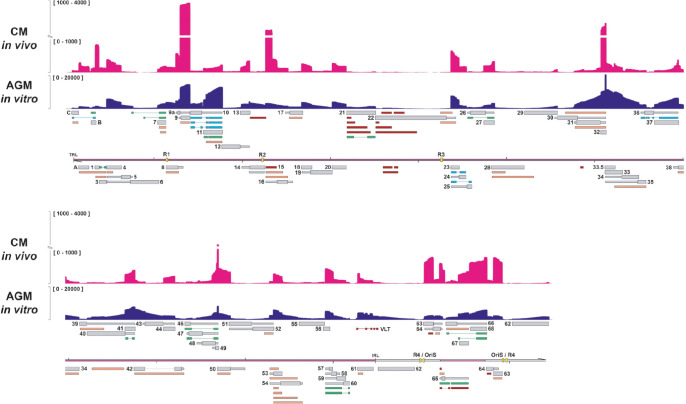
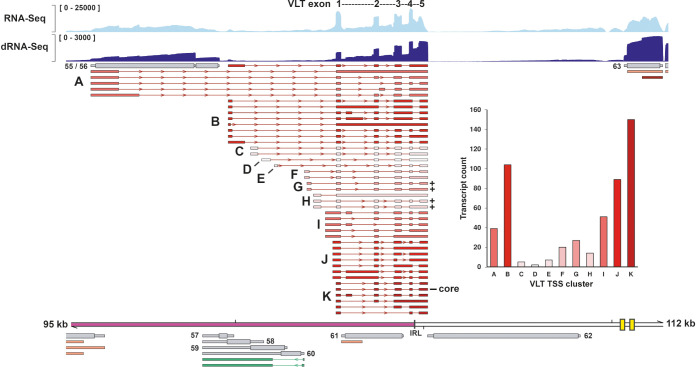
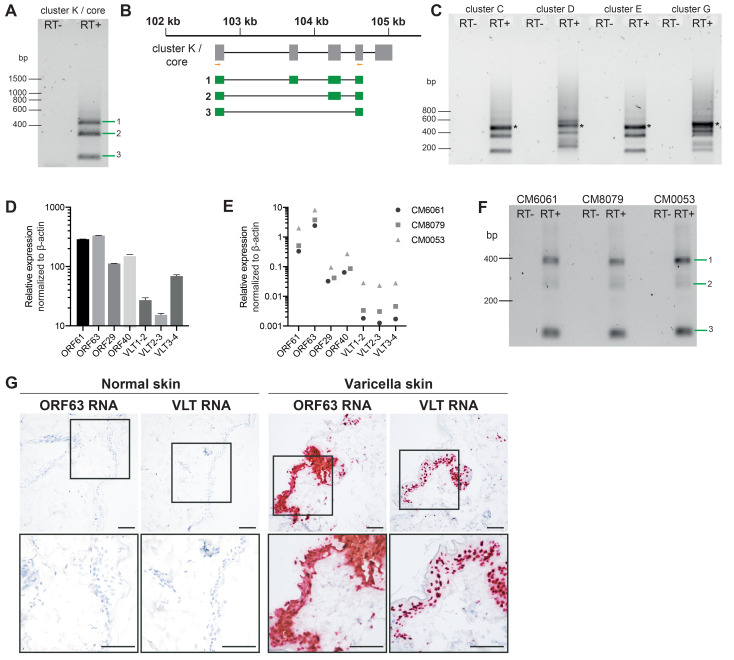
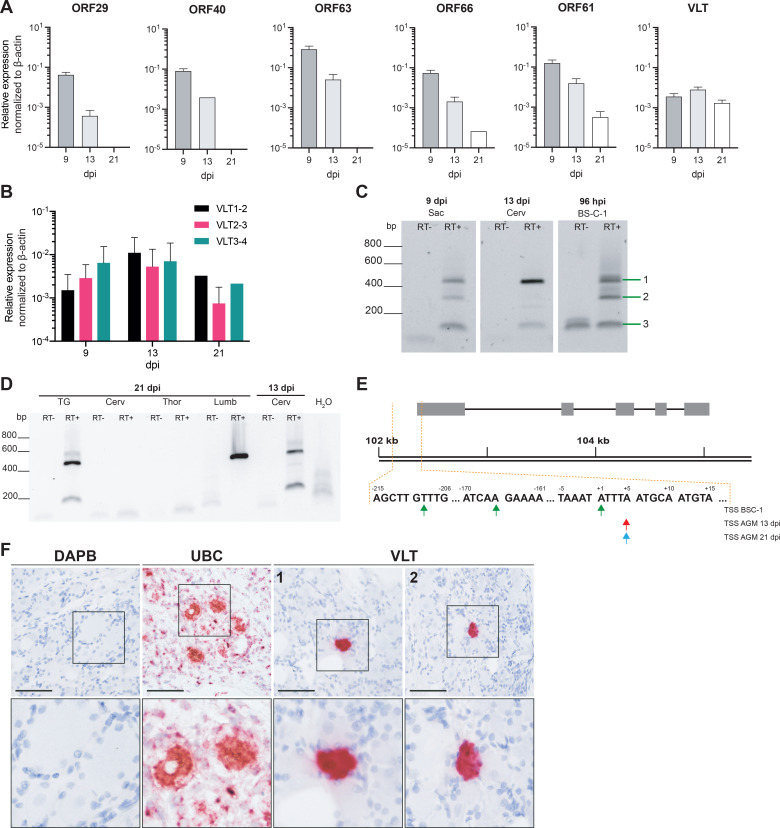
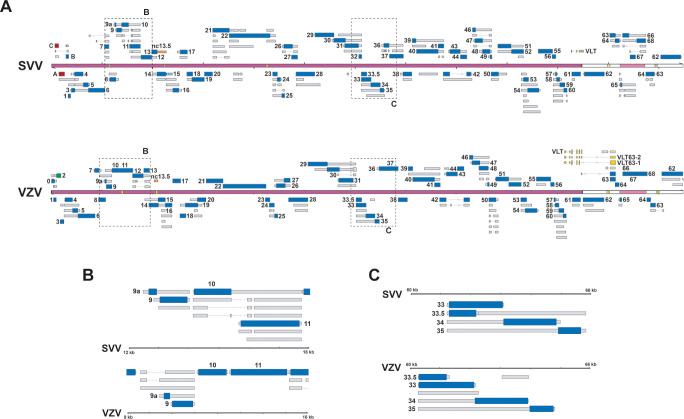
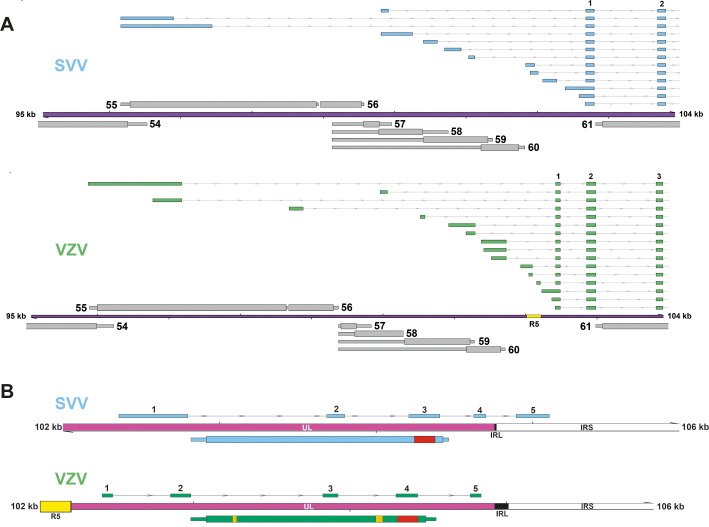
Primary infection with varicella-zoster virus (VZV) causes varicella and the establishment of lifelong latency in sensory ganglion neurons. In one-third of infected individuals VZV reactivates from latency to cause herpes zoster, often complicated by difficult-to-treat chronic pain. Experimental infection of non-human primates with simian varicella virus (SVV) recapitulates most features of human VZV disease, thereby providing the opportunity to study the pathogenesis of varicella and herpes zoster in vivo. However, compared to VZV, the transcriptome and the full coding potential of SVV remains incompletely understood. Here, we performed nanopore direct RNA sequencing to annotate the SVV transcriptome in lytically SVV-infected African green monkey (AGM) and rhesus macaque (RM) kidney epithelial cells. We refined structures of canonical SVV transcripts and uncovered numerous RNA isoforms, splicing events, fusion transcripts and non-coding RNAs, mostly unique to SVV. We verified the expression of canonical and newly identified SVV transcripts in vivo, using lung samples from acutely SVV-infected cynomolgus macaques. Expression of selected transcript isoforms, including those located in the unique left-end of the SVV genome, was confirmed by reverse transcription PCR. Finally, we performed detailed characterization of the SVV homologue of the VZV latency-associated transcript (VLT), located antisense to ORF61. Analogous to VZV VLT, SVV VLT is multiply spliced and numerous isoforms are generated using alternative transcription start sites and extensive splicing. Conversely, low level expression of a single spliced SVV VLT isoform defines in vivo latency. Notably, the genomic location of VLT core exons is highly conserved between SVV and VZV. This work thus highlights the complexity of lytic SVV gene expression and provides new insights into the molecular biology underlying lytic and latent SVV infection. The identification of the SVV VLT homolog further underlines the value of the SVV non-human primate model to develop new strategies for prevention of herpes zoster.


Conflict of interest statement

The authors have declared that no competing interests exist.

Figures

Fig 1
Fig 1. Reannotation of the lytic SVV transcriptome in BS-C-1 cells.
The reannotated lytic SVV transcriptome consists of 150 RNAs, 73 of which encode canonical ORFs with UTRs (thin box) and CDS (wide box) indicated in grey, 34 variants RNAs (orange), 15 splice variants (green), 7 fusion transcripts (blue) and 21 putative non-coding RNAs (red). Shown are Illumina RNA-seq (light blue) and nanopore dRNA-seq (dark blue) coverage plots of BS-C-1 cells lytically infected with SVV strain Delta for 96 hours. Maximum read depth per track is given on the Y-axis. Double black lines represent the SVV genome, with the long unique region (UL) in purple fill, short unique region (US) in pink and internal/terminal repeat sequences (IRS/TRS) no fill, ticks indicate 10 kb intervals and the reiterative repeat regions R1 to R4 and both copies of OriS are indicated as yellow boxes on the genome track.
Fig 2
Fig 2. Confirmation of selected novel SVV transcripts by RT-PCR.
(A-D) Examples of a polycistronic transcription units encoding canonical transcripts, novel splice variants and fusion transcripts within the RNA10 and RNA11 locus (A) and RNA36 and RNA 37 (B), canonical, spliced and variant isoforms and putative ncRNAs in the RNA65 locus (C) and newly identified putative ncRNA13.5–1 (D). The structure, location and relative expression levels of novel SVV transcripts are shown, together with agarose gel images of RT-PCRs that confirm their expression. Left panels: Nanopore dRNA-seq coverage plots with annotated SVV transcripts of lytically infected BS-C-1 cells. Canonical with CDS (wide box) and UTR (thin box) in (grey), variant (orange), splice variant (green), fusion transcripts (blue) and non-coding (red) RNAs are indicated. Double black lines represent the SVV genome, with UL in purple fill, US in pink and IRS/TRS no fill, ticks indicate 1 kb intervals and the reiterative repeat regions R1 to R4 and both copies of OriS are indicated as yellow boxes on the genome track. Middle panels: bar graphs indicating transcripts per million (TPM) counts for each transcript isoform. Right panels: RT-PCR was performed on RNA extracted from lytically SVV-infected BS-C-1 cells at 96 hpi. RT+/RT-: reverse transcriptase added or omitted during cDNA synthesis. PCR numbers correspond to primer pairs indicated in brown in Figure A-D and in S5 Table. When multiple bands are observed, sequence confirmed bands are indicated.
Fig 3
Fig 3. Structure of transcripts expressed from the unique left-end of the SVV genome.
(A) Nanopore dRNA-seq coverage plots with annotated SVV transcripts of lytically SVV-infected BS-C-1 cells. Canonical with CDS (wide box) and UTR (thin box) in (grey), variant (orange), splice variant (green), fusion transcripts (blue) and non-coding (red) RNAs are indicated. Double black lines represent the SVV genome, with UL in purple fill, US in pink and IRS/TRS no fill and ticks indicate 1 kb intervals. Primers used for RT-PCR confirmation are indicated as brown boxes. (B) Bar graph indicating transcripts per million (TPM) counts for each transcript isoform. (C-D) RT-PCR on RNA extracted from lytically infected BS-C-1 cells at 96 hpi. When multiple bands are observed, sequence confirmed bands are indicated. RT+/RT-: reverse transcriptase added or omitted in cDNA synthesis. In (D) Strand-specific RT-PCR using a sequence specific forward primer and a poly-A reverse primer. Primer pairs are indicated and sequences are given in S5 Table.
Fig 4
Fig 4. Comparison of the lytic SVV transcriptome in rhesus macaque (RM) derived LLC-MK2 cells and African green monkey (AGM) derived BS-C-1 cells.
(A) Coverage plots showing dRNA-seq data of SVV-infected LLC-MK2 (orange) and BS-C-1 (dark blue) cells, with Y-axis indicating read depth per track. Canonical (grey), variant (orange), splice variant (green), fusion transcripts (blue) and non-coding (red) RNAs are indicated. Double black lines represent the SVV genome, with UL in purple fill, US in pink and IRS/TRS no fill, ticks indicate 10 kb intervals and the reiterative repeat regions R1 to R4 and both copies of OriS are indicated as yellow boxes on the genome track. (B) Scatter plot shows correlation between abundance (TPM) of SVV transcripts in LLC-MK2 cells (y-axis) and BS-C-1 cells (x-axis). RNAs differentially expressed (i.e. mean Log2 ratio (“TPM in BSC-1” / “TPM in LLC-MK2”) ± 2 times SD) between BS-C-1 cells and LLC-MK2 cells are highlighted and annotated in red.
Fig 5
Fig 5. Comparison of the lytic SVV transcriptome in vitro and in vivo.
PCR-cDNA sequencing of RNA obtained from lung tissue of cynomolgous macaques at 3 days post-infection with SVV strain Delta reveals the lytic transcriptome in vivo. Coverage plots showing PCR-cDNA-seq of SVV-infected CM lung tissue in vivo (magenta) and AGM BS-C-1 cells in vitro (dark blue), with Y-axis indicating the unstranded read depth. Canonical (grey), variant (orange), splice variant (green), fusion transcripts (blue) and non-coding (red) RNAs are indicated. Double black lines represent the SVV genome, with UL in purple fill, US in pink and IRS/TRS no fill, ticks indicate 10 kb intervals and the reiterative repeat regions R1 to R4 and both copies of OriS are indicated as yellow boxes on the genome track.
Fig 6
Fig 6. Structure of VLT RNA isoforms expressed during lytic SVV infection of BS-C-1 cells.
VLT isoforms are given are clustered by TSS (A-K). Color gradient indicates relative abundance of transcripts originating from each TSS, and transcript counts are given in the bar graph. Counts only include reads starting within 50 bp from an annotated TSS. Coverage plots show Illumina RNA-seq (light blue) and nanopore dRNA-seq (dark blue) data. Maximum read depth per track is given on the Y-axis. Thick double black lines represent the SVV genome, ticks indicate 10 kb intervals and the reiterative repeat regions R1 to R4 and both copies of OriS are indicated as yellow boxes on the genome track. Plus signs indicate isoforms coding for the longest pVLT homologue and the core VLT is indicated.
Fig 7
Fig 7. Confirmation of SVV VLT expression during lytic infection in vitro and in vivo.
(A) RT-PCR confirmation of the core of SVV VLT indicates 3 major isoforms in BS-C-1 cells. (B) Diagram showing sequence confirmed SVV VLT isoforms. Grey boxes indicate core VLT according to dRNA seq, orange bars primer locations, and green boxes sequences obtained from indicated bands. (C) RT-PCR confirmation of 4 upstream exons represented by cluster C, D, E and G (see Fig 6) in BS-C-1 cells. Most abundant bands (*) were confirmed by sequencing. (D-E) RT-qPCR was performed on RNA extracted from SVV-infected BS-C-1 cells at 96 hpi (n = 2, mean ± SEM) (D) and lung tissue from n = 3 CM at 3 days post-infection (E). (F) RT-PCR and sequencing confirm presence of multiple isoforms during in vivo lytic infection, major bands confirm core exons and isoforms corresponding to B. (G) Detection of VLT and ORF63 RNA (red signal) by in situ hybridization in consecutive sections of normal and varicella skin lesions of an SVV-infected AGM at 9 dpi. Sections were counterstained with hematoxylin. Scale bars indicates 50 μm. Representative images are shown for AGM 269.
Fig 8
Fig 8. Characterization of VLT expression in ganglia during establishment of latency.
(A-B) Detection of lytic SVV RNAs and VLT by qPCR on cDNA obtained from pooled DRG (n = 5 anatomical levels) of SVV-infected AGMs at 9 (n = 2 animals), 13 (n = 2 animals) and 21 (n = 1 animal) days post-infection. Data represent mean ± SEM. (B) Comparison of three VLT exon-spanning primer-probe pairs. (C) RT-PCR showing VLT expression during lytic infection in cell culture (BS-C-1) at 96 hpi, acute sacral (Sac) DRG infection (9 dpi) and transition to latency in cervical ganglia (13 dpi) using primers located in SVV VLT exon 1 and exon 4. Band numbers correspond to isoforms depicted in Fig 7B. (D) Nested RT-PCR on trigeminal ganglia (TG) and DRG (Cerv = cervical, Thor = thoracic, Lumb = lumbar) obtained from SVV-infected AGM at 13 and 21 dpi, respectively. (E) Transcription start sites of VLT in BS-C-1 cells (top row) or AGM ganglia at 13 dpi (middle row) and 21 dpi (bottom row), as determined by 5’RACE. (F) Detection of VLT RNA (red signal) by in situ hybridization in DRG neurons of a SVV-infected rhesus macaques at 21 dpi. Probes directed to bacterial gene DAPB and abundantly expressed ubiquitin C (UBC) were included as negative and positive controls, respectively, and sections were counterstained with hematoxylin. Representative images are shown for RM 2207 (lumbar; DAPB, UBC and VLT image 1) and RM 9021 sacral (VLT image 2). Scale bar indicates 50 μm, magnification 40x (upper), inset: 2.5x digital zoom (lower).
Fig 9
Fig 9. Genome-wide comparison of transcript structures in SVV and VZV.
(A) Alignment of SVV and VZV genomes with their respective annotation of the transcriptome. Canonical ORFs in both viruses are highlighted in blue, with UTRs (thin box, grey) and CDS (wide box), whereas transcript isoforms are given in grey. Unique SVV ORFs are indicated in red, unique VZV ORFs in green, conserved ncRNA 13.5 in orange and VLT in yellow. Double black lines represent the SVV/VZV genome, with the long unique region (UL) in purple fill, short unique region (US) in pink and internal/terminal repeat sequences (IRS/TRS) no fill, and the reiterative repeat regions R1 to R4 and both copies of OriS are indicated as yellow boxes on the genome track. Dashed boxes indicate areas shown as enlargement in (B) and (C). (B) Selected region of RNA9-11 in both viruses where transcript structures differ. (C) Selected region of RNA33-35 in both viruses where transcript structures are similar.
Fig 10
Fig 10. VLT is highly conserved between SVV and VZV.
(A) Comparison of the genomic location of SVV (blue) and VZV (green) most abundantly used upstream VLT exons. (B) Comparison of SVV (blue) and VZV (green) core VLT location and structure with respect to other genomic features, such as the IRL/IRS, and ORF61 on the opposite strand. Red box and yellow boxes indicate sequences encoding the RING and SIM domains of VZV pORF61.

Similar articles

Cited by

References

    1. Gershon AA, Breuer J, Cohen JI, Cohrs RJ, Gershon MD, Gilden D, et al.. Varicella zoster virus infection. Nat Rev Dis Prim. 2015;1: 15016. doi: 10.1038/nrdp.2015.16 - DOI - PMC - PubMed
    1. Johnson RW, Rice ASC. Clinical practice. Postherpetic Neuralgia. Solomon CG, editor. N Engl J Med. 2014;371: 1526–1533. doi: 10.1056/NEJMcp1403062 - DOI - PubMed
    1. Gilden DH, Kleinschmidt-DeMasters BK, LaGuardia JJ, Mahalingam R, Cohrs RJ. Neurologic complications of the reactivation of varicella-zoster virus. N Engl J Med. 2000;342: 635–45. doi: 10.1056/NEJM200003023420906 - DOI - PubMed
    1. Messaoudi I, Barron A, Wellish M, Engelmann F, Legasse A, Planer S, et al.. Simian varicella virus infection of rhesus macaques recapitulates essential features of varicella zoster virus infection in humans. PLoS Pathog. 2009;5: e1000657. doi: 10.1371/journal.ppat.1000657 - DOI - PMC - PubMed
    1. Ouwendijk WJD, Verjans GMGM. Pathogenesis of varicelloviruses in primates. J Pathol. 2015;235: 298–311. doi: 10.1002/path.4451 - DOI - PMC - PubMed

Publication types