. 2022 Jun;142(6):1587-1596.e2.
doi: 10.1016/j.jid.2021.09.038. Epub 2021 Nov 19.

Noninvasive Tape-Stripping with High-Resolution RNA Profiling Effectively Captures a Preinflammatory State in Nonlesional Psoriatic Skin

Affiliations

Noninvasive Tape-Stripping with High-Resolution RNA Profiling Effectively Captures a Preinflammatory State in Nonlesional Psoriatic Skin

Lam C Tsoi et al. J Invest Dermatol. 2022 Jun.

Abstract

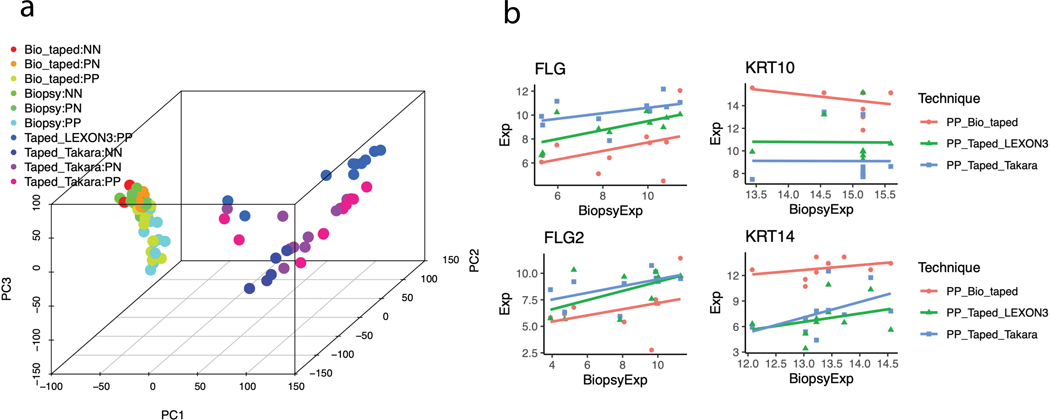
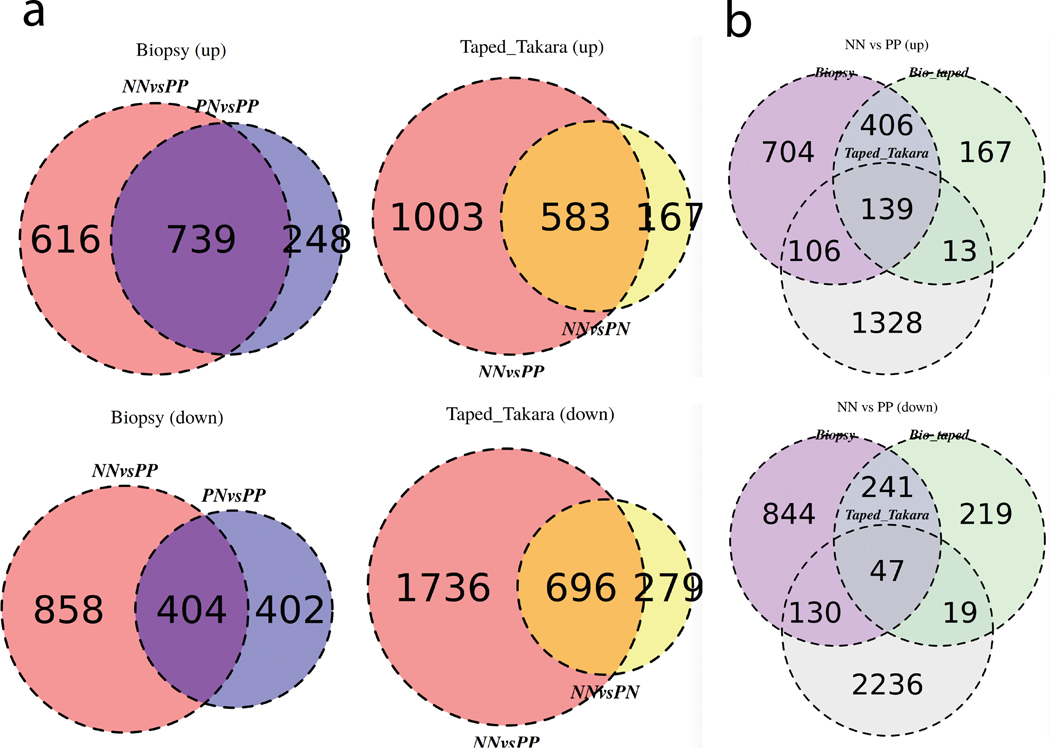
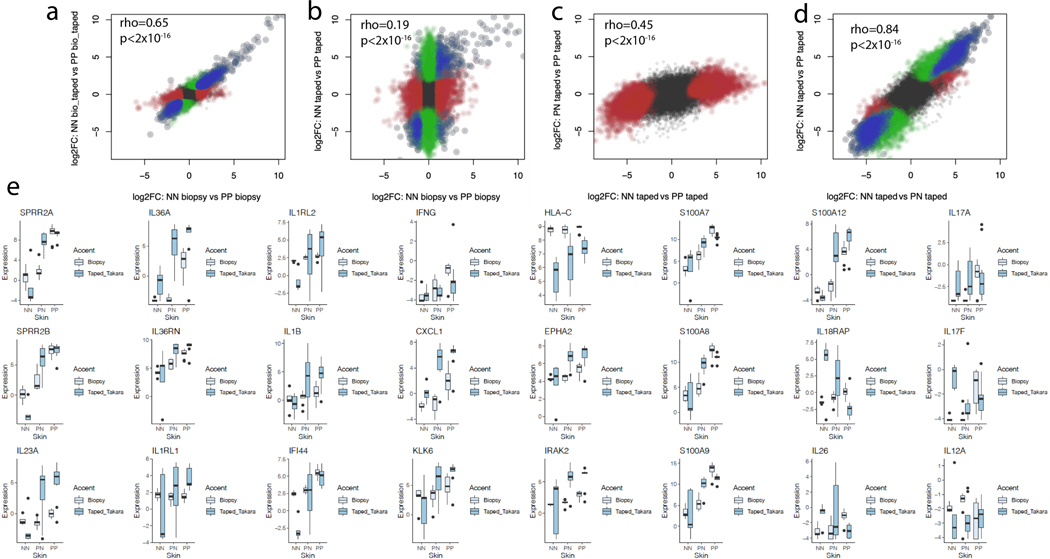
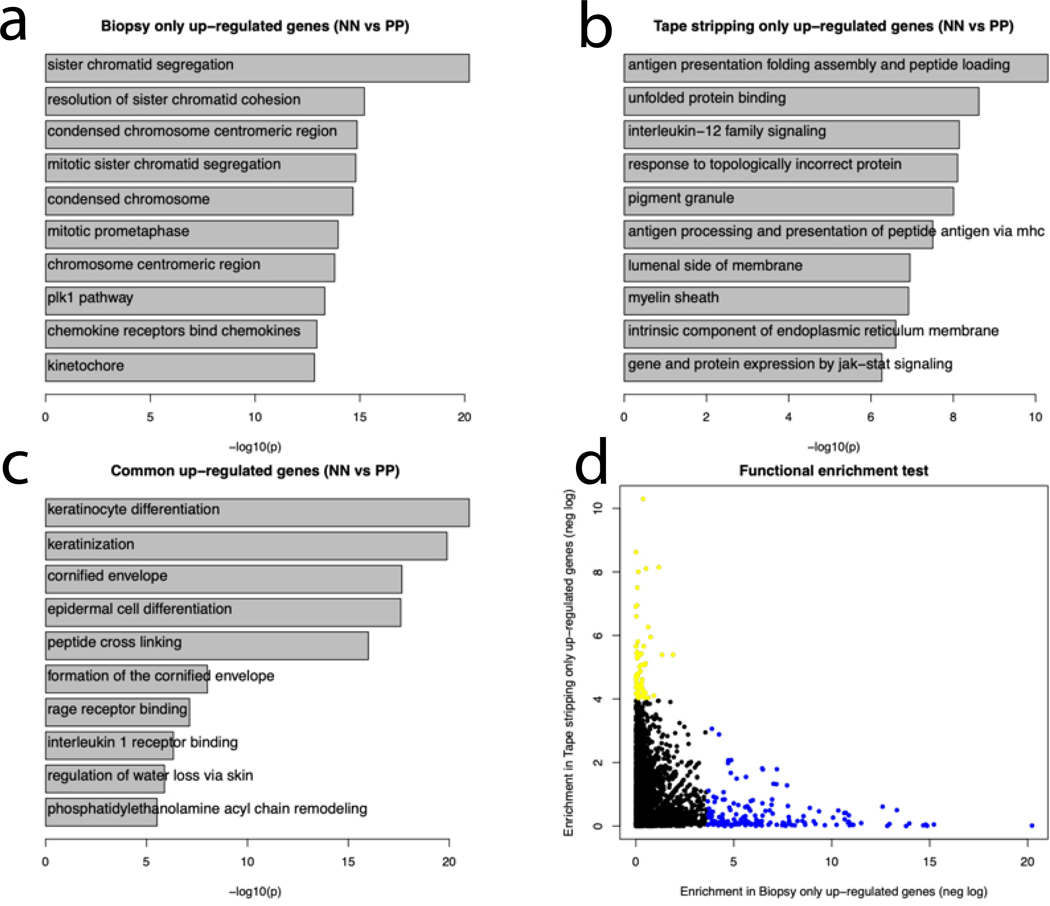
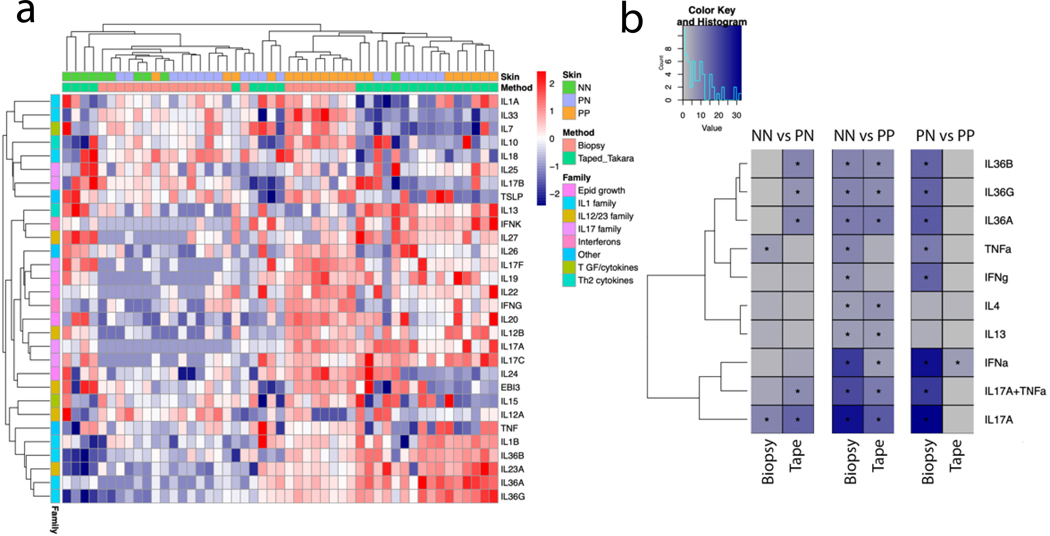
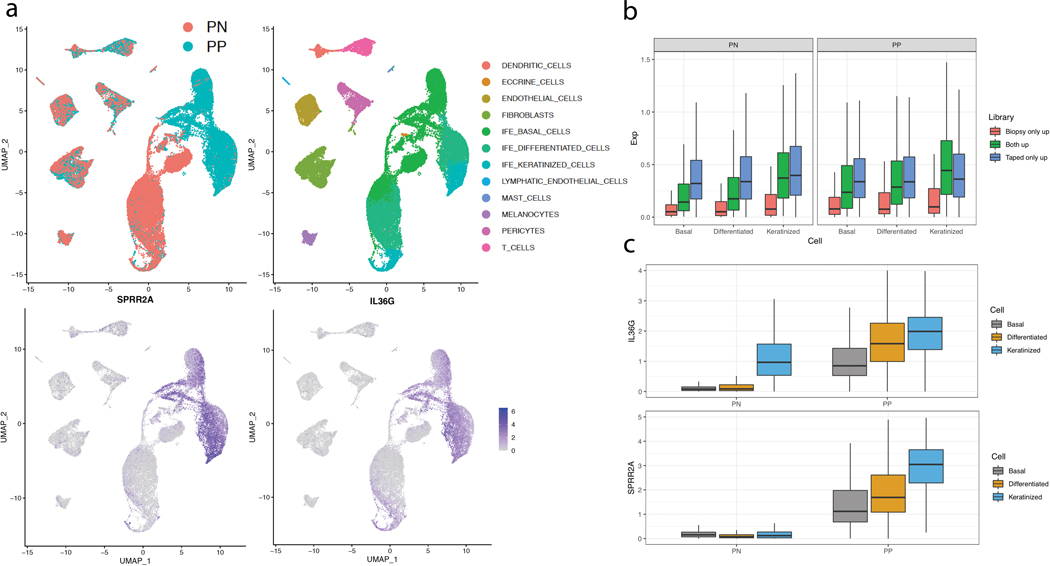
Tape stripping is a minimally invasive, nonscarring method that can be utilized to assess gene expression in the skin but is infrequently used given technical constraints. By comparing different tape stripping technologies and full-thickness skin biopsy results of lesional and nonlesional psoriatic skin from the same patients, we demonstrate that tape stripping with optimized high-resolution transcriptomic profiling can be used to effectively assess and characterize inflammatory responses in the skin. Upon comparison with single-cell RNA-sequencing data from psoriatic full-thickness skin biopsies, we illustrate that tape-stripping efficiently captures the transcriptome of the upper layers of the epidermis with sufficient resolution to assess the molecular components of the feed-forward immune amplification pathway in psoriasis. Notably, nonlesional psoriatic skin sampled by tape stripping demonstrates activated, proinflammatory changes when compared to healthy control skin, suggesting a prepsoriatic state, which is not captured on full-thickness skin biopsy transcriptome profiling. This work illustrates an approach to assess inflammatory response in the epidermis by combining noninvasive sampling with high throughput RNA-sequencing, providing a foundation for biomarker discoveries and mechanism of action studies for inflammatory skin conditions.


Figures

Figure 1.
Figure 1.. Principal Component Analysis and Gene-gene correlation analyses.
(A) Principal component analysis of samples obtained from full-thickness biopsies and tape-stripped samples (representative from two types of library preparation kits - Takara and Lexon3). Lexon3 preparation only yielded usable RNA from a small proportion of lesional skin samples. The PC1 and PC2 explain 25% and 8% of the transcriptome variations, respectively. (B) Correlations of the normalized expression values for signature genes in the epidermal compartments between full-thickness biopsy (x-axis) versus other techniques (y-axis). “Bio_taped”, “Biopsy”, and “Taped” represent biopsy samples taken from tape-stripped area, biopsy samples, and tape- stripped samples, respectively.
Figure 2.
Figure 2.. Venn diagram of upregulated and downregulated DEGs.
(A) (left) Up-regulated and down-regulated DEGs from RNA isolated from full-thickness biopsies comparing normal (NN) and uninvolved (PN) vs. lesional psoriatic skin (PP); (right) Up-regulated and down-regulated DEGs in RNA isolated from tape-stripped skin comparing normal (NN) vs. lesional (PP) and non-lesional psoriatic skin (PN). (B) Comparison of the DEGs obtained from RNA isolated from full-thickness biopsy, tape-stripping, and biopsies obtained underneath tape-stripped areas in normal (NN) vs. lesional psoriatic skin (PP). A criterion of 2-fold change and a false-discovery- rate (FDR) of < 10% as criteria were used for comparisons.
Figure 3.
Figure 3.. Correlation between effect sizes estimation in comparison from biopsy and tapestripping.
(A-D) Correlation between the effect sizes of gene dysregulation from full thickness intact lesional psoriatic (comparing against healthy control) versus full-thickness taped lesional psoriatic skin (left upper figure), and correlation between full-thickness intact lesional versus tape-stripped lesional (right upper figure). For the tape-stripped samples, correlation between lesional vs healthy skin and lesional vs non-lesional skin (left lower figure), and between gene expression in normal vs. uninvolved and normal vs lesional (right lower figure). Red color indicates significant DEGs for the label on the X-axis, green color indicates significant DEGs for the label on the Y-axis. Blue indicates significant DEGs from both. (E) Expression profiles for selected genes highlighting the values captured in different technologies. The lower and upper hinges correspond to the 25th and 75th percentiles; the upper whisker extends from the hinge to the largest value no further than 1.5x Inter-quartile Range (IQR) from the hinge, while the lower whisker extends from the hinge to the smallest value at most 1.5x of the IQR of the hinge.
Figure 4.
Figure 4.. Enrichment of Biological Processes in tape stripped vs. biopsied skin.
(A,B,C) Genes identified in both full-thickness biopsy and tape-stripped skin RNA were enriched for biological functions primarily involving epidermal function such as keratinocyte differentiation, cornified envelop and interleukin-1 receptor binding. Genes only seen in the full-thickness biopsies were enriched for sister chromatic segregation, mitotic prometaphase and kinetochore. Genes only seen in the tape-stripping were enriched for antigen processing and presentation, IL-12 family signaling and JAK-STAT signaling. (D) There was no overlap in the significant functions for DEGs in biopsy only and tape-stripping only. Blue dots represent functions significantly enriched among genes up-regulated in the Biopsy samples only; yellow dots represent functions significantly enriched among genes up-regulated in Tape-stripping samples only.
Figure 5.
Figure 5.. Cytokine expression and signatures in tape stripped vs. biopsied skin.
(A) The heatmap shows inverse normalized gene expression of various cytokines in normal (NN), uninvolved (PN) and lesional psoriatic skin (PP) from full thickness biopsies (pink) or from tape-stripped RNA (green). Hierarchical clustering was used in the dendrograms (B) Cytokine response signatures in full-thickness biopsy samples (first three columns) and from tape-stripped RNA compared against different groups (NN, PN and PP). Significant results are shown (*corrected p-value <= 0.05, and Observed/Expected ratio >=2)
Figure 6.
Figure 6.. Tape-stripping captures gene expression signatures preferentially from the top layers of the epidermis.
(A) The UMAP shows cell clusters from scRNA-seq from psoriatic and non-psoriatic skin, along with the normalized expression of prominent genes (SPRR2A and IL36G) captures with tape-stripping. (B) The average normalized expression levels in scRNA-seq for genes identified to be up-regulated in PP skin from different techniques; the expression levels in different epithelial compartments (basal, differentiated/spinous, keratinized/granular) are shown. Genes captured by tape-stripping tend to be localized to the differentiated or keratinized layers of the epidermis. The lower and upper hinges correspond to the 25th and 75th percentiles; the upper whisker extends from the hinge to the largest value no further than 1.5x Inter-quartile Range (IQR) from the hinge, while the lower whisker extends from the hinge to the smallest value at most 1.5x of the IQR of the hinge. (C) Examples of the normalized expression levels of two genes (IL36G and SPRR2A) in different epithelial compartments.

References

    1. Bata-Csorgo Z, Cooper KD, Ting KM, Voorhees JJ, Hammerberg C (1998) Fibronectin and alpha5 integrin regulate keratinocyte cell cycling. A mechanism for increased fibronectin potentiation of T cell lymphokine-driven keratinocyte hyperproliferation in psoriasis. J Clin Invest 101:1509–18. - PMC - PubMed
    1. Broccardo CJ, Mahaffey SB, Strand M, Reisdorph NA, Leung DY (2009) Peeling off the layers: skin taping and a novel proteomics approach to study atopic dermatitis. J Allergy Clin Immunol 124:1113–5 e1–11. - PMC - PubMed
    1. Buerger C, Richter B, Woth K, Salgo R, Malisiewicz B, Diehl S, et al. (2012) Interleukin-1beta interferes with epidermal homeostasis through induction of insulin resistance: implications for psoriasis pathogenesis. The Journal of investigative dermatology 132:2206–14. - PubMed
    1. Butler A, Hoffman P, Smibert P, Papalexi E, Satija R (2018) Integrating single-cell transcriptomic data across different conditions, technologies, and species. Nature biotechnology 36:411–20. - PMC - PubMed
    1. Cargill M, Schrodi SJ, Chang M, Garcia VE, Brandon R, Callis KP, et al. (2007) A large-scale genetic association study confirms IL12B and leads to the identification of IL23R as psoriasis-risk genes. Am J Hum Genet 80:273–90. - PMC - PubMed

Publication types