. 2021 Dec 21;12(6):e0289321.
doi: 10.1128/mBio.02893-21. Epub 2021 Nov 23.

SOS-Independent Pyocin Production in P. aeruginosa Is Induced by XerC Recombinase Deficiency

Affiliations

SOS-Independent Pyocin Production in P. aeruginosa Is Induced by XerC Recombinase Deficiency

Nina S Baggett et al. mBio. .

Abstract

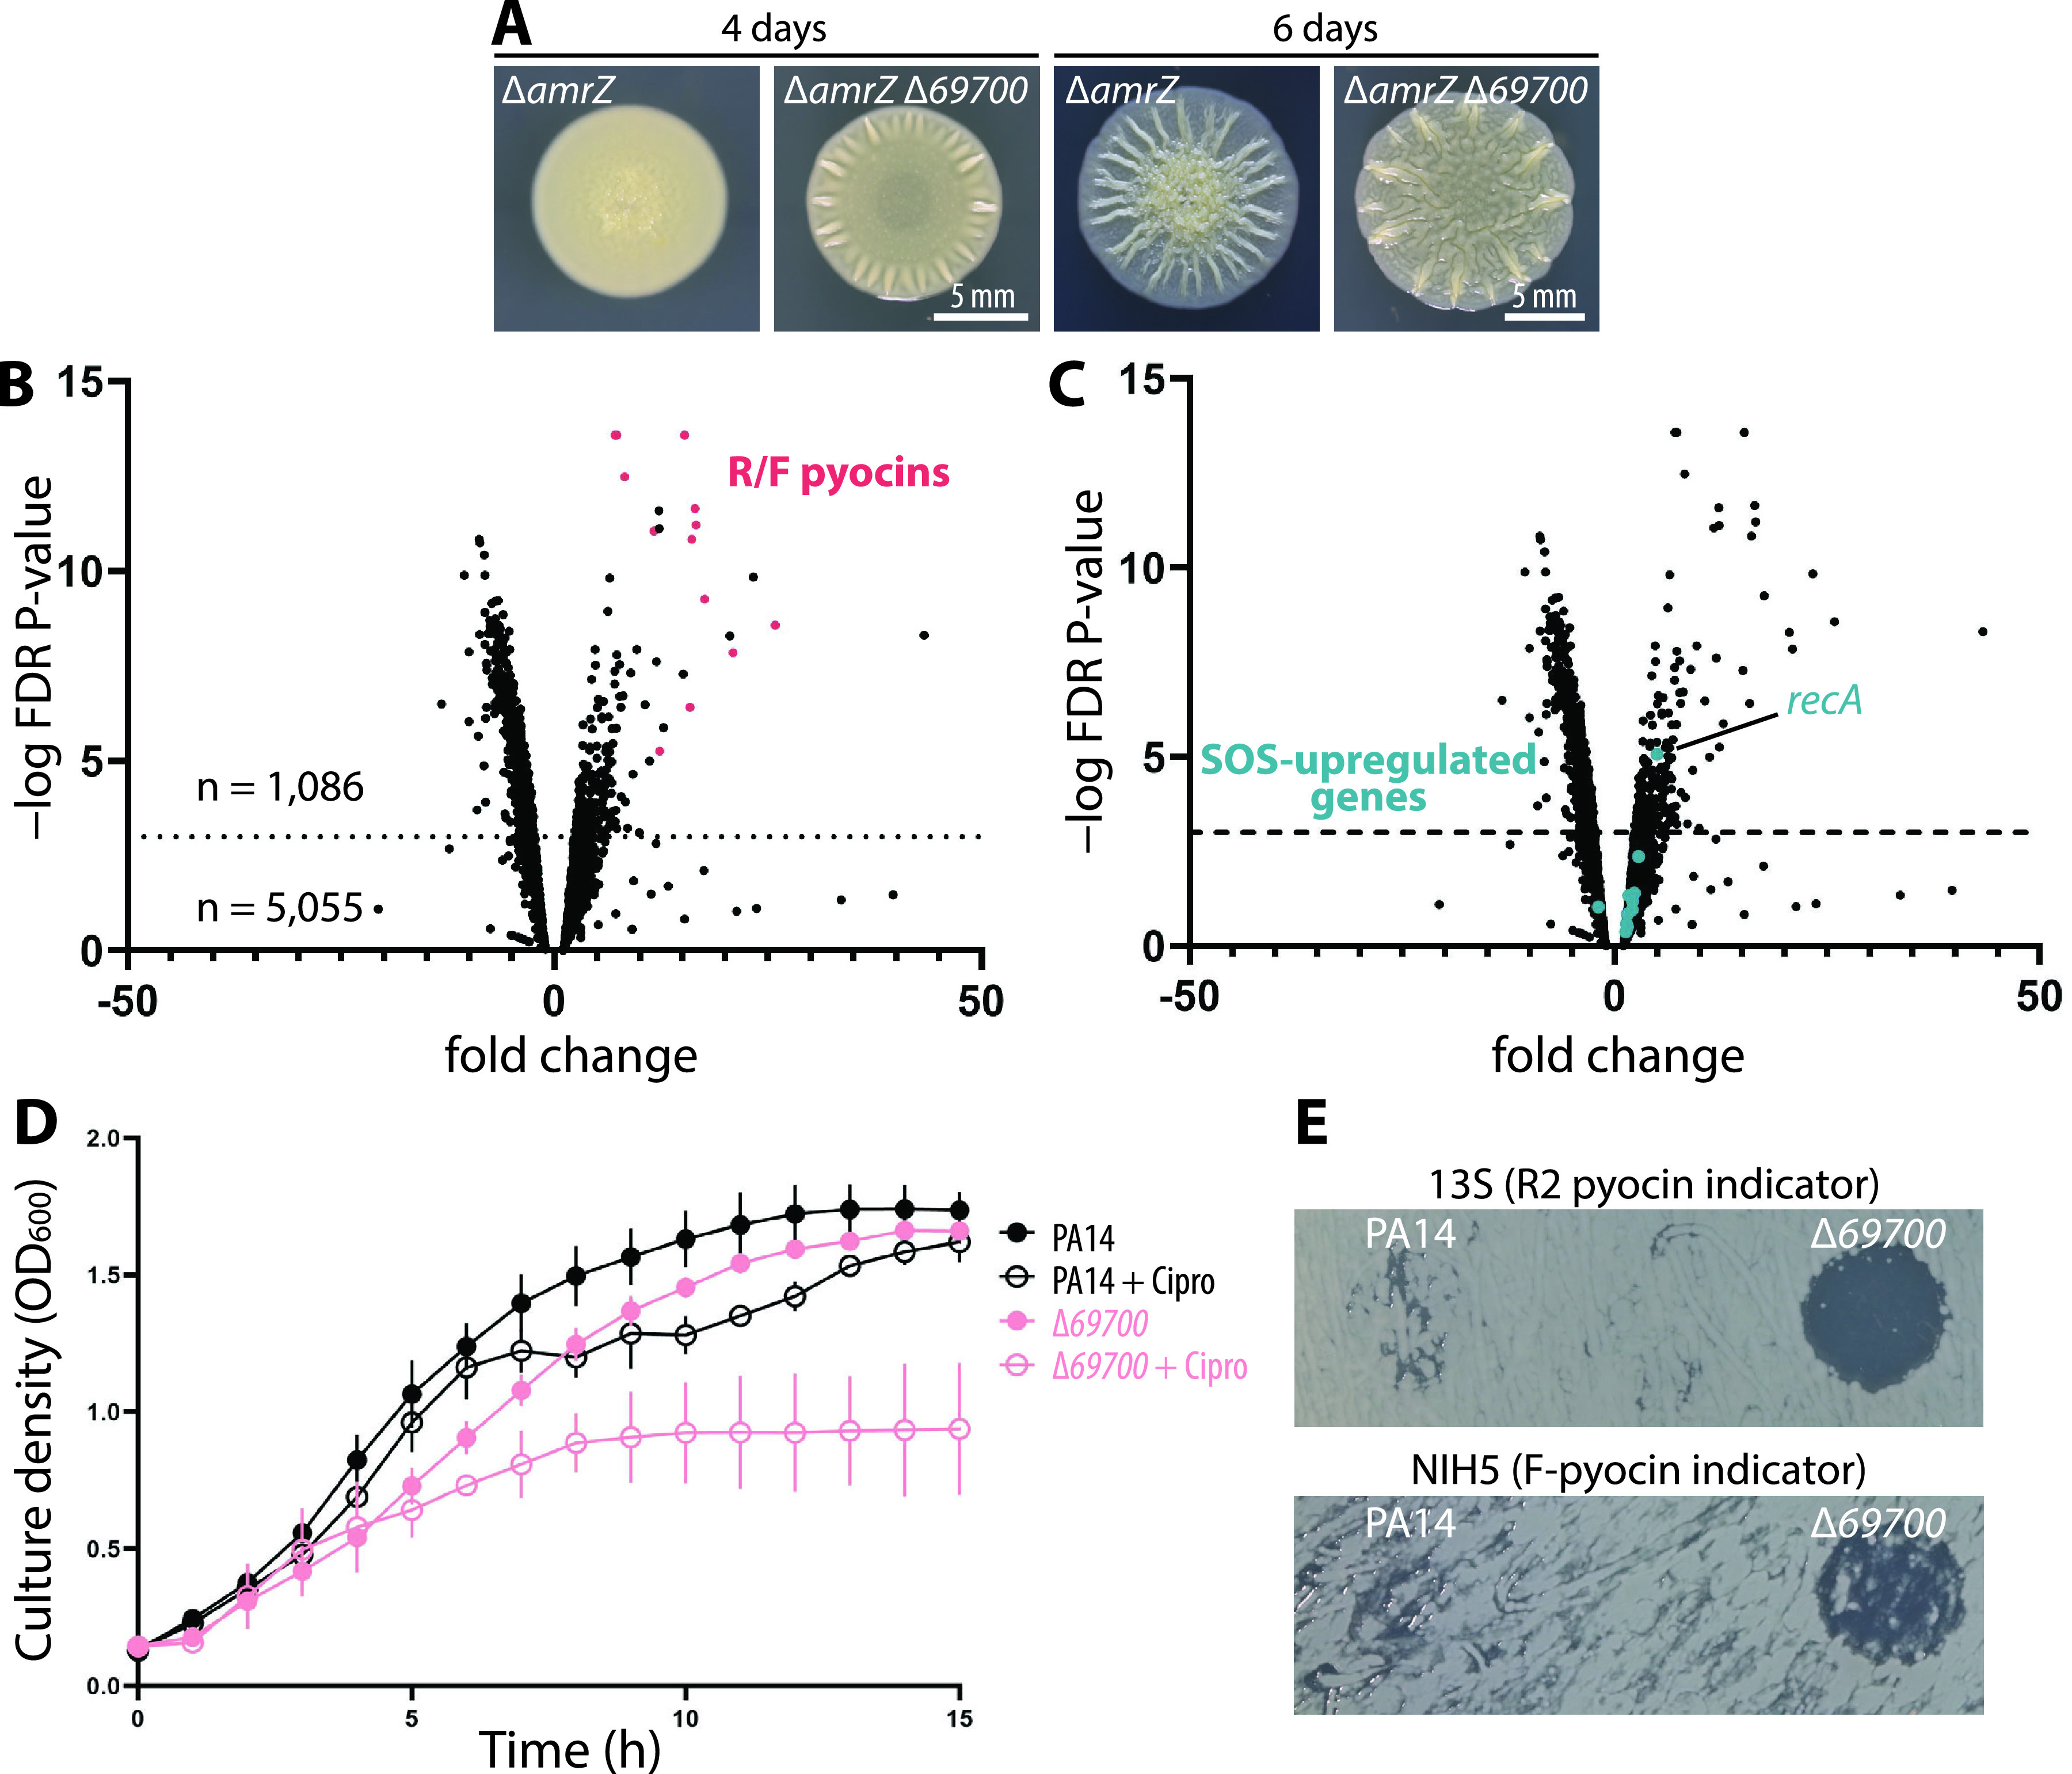
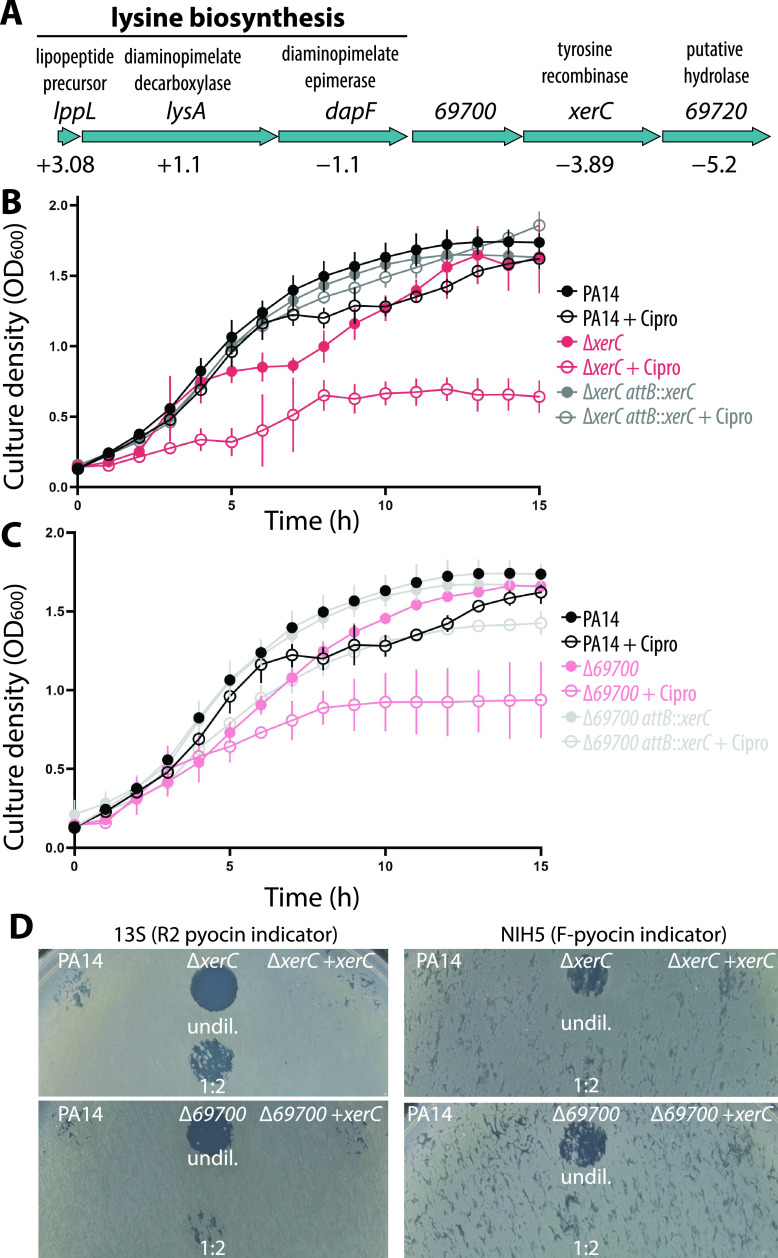
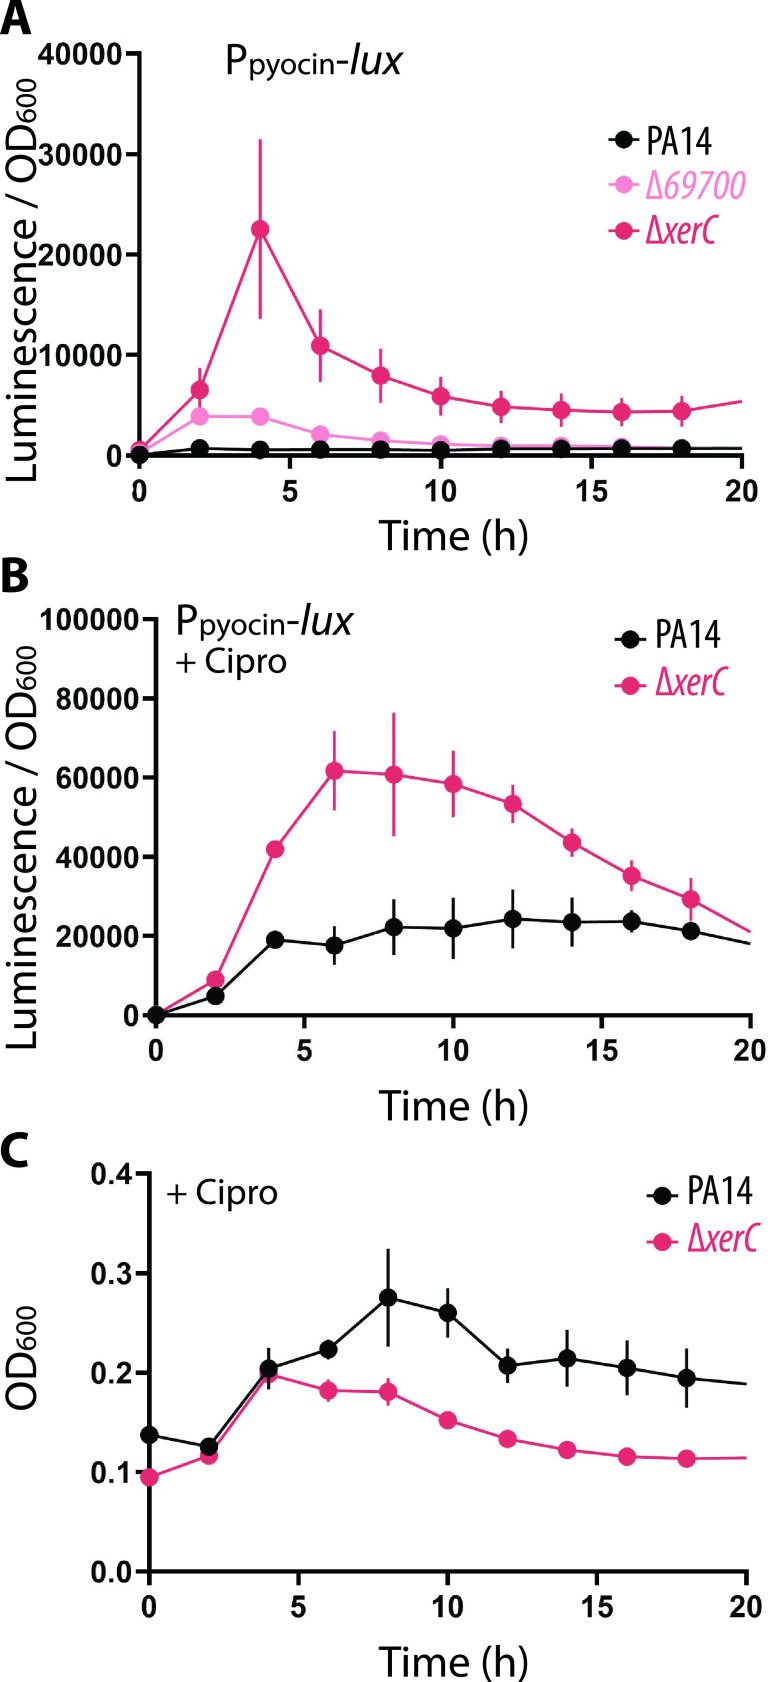
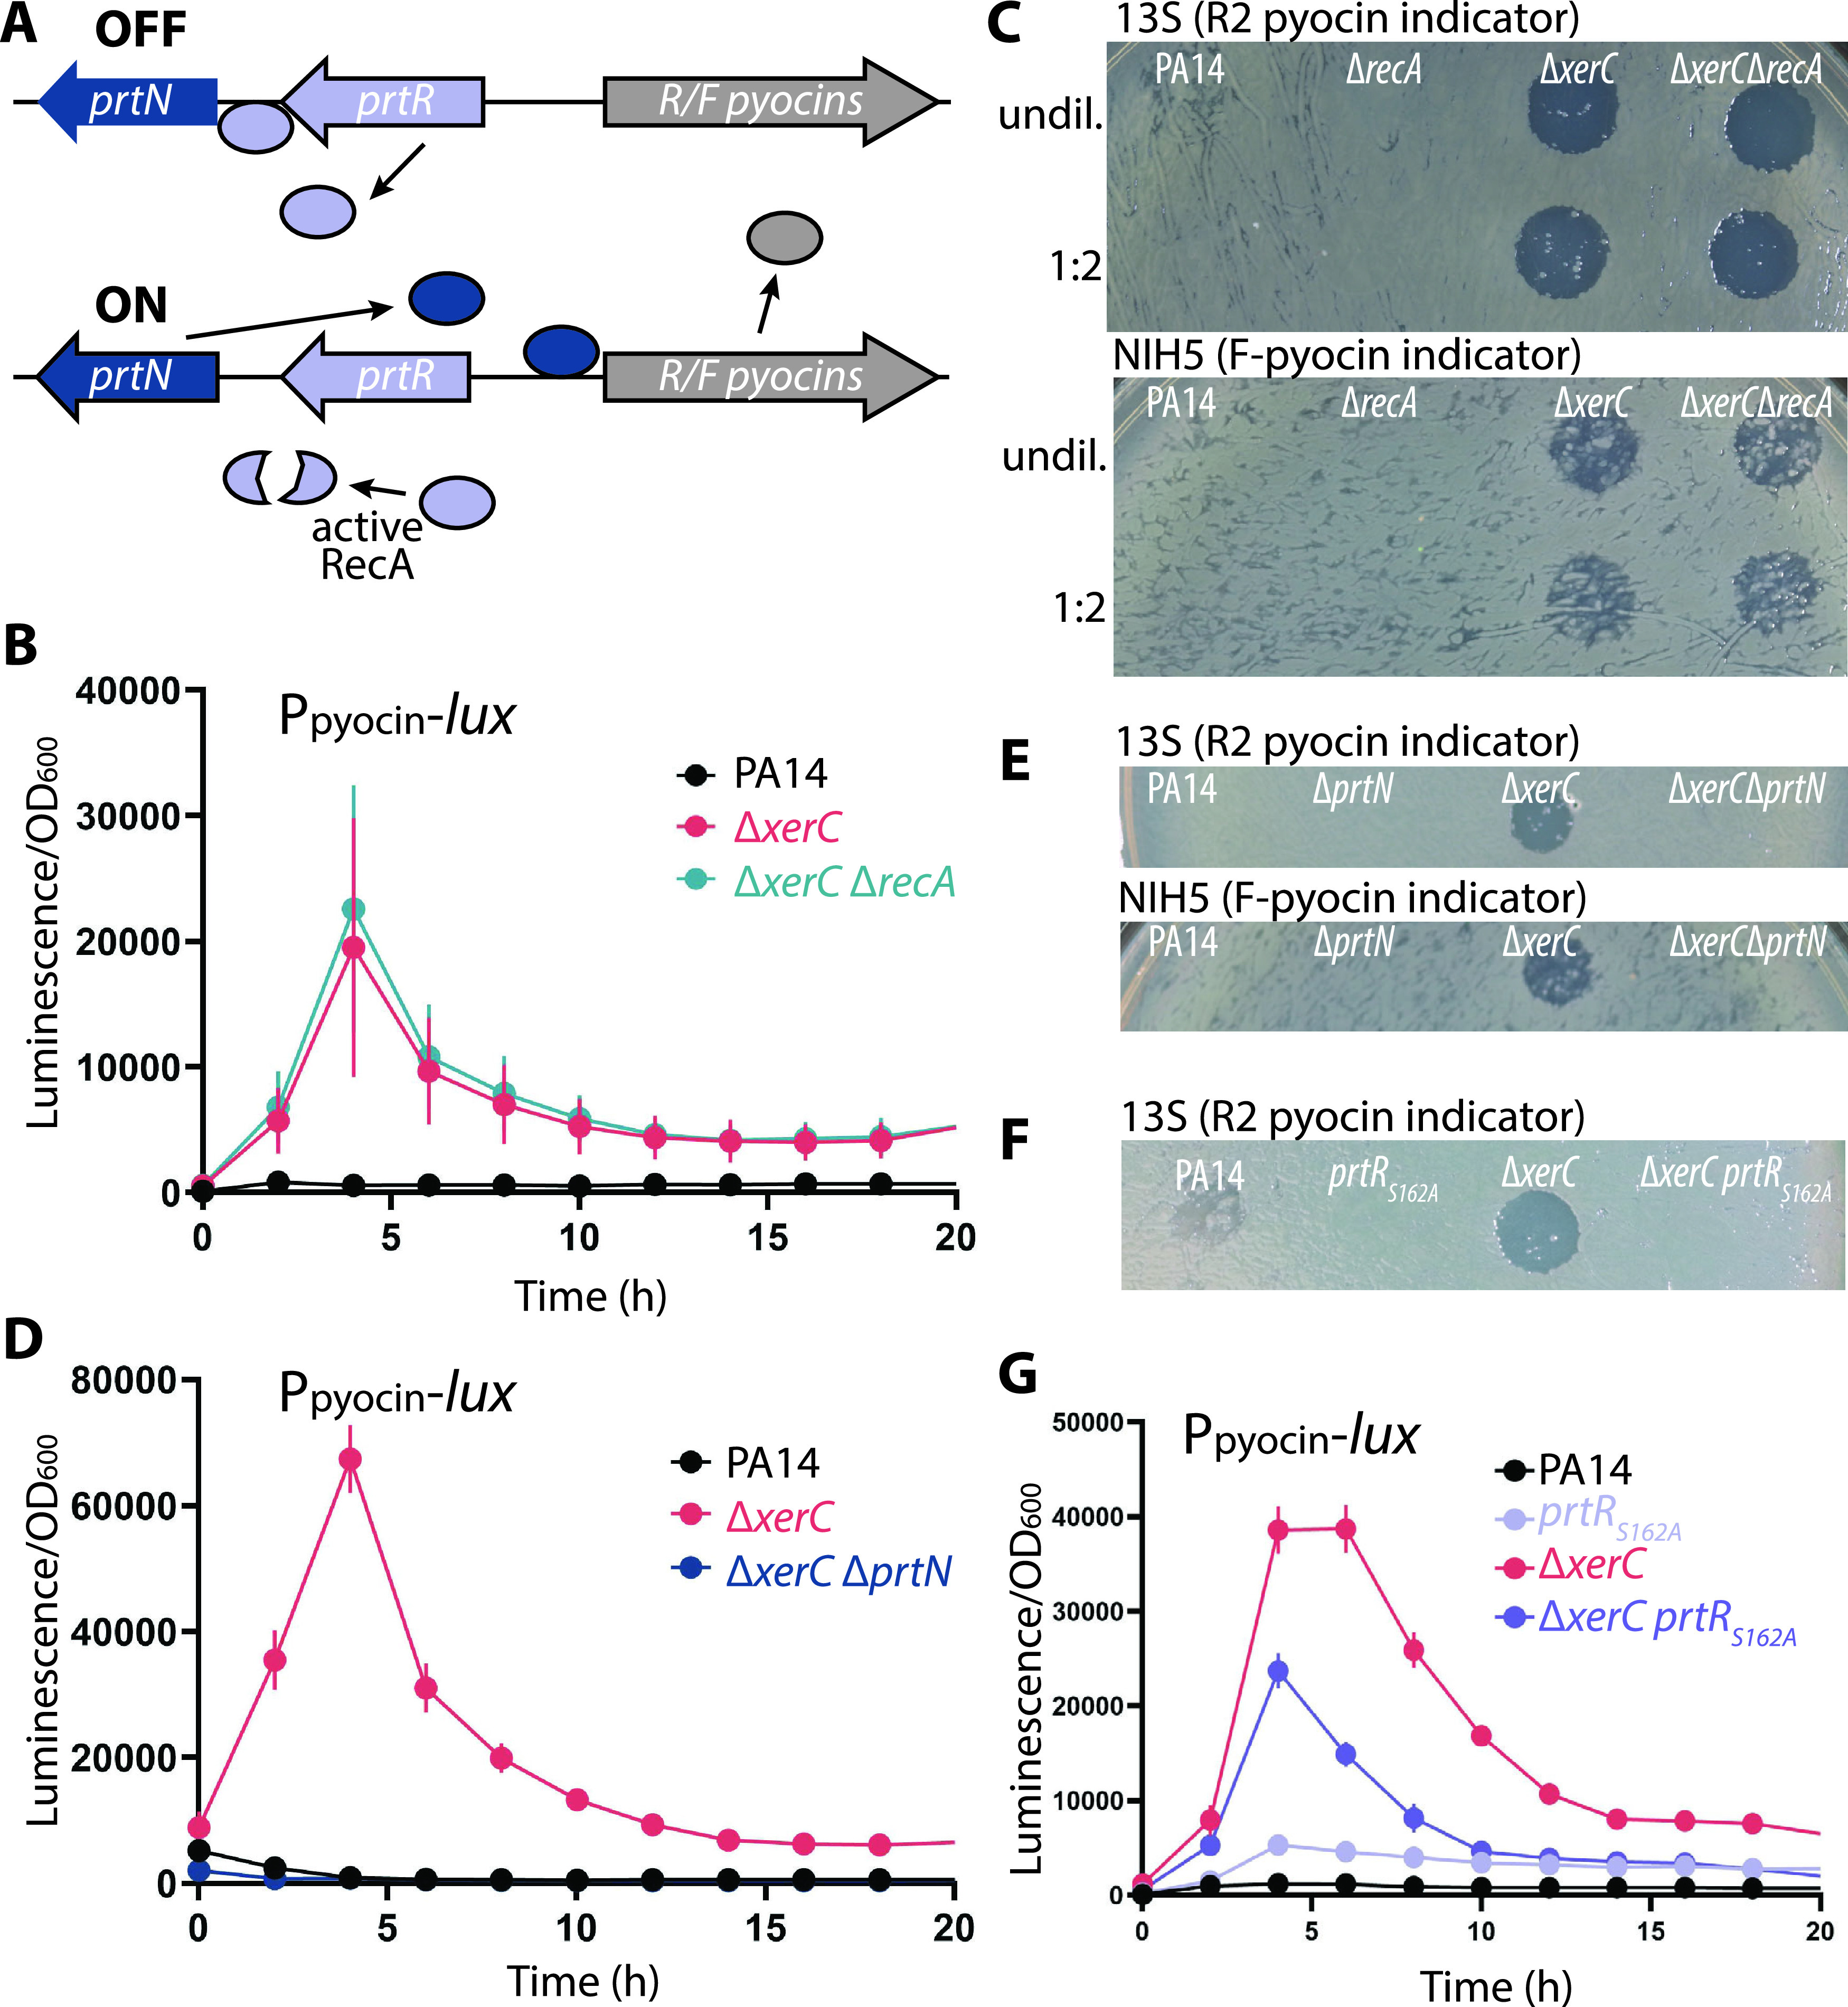
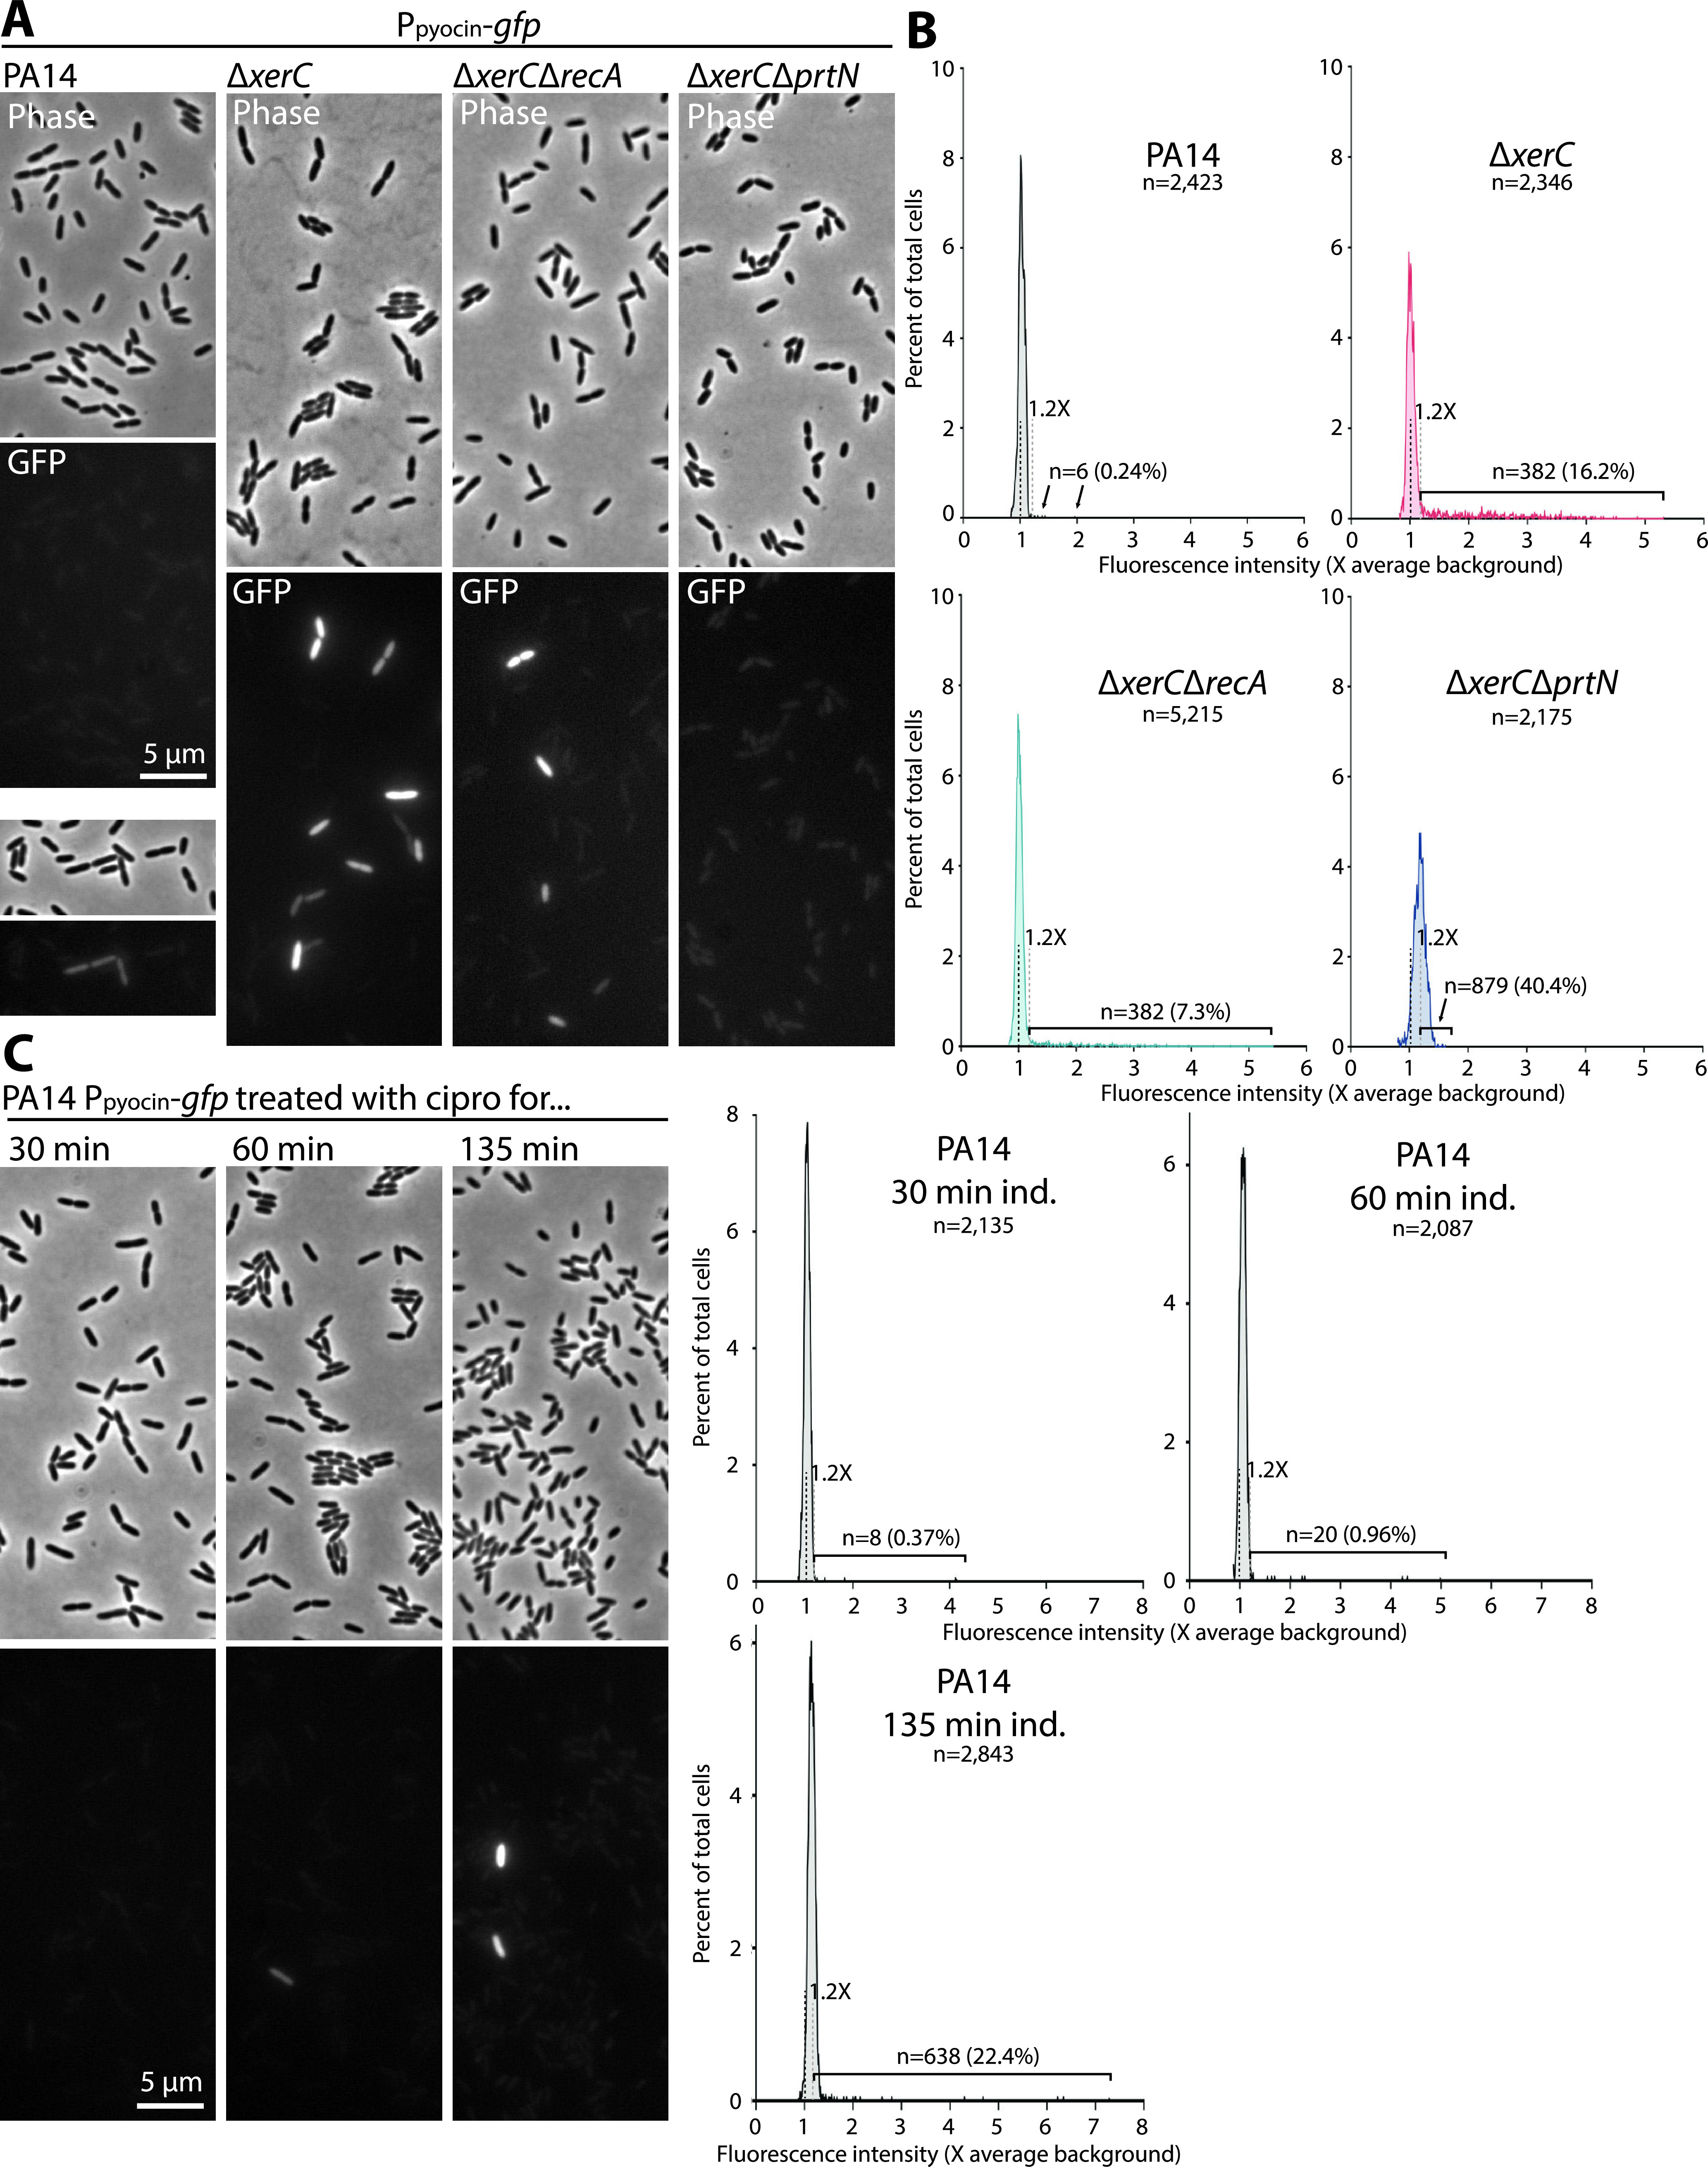
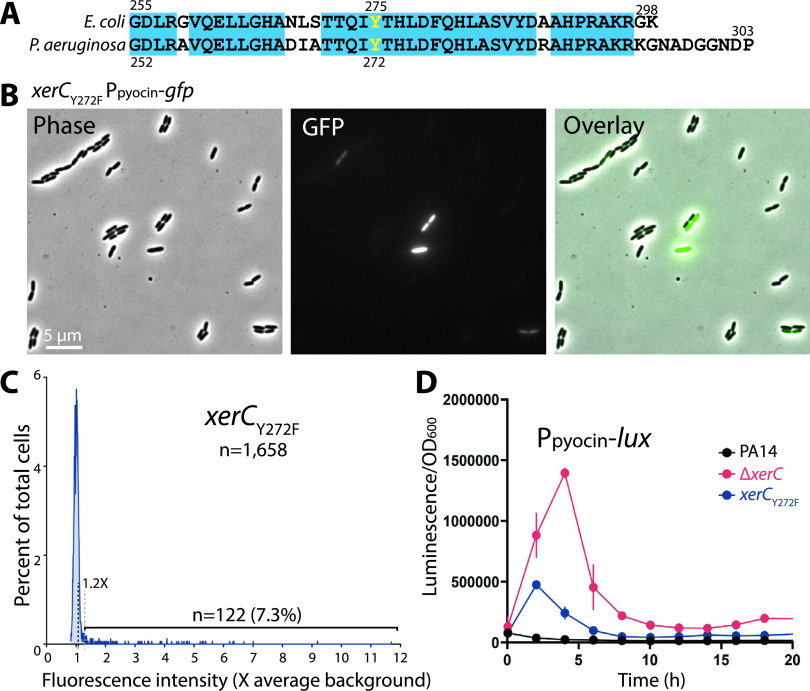
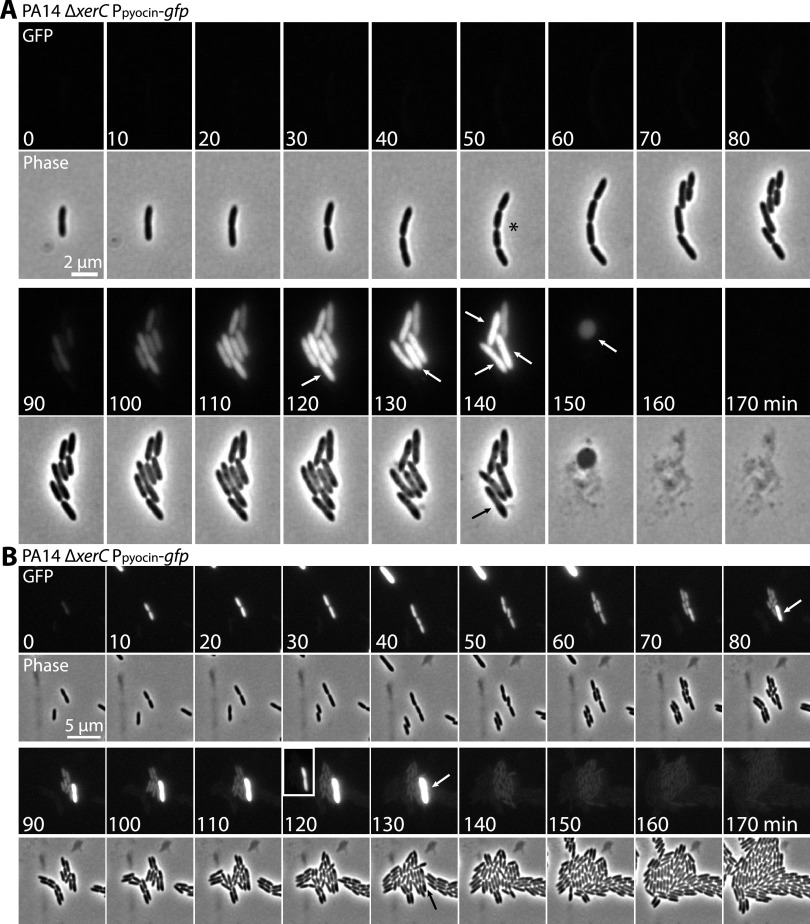
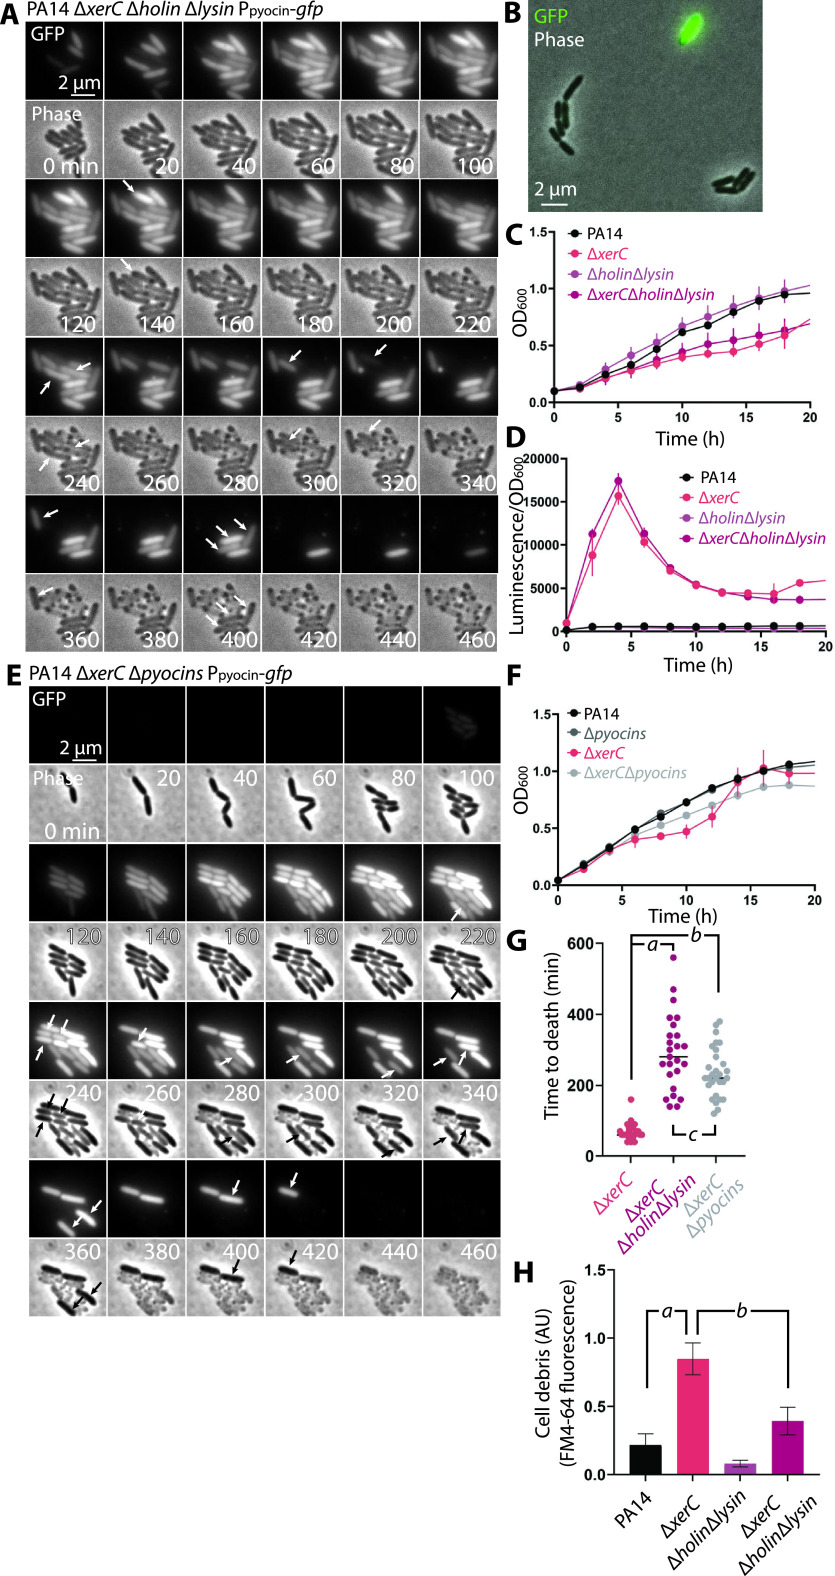
Pyocins are phage tail-like protein complexes that can be used by Pseudomonas aeruginosa to enact intraspecies competition by killing competing strains. The pyocin gene cluster also encodes holin and lysin enzymes that lyse producer cells to release the pyocins. The best-known inducers of pyocin production under laboratory conditions are DNA-damaging agents, including fluoroquinolone antibiotics, that activate the SOS response. Here, we report the discovery of an alternate, RecA-independent pathway of strong pyocin induction that is active in cells deficient for the tyrosine recombinase XerC. When ΔxerC cells were examined at the single-cell level, only a fraction of the cell population strongly expressed pyocins before explosively lysing, suggesting a that a built-in heterogenous response system protects the cell population from widespread lysis. Disabling the holin and lysin enzymes or deleting the entire pyocin gene cluster blocked explosive lysis and delayed but did not prevent the death of pyocin-producing cells, suggesting that ΔxerC cells activate other lysis pathways. Mutating XerC to abolish its recombinase activity induced pyocin expression to a lesser extent than the full deletion, suggesting that XerC has multiple functions with respect to pyocin activation. Our studies uncover a new pathway for pyocin production and highlight its response across a genetically identical population. Moreover, our finding that ΔxerC populations are hypersensitive to fluoroquinolones raises the intriguing possibility that XerC inhibition may potentiate the activity of these antibiotics against P. aeruginosa infections. IMPORTANCE Pseudomonas aeruginosa is a versatile and ubiquitous bacterium that frequently infects humans as an opportunistic pathogen. P. aeruginosa competes with other strains within the species by producing killing complexes termed pyocins, which are only known to be induced by cells experiencing DNA damage and the subsequent SOS response. Here, we discovered that strains lacking a recombinase enzyme called XerC strongly produce pyocins independently of the SOS response. We also show that these strains are hypersensitive to commonly used fluoroquinolone antibiotic treatment and that fluoroquinolones further stimulate pyocin production. Thus, XerC is an attractive target for future therapies that simultaneously sensitize P. aeruginosa to antibiotics and stimulate the production of bactericidal pyocins.

Keywords: Pseudomonas aeruginosa; competition; heterogeneity; pyocins; recombinase.


Figures

FIG 1
FIG 1
Pyocin genes, but not canonical SOS genes, are upregulated in a Δ69700 strain, causing ciprofloxacin sensitivity. (A) Representative images of biofilm colonies grown on M6301 agar from which total RNA was extracted for transcriptomic analysis. RNA was extracted at day 4. (B) Volcano plot showing differentially regulated genes in a ΔamrZ Δ69700 strain (MTC1398) versus the ΔamrZ parent (MTC590). A false-discovery rate (FDR) threshold of 10−3 was considered significant. R/F pyocin-encoding genes are shown in red. (C) The same volcano plot as in panel B, showing in teal genes that were strongly upregulated under SOS-inducing conditions in a study by Cirz et al. (19). (D) Representative growth curves of wild-type PA14 (MTC1) and Δ69700 (MTC1513) strains in LB-Lennox in the absence and presence of 0.03 μg/mL ciprofloxacin. Error bars show standard deviations for at least three technical replicates. (E) Indicator assays showing R/F pyocin production by PA14 and the Δ69700 mutant; clearing indicates the presence of pyocins in cell-free culture supernatants.
FIG 2
FIG 2
Pyocin gene upregulation and ciprofloxacin sensitivity in Δ69700 is caused by deficiency of xerC. (A) Schematic of the lppL operon showing the encoded enzymes and their relative expression (fold change) in the ΔamrZ Δ69700 strain (MTC1398) versus the ΔamrZ strain (MTC590). (B) Representative growth curves of PA14 (MTC1) and the ΔxerC (MTC2266) and ΔxerC attB::CTX-1-PlppL-xerC (“attB::xerC”) (MTC2262) mutants in LB-Lennox medium with and without 0.03 μg/mL ciprofloxacin. (C) Representative growth curves of PA14 and the Δ69700 (MTC1513) and Δ69700 attB::CTX-1-PlppL-xerC (“attB::xerC”) (MTC2264) strains in LB-Lennox medium with and without 0.03 μg/mL ciprofloxacin. Error bars in panels B and C show standard deviations for at least three technical replicates. (D) Indicator assays showing R/F pyocin production by PA14 compared to Δ69700 and ΔxerC strains complemented or not with xerC (attB::CTX-1-PlppL-xerC). The supernatants were diluted 2-fold with fresh sterile LB where indicated.
FIG 3
FIG 3
Deletion of xerC increases pyocin gene expression. (A) Representative transcriptional profile of a P07990-lux reporter (reporting on R/F pyocin gene transcription) during growth in LB-Lennox by wild-type PA14 (MTC2280), Δ69700 (MTC2281), or ΔxerC (MTC2297) strains. (B) Representative transcriptional profile as in panel B of wild-type PA14 or ΔxerC strains treated with 0.06 μg/mL ciprofloxacin. (C) Growth curves from the experiment reported in panel B. Error bars show standard deviations for at least three technical replicates; some error bars are smaller than the graph symbols.
FIG 4
FIG 4
Expression and production of pyocins by ΔxerC does not require RecA but requires PrtN. (A) Schematic of RecA-PrtN/R-mediated pyocin production. When the SOS response is inactive, PrtR represses prtN transcription so that pyocin expression is off. The presence of activated RecA during the SOS response induces PrtR autoproteolytic cleavage, permitting PrtN production and hence activating pyocin gene expression. (B) Representative transcriptional profiles (P07990-lux reporter) of PA14 (MTC2280), ΔxerC (MTC2297), and ΔxerC ΔrecA (MTC2301) strains. (C) Pyocin indicator assays using cell-free stationary-phase culture supernatants from PA14, ΔrecA (MTC2274), ΔxerC (MTC2266), and ΔxerC ΔrecA (MTC2288) strains. The supernatants were diluted 2-fold with fresh sterile LB where indicated. (D) Representative transcriptional profiles (P07990-lux reporter) of PA14, ΔxerC, and ΔxerC ΔprtN (MTC2298) strains. (E) Pyocin indicator assays as indicated using cell-free stationary-phase culture supernatants from PA14, ΔprtN (MTC2276), ΔxerC (MTC2266), and ΔxerC ΔprtN (MTC2289) strains. (F) Pyocin indicator assay using cell-free stationary-phase culture supernatants of PA14, the ΔxerC mutant, and their counterparts producing uncleavable PrtRS162A as the only source of PrtR in the cell (MTC2305 and MTC2304, respectively). (G) Representative transcriptional profiles (P07990-lux reporter) of PA14 and ΔxerC strains without or with (MTC2308 and MTC2307, respectively) uncleavable PrtRS162A as the only source of PrtR in the cell. Error bars in panels B, D, and G show standard deviations for three technical replicates.
FIG 5
FIG 5
Pyocin expression is heterogeneous across individual cells. (A) Representative phase-contrast and fluorescence micrographs of PA14 (MTC2277), ΔxerC (MTC2252), ΔxerC ΔrecA (MTC2291), and ΔxerC ΔprtN (MTC2292) cells growing on agarose pads. (B) Line histograms of average GFP fluorescence in individual cells of the indicated strains. Fluorescence is plotted as a multiple of the average background value, which is indicated with a black dashed line. The gray dashed line represents 1.2× the average background value, which was set as the threshold for GFP positivity (see Materials and Methods and Fig. S2). The numbers and percentages of positive cells are indicated. (C) Representative micrographs of PA14 pyocin-reporter cells treated in liquid culture for the indicated times with 1 μg/mL ciprofloxacin. (D) Line histograms of GFP mean fluorescence in individual cells of the indicated strains. Annotations are as in panel B.
FIG 6
FIG 6
Effect of XerC recombinase inactivation. (A) Sequence alignment of the C-terminal ends of E. coli MG1655 and P. aeruginosa PA14 XerC proteins showing conservation (cyan boxes) and the catalytic Tyr residue (yellow). (B) Representative phase-contrast and fluorescence micrographs of PA14 xerCY272F bearing a P07990-gfp reporter at attB (MTC2341). (C) Line histograms of GFP mean fluorescence in individual PA14 xerCY272F cells (MTC2341). (D) Representative transcriptional profiles (P07990-lux reporter) of PA14 xerCY272F cells (MTC2339). Error bars show standard deviations for three technical replicates; some error bars are smaller than the symbols.
FIG 7
FIG 7
Fate of cells that turn on pyocin expression. (A) Time-lapse series of fluorescence (GFP) and phase micrographs of PA14 ΔxerC cells bearing a P07990-gfp reporter at attB (MTC2252) to report on R/F pyocin expression. Asterisk indicates chained cells. White arrows denote cells that lysed before the next time point. Black arrow indicates a cell that showed no GFP expression but that lysed with the other cells in the microcolony. (B) Time-lapse series as in panel A showing both a cell that strongly expressed GFP and lysed (white arrows) and cells that initially weakly expressed GFP but then appeared to turn off pyocin expression and continue growing. Inset (120 min): Image rescaled to show the relative weakness of GFP expression in cells that turned pyocin expression off compared to the strong expression of the cell that lysed.
FIG 8
FIG 8
Fate and phenotypes of pyocin-expressing cells with deletions of lysis genes. (A) Time-lapse series of fluorescence (GFP) and phase micrographs of PA14 ΔxerC Δholin Δlysin cells bearing a P07990-gfp reporter at attB (MTC2293) to report on R/F pyocin expression. Arrows denote apparent cell death accompanied by loss of GFP fluorescence. (B) Representative GFP-phase contrast overlay of MTC2293 cells in exponential phase. (C) Representative growth curves of wild-type PA14 (MTC2280), ΔxerC (MTC2297), Δholin Δlysin (MTC2284), and ΔxerC Δholin Δlysin (MTC2299) strains grown in LB-Lennox medium. (D) Representative transcriptional profiles (P07990-lux reporter) of the same experiment as in panel C. (E) Time-lapse series of fluorescence (GFP) and phase micrographs of PA14 ΔxerC Δpyocins cells bearing a P07990-gfp reporter at attB (MTC2332) to report on R/F pyocin expression. Arrows denote apparent cell death accompanied by loss of GFP fluorescence. (F) Representative growth curves of wild-type PA14 (MTC1), ΔxerC (MTC2266), Δpyocins (MTC2326) and ΔxerC Δpyocins (MTC2324) cells grown in LB-Lennox medium. (G) Manually curated plot of time intervals between appearance of visible GFP fluorescence and cell lysis or death (loss of GFP fluorescence) in ΔxerC (MTC 2252), ΔxerC Δholin Δlysin (MTC2293), and ΔxerC Δpyocins (MTC2324) cells (n = 25 for each condition). Horizontal lines indicate the mean value for each condition. Italic letters denote P values (2-tailed Student's t test): a, 2.9 × 10−10; b, 2.0 × 10−12; c, 0.03. (H) Graph of cell debris produced by PA14 (MTC1), ΔxerC (MTC2266), Δholin Δlysin (MTC2295), and ΔxerC Δholin Δlysin (MTC2294) cells, as assayed by ultracentrifugation and FM4-64 staining of cell-free supernatants. Values shown are averages from three separate experiments, with error bars denoting standard deviations. Italic letters denote P values (2-tailed Student's t test): a, 0.0018; b, 0.0056. Error bars in panels C to F indicate standard deviations for at least 3 technical replicates; some bars are smaller than the graph symbols.

References

    1. Driscoll JA, Brody SL, Kollef MH. 2007. The epidemiology, pathogenesis and treatment of Pseudomonas aeruginosa infections. Drugs 67:351–368. doi:10.2165/00003495-200767030-00003. - DOI - PubMed
    1. Scholl D. 2017. Phage tail-like bacteriocins. Annu Rev Virol 4:453–467. doi:10.1146/annurev-virology-101416-041632. - DOI - PubMed
    1. Oluyombo O, Penfold CN, Diggle SP. 2019. Competition in biofilms between cystic fibrosis isolates of Pseudomonas aeruginosa is shaped by R-pyocins. mBio 10:e01828-18. doi:10.1128/mBio.01828-18. - DOI - PMC - PubMed
    1. Mei M, Thomas J, Diggle SP. 2021. Heterogenous susceptibility to R-pyocins in populations of Pseudomonas aeruginosa sourced from cystic fibrosis lungs. mBio 12:e00458-21. doi:10.1128/mBio.00458-21. - DOI - PMC - PubMed
    1. Waite RD, Curtis MA. 2009. Pseudomonas aeruginosa PAO1 pyocin production affects population dynamics within mixed-culture biofilms. J Bacteriol 191:1349–1354. doi:10.1128/JB.01458-08. - DOI - PMC - PubMed

Publication types

MeSH terms

LinkOut - more resources