. 2021 Nov 22;21(1):549.
doi: 10.1186/s12870-021-03328-4.

Genome-wide association analysis uncovers the genetic architecture of tradeoff between flowering date and yield components in sesame

Affiliations

Genome-wide association analysis uncovers the genetic architecture of tradeoff between flowering date and yield components in sesame

Idan Sabag et al. BMC Plant Biol. .

Abstract

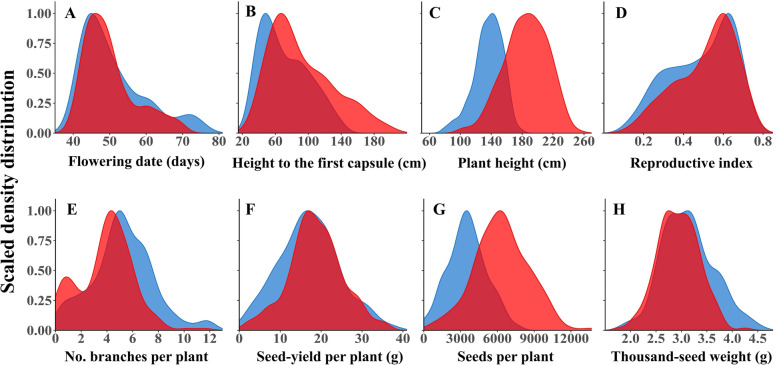
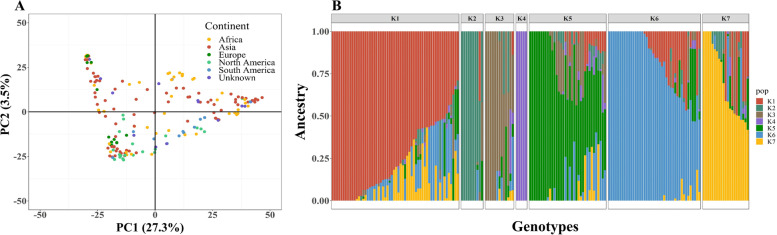
Background: Unrevealing the genetic makeup of crop morpho-agronomic traits is essential for improving yield quality and sustainability. Sesame (Sesamum indicum L.) is one of the oldest oil-crops in the world. Despite its economic and agricultural importance, it is an 'orphan crop-plant' that has undergone limited modern selection, and, as a consequence preserved wide genetic diversity. Here we established a new sesame panel (SCHUJI) that contains 184 genotypes representing wide phenotypic variation and is geographically distributed. We harnessed the natural variation of this panel to perform genome-wide association studies for morpho-agronomic traits under the Mediterranean climate conditions.

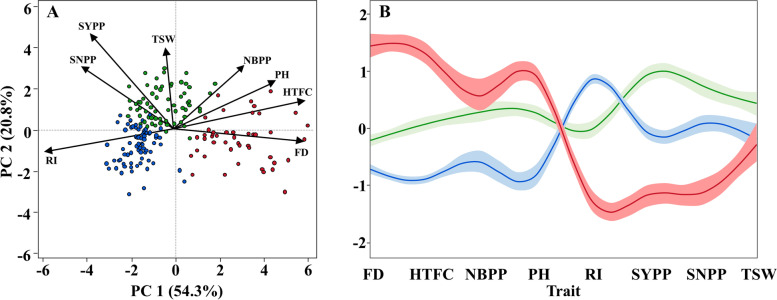
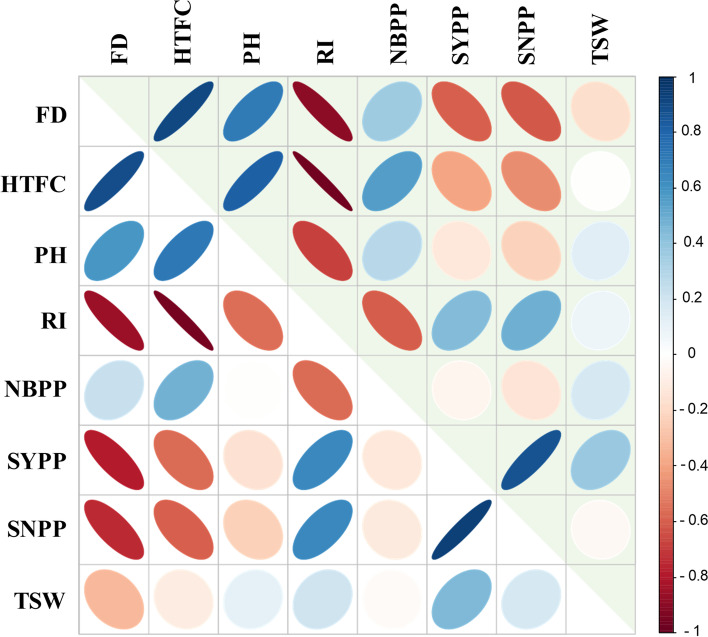
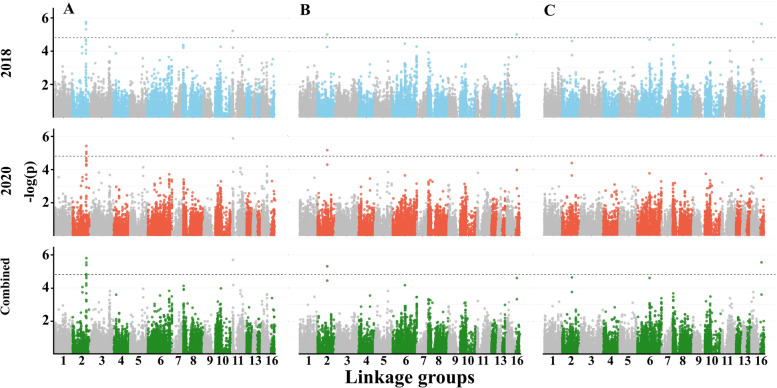
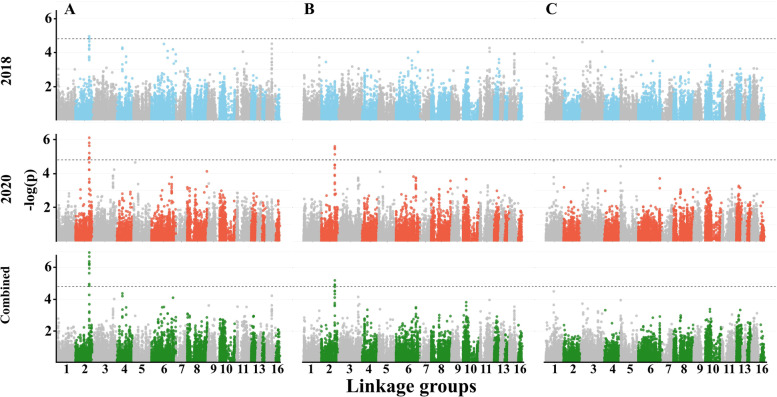
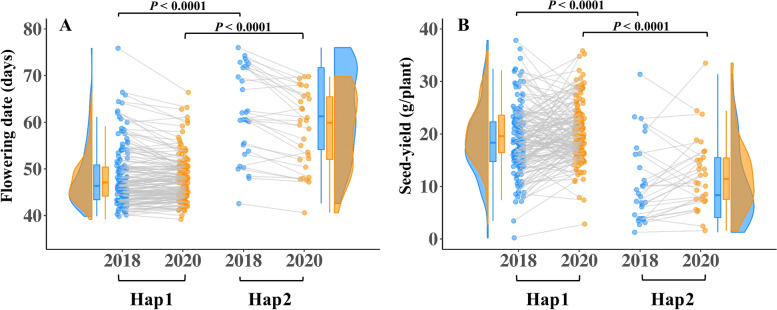
Results: Field-based phenotyping of the SCHUJI panel across two seasons exposed wide phenotypic variation for all traits. Using 20,294 single-nucleotide polymorphism markers, we detected 50 genomic signals associated with these traits. Major genomic region on LG2 was associated with flowering date and yield-related traits, exemplified the key role of the flowering date on productivity.

Conclusions: Our results shed light on the genetic architecture of flowering date and its interaction with yield components in sesame and may serve as a basis for future sesame breeding programs in the Mediterranean basin.

Keywords: Flowering date; GWAS; Sesame; Yield components.


Conflict of interest statement

The authors declare that they have no competing interests.y.

Figures

Fig. 1
Fig. 1
Density distribution of the measured traits. Phenological traits: (A) Flowering date. Plant architecture traits: (B) height to the first capsule, (C) plant height, (D) reproductive index, and (E) number of branches per plant. Yield components: (F) seed yield per plant, (G) seed number per plant, and (H) thousand-seed weight, grown in 2018 (blue) and 2020 (red) seasons
Fig. 2
Fig. 2
Multivariate analysis of the measured traits. (A) Principal component (PC) analysis of phenotypic traits of the combined data (2018 and 2020). Each dot represents one genotype. (B) K-means clustering analysis of the primary traits. Y-axis is the centered and scaled values for each trait and the lines are the cluster means with their confidence intervals. Clusters 1 (Green), 2, (Blue), and 3 (red) were estimated using the K-means clustering analysis. The traits included Flowering date (FD), height to the first capsule (HTFC), plant height (PH), number of branches per plant (NBPP), reproductive index (RI), seed-yield per plant (SYPP), seed number per plant (SNPP), and thousand-seed weight (TSW)
Fig. 3
Fig. 3
Population structure of the SCHUJI panel. (A) Principal component analysis and (B) ADMIXTURE when K = 7. Every single dot or line represents an individual genotype
Fig. 4
Fig. 4
Heatmap of phenotypic (upper triangular elements) and genomic (lower triangular elements) correlation matrix between the primary traits: Flowering date (FD), height to the first capsule (HTFC), plant height (PH), reproductive index (RI), number of branches per plant (NBPP), seed-yield per plant (SYPP), seed number per plant (SNPP), and thousand-seed weight (TSW). Colors indicate the level of correlations (r) from positive (blue) to negative (red)
Fig. 5
Fig. 5
Manhattan plots for phenological and plant architecture traits. (A) Flowering date, (B) height to the first capsule, and (C) reproductive index in 2018, 2020, and combined data. The dashed line represents the genome-wide significance threshold
Fig. 6
Fig. 6
Manhattan plots for yield components traits. (A) seed-yield per plant, (B) seed number per plant, and (C) thousand-seed weight. The dashed line represents the genome-wide significance threshold
Fig. 7
Fig. 7
Haplotype analysis of the major genomic region on LG2. Analysis of variance of haplotypes allele on (A) flowering date and (B) seed-yield across two years. Every dot represents a genotype. Blue color represents the 2018 growing season, orange represents the 2020 growing season, and grey lines connect the same genotypes in the two growing seasons

Similar articles

Cited by

References

    1. Bedigian D. Systematics and evolution in Sesamum L. (Pedaliaceae), part 1: evidence regarding the origin of sesame and its closest relatives. Webbia. 2015:1–42.
    1. Anilakumar KR, Pal A, Khanum F, Bawa AS. Nutritional, medicinal and industrial uses of sesame (Sesamum indicum L.) seeds - an overview. Agric Conspec Sci. 2010;75(4):159–168.
    1. Teboul N, Gadri Y, Berkovich Z, Reifen R, Peleg Z. Genetic architecture underpinning yield components and seed mineral-nutrients in sesame. Genes. 2020;11(10):1221. - PMC - PubMed
    1. Mushtaq A, Hanif MA, Ayub MA, Bhatti IA, Jilani MI. Sesame. Medicinal plants of South Asia. Elsevier. 2020; p. 601–15.
    1. Langham R. Phenology of sesame. New crop new uses. 2007; p.144-182.

LinkOut - more resources