. 2021 Nov 22;40(1):372.
doi: 10.1186/s13046-021-02147-7.

TMPRSS4 promotes cancer stem-like properties in prostate cancer cells through upregulation of SOX2 by SLUG and TWIST1

Affiliations

TMPRSS4 promotes cancer stem-like properties in prostate cancer cells through upregulation of SOX2 by SLUG and TWIST1

Yunhee Lee et al. J Exp Clin Cancer Res. .

Abstract

Background: Transmembrane serine protease 4 (TMPRSS4) is a cell surface-anchored serine protease. Elevated expression of TMPRSS4 correlates with poor prognosis in colorectal cancer, gastric cancer, prostate cancer, non-small cell lung cancer, and other cancers. Previously, we demonstrated that TMPRSS4 promotes invasion and proliferation of prostate cancer cells. Here, we investigated whether TMPRSS4 confers cancer stem-like properties to prostate cancer cells and characterized the underlying mechanisms.

Methods: Acquisition of cancer stem-like properties by TMPRSS4 was examined by monitoring anchorage-independent growth, tumorsphere formation, aldehyde dehydrogenase (ALDH) activation, and resistance to anoikis and drugs in vitro and in an early metastasis model in vivo. The underlying molecular mechanisms were evaluated, focusing on stemness-related factors regulated by epithelial-mesenchymal transition (EMT)-inducing transcription factors. Clinical expression and significance of TMPRSS4 and stemness-associated factors were explored by analyzing datasets from The Cancer Genome Atlas (TCGA).

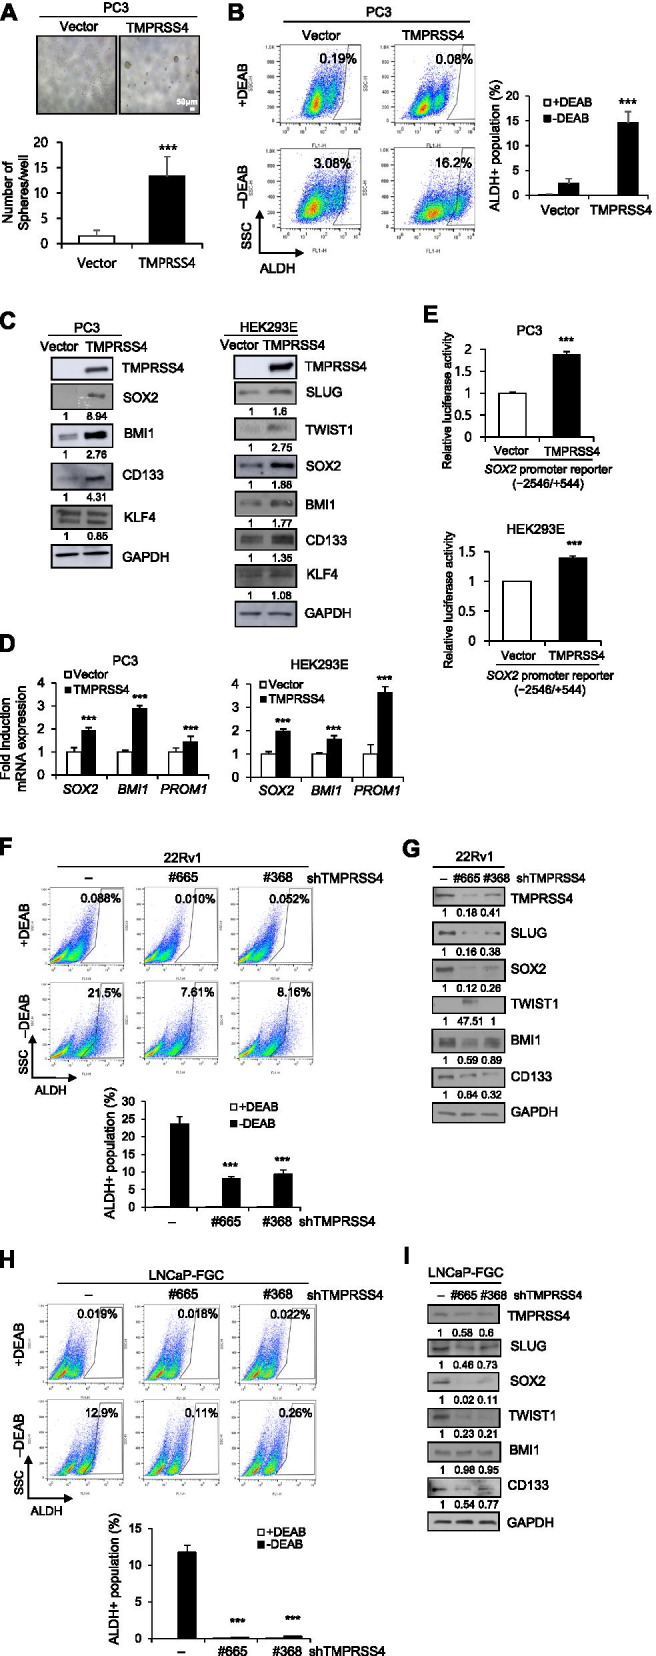
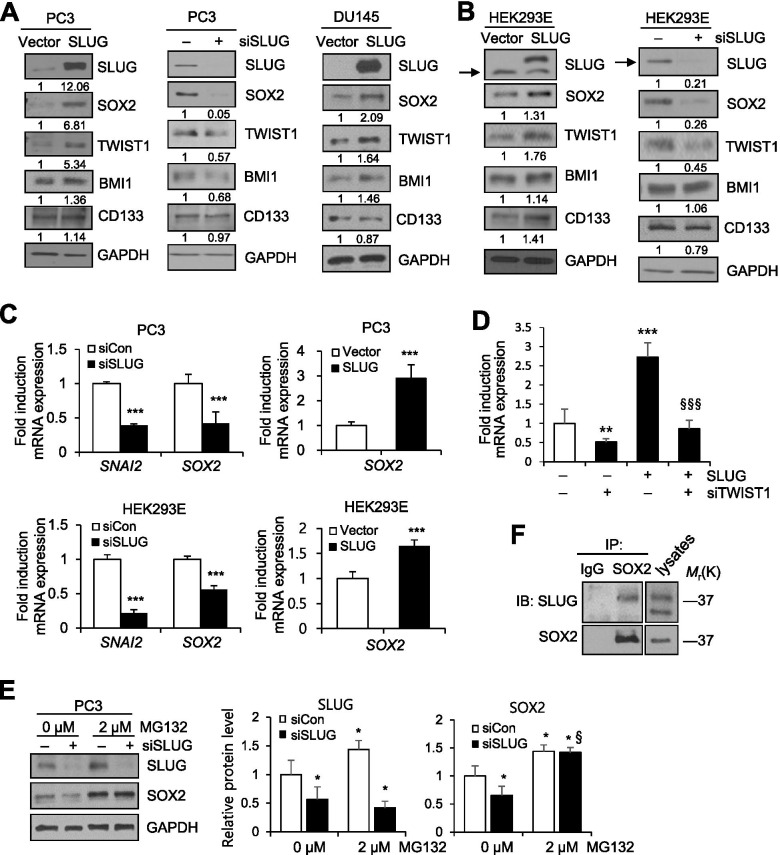
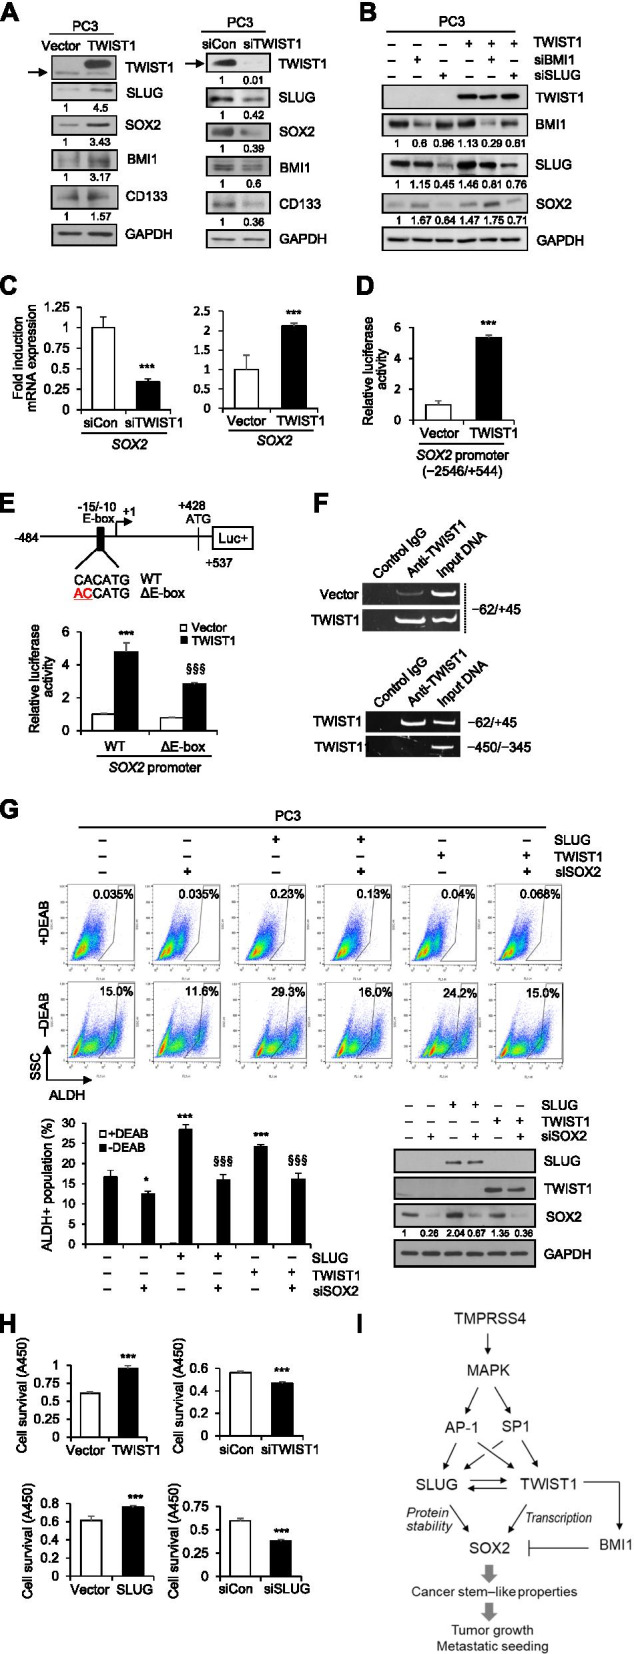
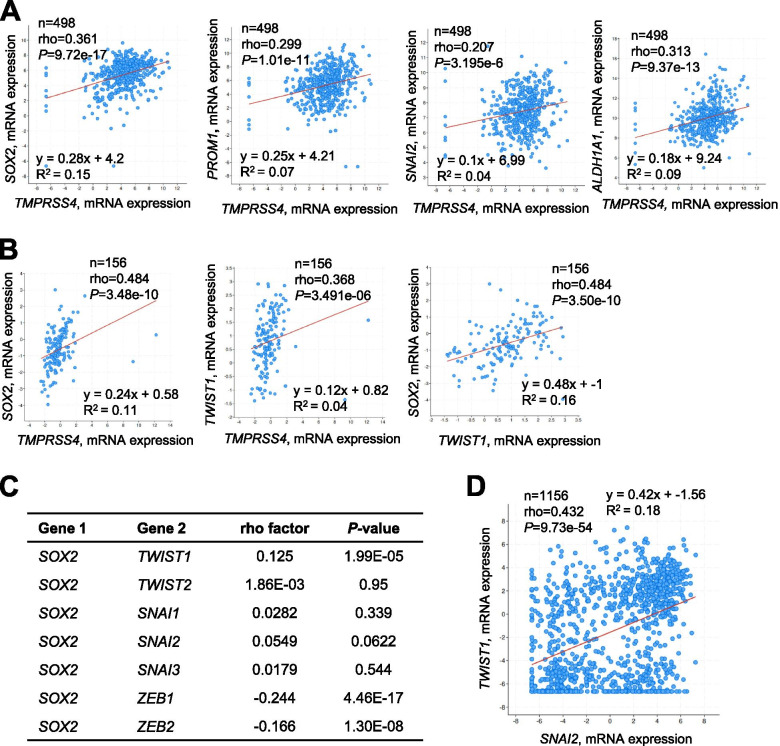
Results: TMPRSS4 promoted anchorage-independent growth, ALDH activation, tumorsphere formation, and therapeutic resistance of prostate cancer cells. In addition, TMPRSS4 promoted resistance to anoikis, thereby increasing survival of circulating tumor cells and promoting early metastasis. These features were accompanied by upregulation of stemness-related factors such as SOX2, BMI1, and CD133. SLUG and TWIST1, master EMT-inducing transcription factors, made essential contributions to TMPRSS4-mediated cancer stem cell (CSC) features through upregulation of SOX2. SLUG stabilized SOX2 via preventing proteasomal degradation through its interaction with SOX2, while TWIST1 upregulated transcription of SOX2 by interacting with the proximal E-box element in the SOX2 promoter. Clinical data showed that TMPRSS4 expression correlated with the levels of SOX2, PROM1, SNAI2, and TWIST1. Expression of SOX2 was positively correlated with that of TWIST1, but not with other EMT-inducing transcription factors, in various cancer cell lines.

Conclusions: Together, these findings suggest that TMPRSS4 promotes CSC features in prostate cancer through upregulation of the SLUG- and TWIST1-induced stem cell factor SOX2 beyond EMT. Thus, TMPRSS4/SLUG-TWIST1/SOX2 axis may represent a novel mechanism involved in the control of tumor progression.

Keywords: SLUG; SOX2; Stemness; TMPRSS4; TWIST1.


Conflict of interest statement

The authors declare that they have no competing interests.

Figures

Fig. 1
Fig. 1
TMPRSS4 promotes anchorage-independent growth of prostate cancer cells. A PC3 cells were stably transfected with TMPRSS4 expression vector or empty vector. Cells were seeded in 6-well plates at a density of 5 × 104 cells/well and incubated for 48 or 72 h. Cells were counted to measure proliferation. B Soft agar anchorage-independent growth assay. Transfected PC3 cells were seeded in triplicates in 6-well plates containing semi-solid agar at a density of 3 × 103 cells/well and allowed to grow for 14 days. Representative images are shown. Total colonies (> 0.1 mm) and colonies with diameter > 0.3 mm were counted. Bar, 500 μm. C Transfected PC3 cells were incubated for 48 h, and lysed for immunoblot analysis. Anti-myc antibody was used to detect myc-tagged TMPRSS4. Densitometric quantification was performed on the immunoblots using GAPDH as a loading control except that phospho-AKT was normalized against total AKT. The mean relative density from three independent experiments is shown under the immunoblots. D Cell adhesion assay. Transfected PC3 cells were plated onto fibronectin-coated plates for 20 or 60 min. The number of adherent cells was counted in five representative fields (× 200). Values represent mean ± standard deviation (SD). ***P < 0.001
Fig. 2
Fig. 2
TMPRSS4 promotes resistance to anoikis and drugs. A To induce anoikis, transfected PC3 cells were seeded in 96-well plates with an Ultra-Low Attachment Surface at a density of 1.5 × 104 cells/well and grown for up to 7 days. Cell viability was determined by colorimetric WST assay. B Transfected PC3 cells were incubated for 48 h with 0.5% bovine serum albumin under suspension culture conditions, and then stained with annexin V and PI for flow cytometry. The proportion of stained cells was determined to calculate the percentage of apoptotic cells. C Transfected PC3 cells (5 × 106 cells/mouse) were intravenously injected into nude mice (n = 4). Twenty-four hours after injection, lungs were removed to extract total DNA. Real-time qPCR analysis was performed on human PTGER2 with total DNA extracted from lungs. The amounts of human genomic DNA initially present in the qPCR reaction tube were extrapolated (Upper) from the standard curve generated by real-time qPCR performed on human total DNA extracted from PC3 parental cells mixed with mouse total DNA from lungs of nude mice (Lower). D Transfected PC3 cells were treated with anti-cancer drugs for 72 h. Cell viability was determined by colorimetric WST assay. DMSO (0.1%) was used as a vehicle. Values represent mean ± SD. *P < 0.05; ***P < 0.001
Fig. 3
Fig. 3
TMPRSS4 promotes tumorsphere formation and upregulates stemness-related factors. A Tumorsphere formation assay. Transfected PC3 cells were dissociated to single cells and seeded at a density of 200 cells/ml in 96-well plates under suspension culture conditions in the presence of 20 ng/ml EGF, 10 ng/ml bFGF, and 2% B27 supplement. The cells were incubated for 7 days. Spheroids with diameter > 75 μm were counted. Bar, 50 μm. B ALDH assay. Transfected PC3 cells were incubated with ALDH substrate for 30 min, and then analyzed using flow cytometry. Cells were quenched with DEAB, an ALDH inhibitor, as a negative control. C PC3 and HEK293E cells transfected with TMPRSS4 expression vector were lysed for immunoblot analysis. Anti-myc antibody was used to detect myc-tagged TMPRSS4. D Transfected cells were lysed and subjected to real-time qPCR analysis. E Cells were co-transfected with a TMPRSS4 expression vector and a SOX2 promoter (− 2546/+ 544) reporter construct in the pGL3 vector. Firefly luciferase activity, representing SOX2 promoter activity, was measured after 48 h and normalized against Renilla luciferase activity. F–I 22Rv1 and LNCaP clone FGC cells were transfected with TMPRSS4-specific shRNA vectors for 48 h. Transfected cells were subjected to ALDH assay (F, H) or lysed for immunoblot analysis (G, I). Densitometric quantification was performed on the immunoblots using GAPDH as a loading control. The mean relative density from three independent experiments is shown under the immunoblots (C, G, I). Values represent mean ± SD. ***P < 0.001
Fig. 4
Fig. 4
SLUG and TWIST1 are required for TMPRSS4-mediated ALDH activity and anoikis resistance. A–C PC3 cells were co-transfected with a TMPRSS4 expression vector and siRNA specific to SLUG or TWIST1 for 48 h. A Transfected cells were harvested and then subjected to ALDH assay. B Transfected cells were incubated under suspension culture conditions and then cell viability was determined by colorimetric WST assay. C Transfected cells were lysed for immunoblot analysis. D, E PC3 cells were co-transfected with TMPRSS4 expression vector and siRNA specific to BMI1 or SOX2 for 48 h. Transfected cells were subjected to ALDH assay (D) or lysed for immunoblot analysis (E). Anti-myc antibody was used to detect myc-tagged TMPRSS4. Densitometric quantification was performed on the immunoblots using GAPDH as a loading control. The mean relative density from three independent experiments is shown under the immunoblots (C, E). Values represent mean ± SD. *P < 0.05; **P < 0.01; ***P < 0.001 compared with vector + control siRNA; §§P < 0.01; §§§P < 0.001 compared with TMPRSS4 + control siRNA
Fig. 5
Fig. 5
SLUG stabilizes SOX2, leading to ALDH activation and anoikis resistance. A, B Cells were transfected with SLUG expression vector or siRNA specific to SLUG for 48 h, and then whole-cell lysates were prepared for immunoblot analysis. Anti-myc antibody was used to detect myc-tagged SLUG (A right). Arrow indicates endogenous SLUG (B). C Cells were transfected for 48 h with a SLUG expression vector or siRNA specific to SLUG, and then lysed for real-time qPCR analysis. Values represent mean ± SD. ***P < 0.001. D PC3 cells were co-transfected with SLUG expression vector and siRNA specific to TWIST1 for 48 h, and then lysed for real-time qPCR analysis of SOX2 expression. Values represent mean ± SD. **P < 0.01; ***P < 0.001 compared with siControl + Vector; §§§P < 0.001 compared with siControl + SLUG. E PC3 cells were transfected with siRNA for 42 h and then treated with MG132 or vehicle control (0.1% DMSO) for 6 h before lysates preparation for immunoblot analysis. Values represent mean ± SD. *P < 0.05 compared with siControl + DMSO; §P < 0.05 compared with siSLUG + DMSO. Densitometric quantification was performed on the immunoblot using GAPDH as a loading control. The mean relative density from three independent experiments is shown (A, B, E). F Co-immunoprecipitation analysis of the interaction of SLUG with SOX2 in HEK293E cells transfected with SLUG
Fig. 6
Fig. 6
TWIST1 upregulates SOX2 transcription through the E-box element, contributing to stemness. A PC3 cells were transfected for 48 h with TWIST1 expression vector or siRNA specific to TWIST1, and then lysed for immunoblot analysis. Arrow indicates endogenous TWIST1. B PC3 cells were co-transfected for 48 h with TWIST1 expression vector and siRNA specific to TWIST1 or BMI1, and then lysed for immunoblot analysis. Anti-flag antibody was used to detect flag-tagged TWIST1. C Cells were transfected for 48 h with siRNA specific to TWIST1 or TWIST1-expression vector and then lysed for real-time qPCR analysis. D PC3 cells were co-transfected with a TWIST1 expression vector and a SOX2 promoter (− 2546/+ 544) reporter construct in the pGL3 vector. Values represent mean ± SD. ***P < 0.001. E An E-box site mutant reporter construct was generated from the SOX2 promoter (− 484/+ 537) reporter construct in the pGL3 vector and used in reporter assay. Values represent mean ± SD. ***P < 0.001 compared with vector + WT; §§§P < 0.001 compared with TWIST1 + WT. F ChIP analysis of the interaction of TWIST1 with the SOX2 promoter. Upper, Chromatin fragments from PC3 cells transfected for 48 h with a TWIST1 expression vector or an empty vector were immunoprecipitated with control mouse IgG or anti-TWIST1 and analyzed by PCR using primers specific for the SOX2 promoter (− 62/+ 45). Lower, ChIP assay using PC3 cells transfected with TMPRSS4 expression vector for 48 h. An irrelevant region (− 450/− 345) was analyzed in parallel. The input control (1%) is in lane 3. G PC3 cells were transfected with a SLUG or TWIST1 expression vector and siRNA specific to SOX2 for 48 h and then subjected to ALDH assay and immunoblot analysis. Anti-flag antibody was used to detect flag-tagged TWIST1. Values represent mean ± SD. *P < 0.05; ***P < 0.001 compared with vector + control siRNA; §§§P < 0.001 compared with SLUG or TWIST1 + control siRNA. Densitometric quantification was performed on the immunoblot using GAPDH as a loading control. The mean relative density from three independent experiments is shown under the immunoblots (A, B, G). H PC3 cells were transfected with a SLUG or TWIST1 expression vector or siRNA specific to SLUG or TWIST1 for 48 h. Transfected cells were incubated under suspension culture conditions. Cell viability was determined by colorimetric WST assay. Values represent mean ± SD. ***P < 0.001. I A schematic representation illustrating the pathways underlying TMPRSS4-induced cancer stem–like properties in human cancer cells. We previously reported that TMPRSS4 activates the transcription factors AP-1 and SP1 in a manner dependent on MAPKs including JNK and ERK1/2 [26]. Our previous [22] and present studies show that TMPRSS4 upregulates SLUG and TWIST1 in an AP-1- and SP1-dependent manner. This study demonstrates that TMPRSS4 upregulates SOX2 at the transcriptional and protein stability levels through TWIST1 and SLUG, respectively, leading to acquisition of cancer stem–like features, including ALDH activation, thereby contributing to tumor growth and metastatic seeding. Of note, expression levels of SLUG and TWIST1 are interdependent. BMI1 suppression enhances SOX2 expression, indicating that BMI1 negatively regulates SOX2 expression in our system
Fig. 7
Fig. 7
Clinical significance of TMPRSS4, SNAI2, TWIST1, and SOX2 expression in prostate cancer patients. A Scatter plots of TMPRSS4 mRNA expression (x-axis) vs. SOX2, PROM1 (CD133), SNAI2, or ALDH1A1 mRNA expression (y-axis) from prostate adenocarcinoma data (TCGA, Firehose Legacy). B Scatter plots of TMPRSS4 mRNA expression (x-axis) vs. SOX2 or TWIST1 mRNA expression (y-axis) from prostate adenocarcinoma data (MSKCC, Cancer Cell 2010). A scatter plot of TWIST1 mRNA expression (x-axis) vs. SOX2 mRNA expression (y-axis) is also shown. C Correlation analysis between expression levels of SOX2 and several EMT-inducing transcription factors (n = 1156) from CCLE data (Broad, 2019). D A scatter plot of SNAI2 mRNA expression (x-axis) vs. TWIST1 mRNA expression (y-axis) from CCLE data (Broad, 2019). Correlations were statistically analyzed using the Spearman test. Equations were automatically generated using the cBioPortal webpage tool

Similar articles

Cited by

References

    1. Chaffer CL, Weinberg RA. A perspective on cancer cell metastasis. Science. 2011;331(6024):1559–1564. - PubMed
    1. Lambert AW, Pattabiraman DR, Weinberg RA. Emerging biological principles of metastasis. Cell. 2017;168(4):670–691. - PMC - PubMed
    1. Thiery JP, Acloque H, Huang RY, Nieto MA. Epithelial-mesenchymal transitions in development and disease. Cell. 2009;139(5):871–890. - PubMed
    1. Sanchez-Tillo E, Liu Y, de Barrios O, Siles L, Fanlo L, Cuatrecasas M, et al. EMT-activating transcription factors in cancer: beyond EMT and tumor invasiveness. Cell Mol Life Sci. 2012;69(20):3429–3456. - PMC - PubMed
    1. Peinado H, Olmeda D, Cano A. Snail, Zeb and bHLH factors in tumour progression: an alliance against the epithelial phenotype? Nat Rev Cancer. 2007;7(6):415–428. - PubMed