

Transcriptional landscape of highly lignified poplar stems at single-cell resolution
- PMID: 34809675
- PMCID: PMC8607660
- DOI: 10.1186/s13059-021-02537-2
Transcriptional landscape of highly lignified poplar stems at single-cell resolution
Abstract
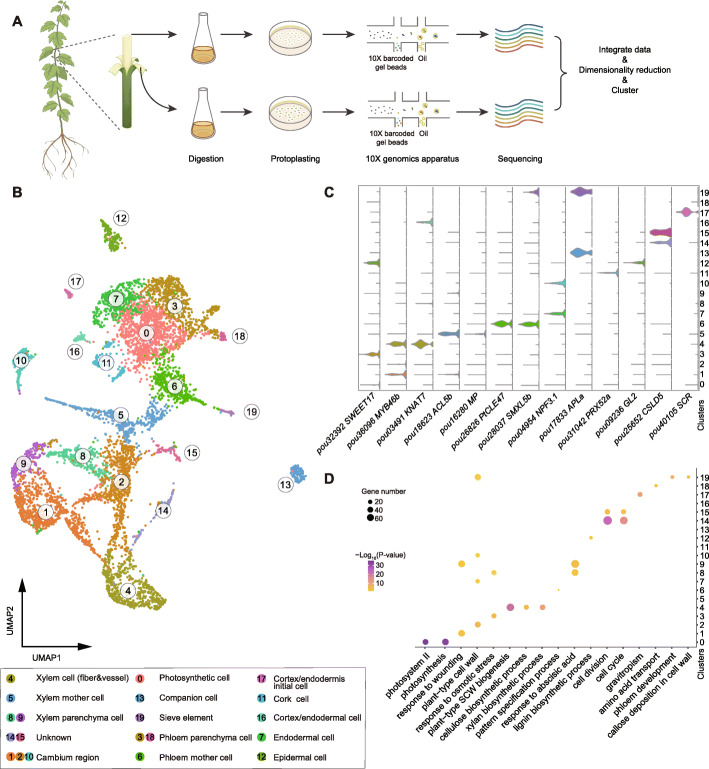
Background: Plant secondary growth depends on the activity of the vascular cambium, which produces xylem and phloem. Wood derived from xylem is the most abundant form of biomass globally and has played key socio-economic and subsistence roles throughout human history. However, despite intensive study of vascular development, the full diversity of cell types and the gene networks engaged are still poorly understood.
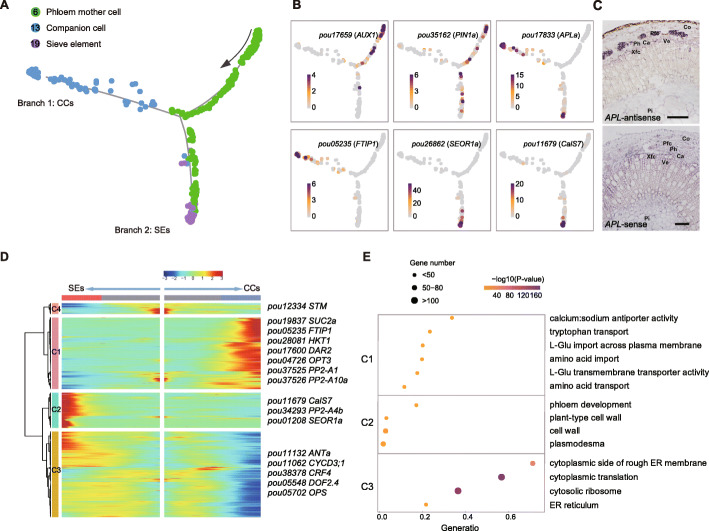
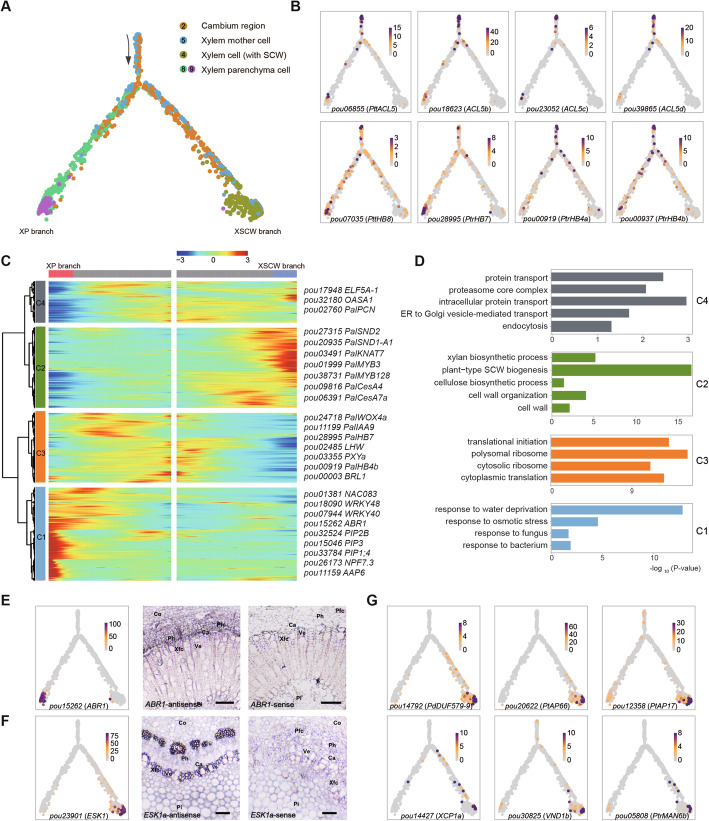
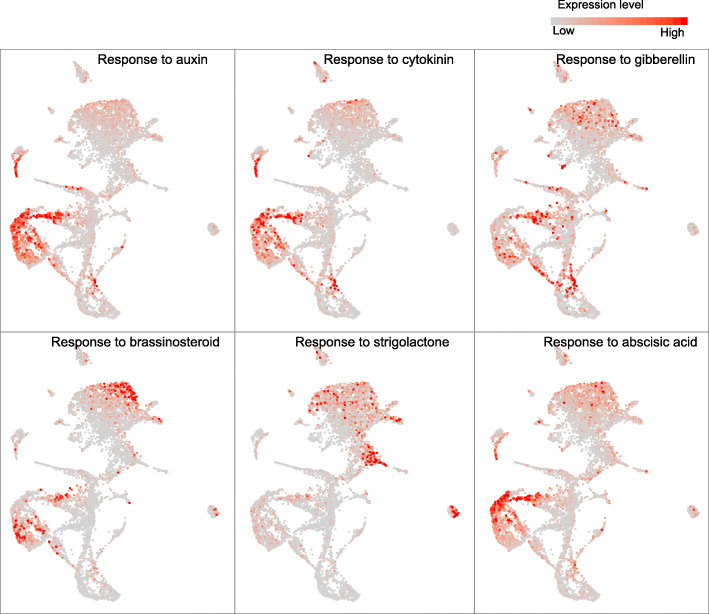
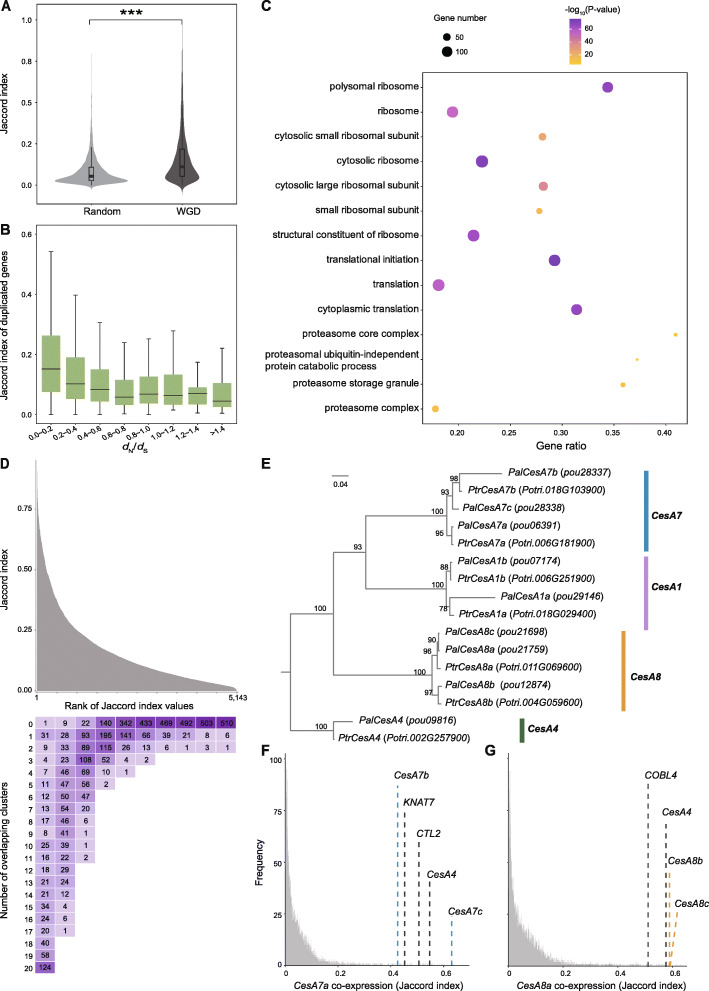
Results: Here, we have applied an optimized protoplast isolation protocol and RNA sequencing to characterize the high-resolution single-cell transcriptional landscape of highly lignified poplar stems. We identify 20 putative cell clusters with a series of novel cluster-specific marker genes and find that these cells are highly heterogeneous based on the transcriptome. Analysis of these marker genes' expression dynamics enables reconstruction of the cell differentiation trajectories involved in phloem and xylem development. We find that different cell clusters exhibit distinct patterns of phytohormone responses and emphasize the use of our data to predict potential gene redundancy and identify candidate genes related to vascular development in trees.
Conclusions: These findings establish the transcriptional landscape of major cell types of poplar stems at single-cell resolution and provide a valuable resource for investigating basic principles of vascular cell specification and differentiation in trees.
© 2021. The Author(s).
Conflict of interest statement
The authors declare that they have no competing interests.
Figures
Comment in
-
Merit of integrating in situ transcriptomics and anatomical information for cell annotation and lineage construction in single-cell analyses of Populus.Genome Biol. 2024 Apr 3;25(1):85. doi: 10.1186/s13059-024-03227-5. Genome Biol. 2024. PMID: 38570851 Free PMC article.
Similar articles
-
WUSCHEL-RELATED HOMEOBOX genes are crucial for normal vascular organization and wood formation in poplar.Plant Sci. 2024 Sep;346:112138. doi: 10.1016/j.plantsci.2024.112138. Epub 2024 May 31. Plant Sci. 2024. PMID: 38825043
-
Wood Transcriptome Profiling Identifies Critical Pathway Genes of Secondary Wall Biosynthesis and Novel Regulators for Vascular Cambium Development in Populus.Genes (Basel). 2019 Sep 7;10(9):690. doi: 10.3390/genes10090690. Genes (Basel). 2019. PMID: 31500311 Free PMC article.
-
PHOTOPERIOD RESPONSE 1 (PHOR1)-like genes regulate shoot/root growth, starch accumulation, and wood formation in Populus.J Exp Bot. 2012 Sep;63(15):5623-34. doi: 10.1093/jxb/ers217. Epub 2012 Aug 21. J Exp Bot. 2012. PMID: 22915748 Free PMC article.
-
Genetic and hormonal regulation of cambial development.Physiol Plant. 2013 Jan;147(1):36-45. doi: 10.1111/j.1399-3054.2012.01627.x. Epub 2012 May 3. Physiol Plant. 2013. PMID: 22551327 Review.
-
Genetic Networks in Plant Vascular Development.Annu Rev Genet. 2017 Nov 27;51:335-359. doi: 10.1146/annurev-genet-120116-024525. Epub 2017 Sep 11. Annu Rev Genet. 2017. PMID: 28892639 Review.
Cited by
-
Single-cell transcriptome atlas reveals spatiotemporal developmental trajectories in the basal roots of moso bamboo (Phyllostachys edulis).Hortic Res. 2023 Jun 9;10(8):uhad122. doi: 10.1093/hr/uhad122. eCollection 2023 Aug. Hortic Res. 2023. PMID: 37554343 Free PMC article.
-
Expression of dehydroshikimate dehydratase in poplar induces transcriptional and metabolic changes in the phenylpropanoid pathway.J Exp Bot. 2024 Aug 28;75(16):4960-4977. doi: 10.1093/jxb/erae251. J Exp Bot. 2024. PMID: 38809816 Free PMC article.
-
Single-nuclei transcriptome analysis of the shoot apex vascular system differentiation in Populus.Development. 2022 Nov 1;149(21):dev200632. doi: 10.1242/dev.200632. Epub 2022 Oct 17. Development. 2022. PMID: 36178121 Free PMC article.
-
Investigating biological nitrogen fixation via single-cell transcriptomics.J Exp Bot. 2025 Feb 25;76(4):931-949. doi: 10.1093/jxb/erae454. J Exp Bot. 2025. PMID: 39563004 Free PMC article. Review.
-
Advances in Single-Cell Transcriptome Sequencing and Spatial Transcriptome Sequencing in Plants.Plants (Basel). 2024 Jun 18;13(12):1679. doi: 10.3390/plants13121679. Plants (Basel). 2024. PMID: 38931111 Free PMC article. Review.
References
Publication types
MeSH terms
Substances
LinkOut - more resources
Full Text Sources
