. 2021 Nov 19;11(1):26.
doi: 10.1186/s13395-021-00281-6.

Six1 promotes skeletal muscle thyroid hormone response through regulation of the MCT10 transporter

Affiliations

Six1 promotes skeletal muscle thyroid hormone response through regulation of the MCT10 transporter

John Girgis et al. Skelet Muscle. .

Abstract

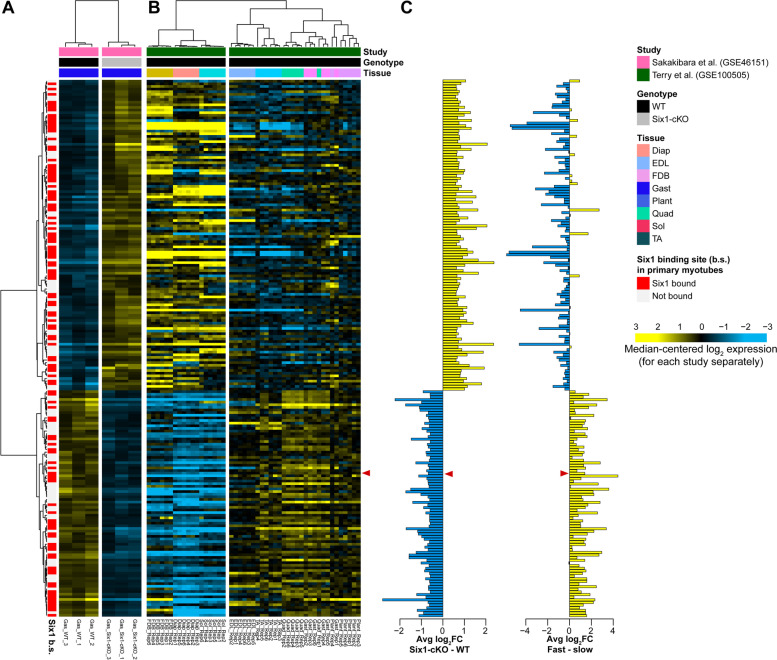
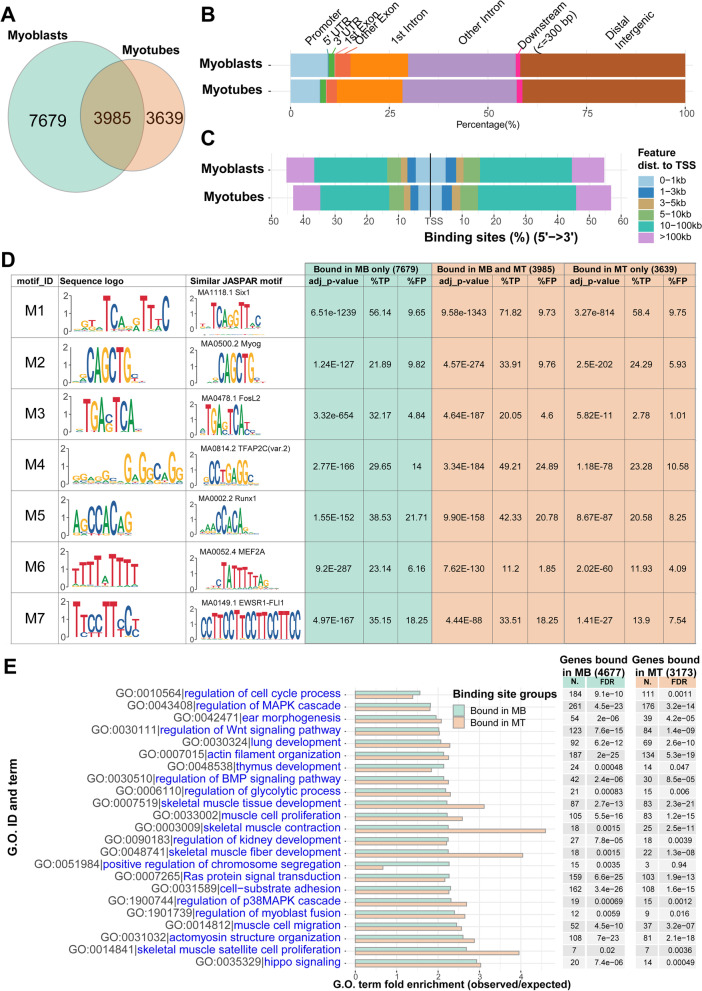
Background: The Six1 transcription factor is implicated in controlling the development of several tissue types, notably skeletal muscle. Six1 also contributes to muscle metabolism and its activity is associated with the fast-twitch, glycolytic phenotype. Six1 regulates the expression of certain genes of the fast muscle program by directly stimulating their transcription or indirectly acting through a long non-coding RNA. We hypothesized that additional mechanisms of action of Six1 might be at play.

Methods: A combined analysis of gene expression profiling and genome-wide location analysis data was performed. Results were validated using in vivo RNA interference loss-of-function assays followed by measurement of gene expression by RT-PCR and transcriptional reporter assays.

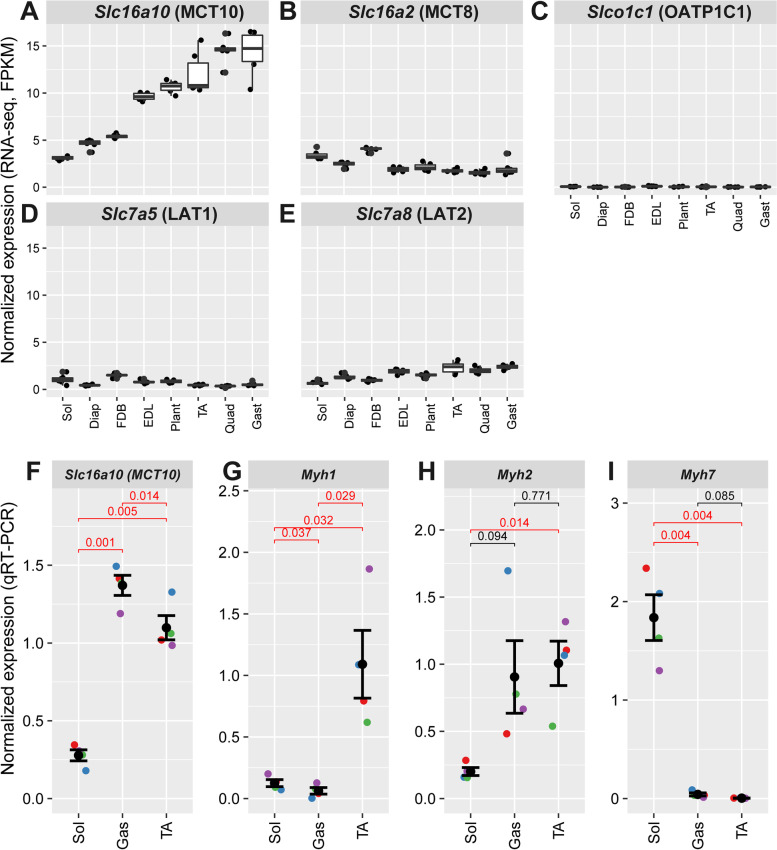
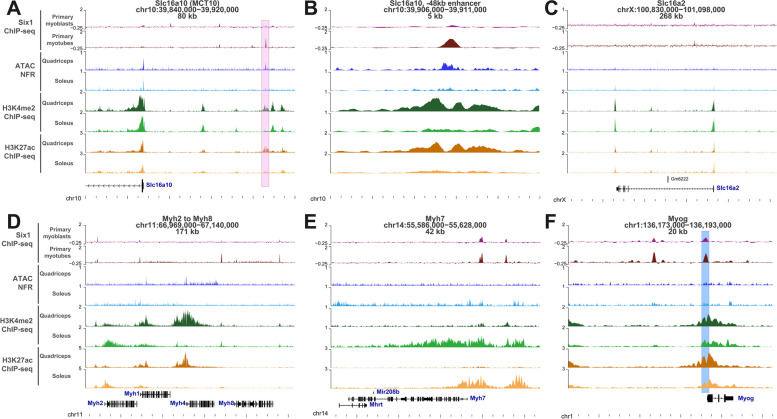
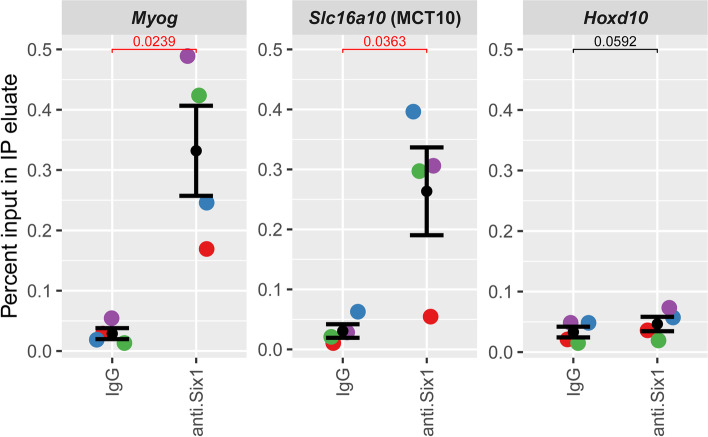
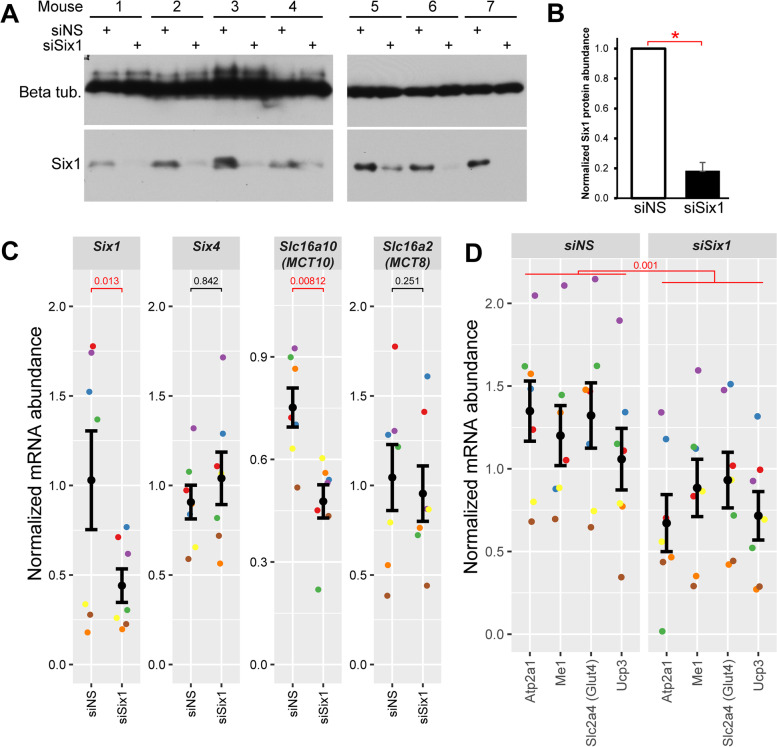
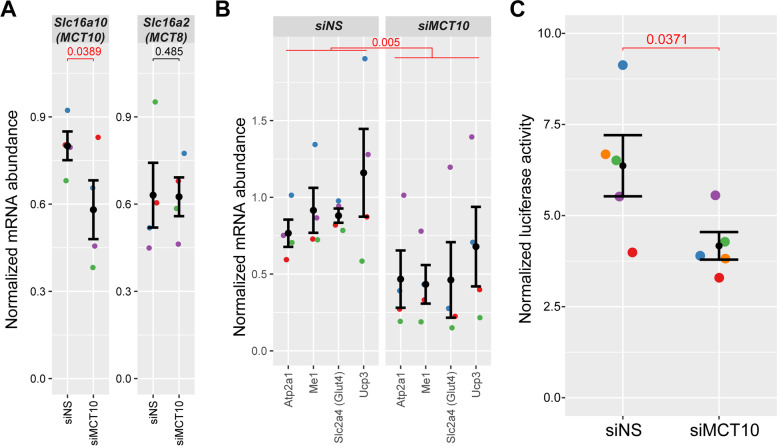
Results: The Slc16a10 gene, encoding the thyroid hormone transmembrane transporter MCT10, was identified as a gene with a transcriptional enhancer directly bound by Six1 and requiring Six1 activity for full expression in adult mouse tibialis anterior, a predominantly fast-twitch muscle. Of the various thyroid hormone transporters, MCT10 mRNA was found to be the most abundant in skeletal muscle, and to have a stronger expression in fast-twitch compared to slow-twitch muscle groups. Loss-of-function of MCT10 in the tibialis anterior recapitulated the effect of Six1 on the expression of fast-twitch muscle genes and led to lower activity of a thyroid hormone receptor-dependent reporter gene.

Conclusions: These results shed light on the molecular mechanisms controlling the tissue expression profile of MCT10 and identify modulation of the thyroid hormone signaling pathway as an additional mechanism by which Six1 influences skeletal muscle metabolism.


Conflict of interest statement

The authors declare that they have no competing interests.

Figures

Fig. 1
Fig. 1
Skeletal muscle group distribution and Six1 dependence of gene expression. DNA microarray gene expression profiling from Sakakibara et al. was analyzed to identify differentially expressed genes in the gastrocnemius muscles of wild-type versus Six1-cKO mice. The cut-offs used were abs (log2FC) > 0.58 and Benjamini-Hochberg adjusted p value < 0.05. Genes were annotated based on whether their transcription start sites are within 50 kb of a Six1-binding site in primary myotubes (red bars). Pearson correlation hierarchical clustering was applied to rows (genes) and columns (samples). To further annotate these Six1-dependent genes, their expression from RNA-seq performed in several muscle tissue groups from the muscleDB database (Terry et al.) was also plotted. The rows retained the clustering solution order from the Sakakibara study, and columns were independently clustered by Pearson correlation (clustering performed separately from the Sakakibara data). The log2 fold changes of each gene in the two experiments are shown in the vertical histograms, blue and yellow bars indicating negative and positive values, respectively. A red arrowhead indicates where the Slc16a10 gene appears in these graphs. The gene symbols in this figure are also listed in supplementary Table S7
Fig. 2
Fig. 2
Discovery and analysis of Six1-binding sites in primary myoblasts and myotubes. A Venn diagram showing the overlap between Six1-binding peaks in MB and MT. B Proportion of Six1-binding sites, in MB or MT, that overlap various gene features. In this analysis, promoters are defined as the 2 kb region centered at the transcription start site of genes, and the downstream region is defined as the 300 base pairs immediately following the transcription end sites. C Distribution of Six1-binding sites around transcription start sites of genes, in MB and MT. D Results from de novo motif finding using MEME. Redundant motifs and those with lower MEME scores were removed. For each new motif, the most similar motif from the JASPAR database is shown. The enrichment of each motif, in the indicated set of binding site sequences, was calculated. %TP and %FP represent the true positive and false positive percentages, respectively. The Bonferroni-adjusted p value is given under “adj_p-value.” E Biological process GO term enrichment among genes bound by Six1 (all genes within 50 kb of a site bound in MB or bound in MT). Selected terms are shown. N, number of Six1-bound genes with a given annotation; FDR, false discovery rate. The total number of genes assigned to the Six1 peaks is indicated at the top of the respective columns
Fig. 3
Fig. 3
Expression of thyroid hormone transporter-coding genes in select murine skeletal muscle groups. RNA-seq expression data from muscleDB were quantitated and normalized by fragments per kilobase of transcript per million mapped reads (FPKM). The expression of the five transporters is shown: A Slc16a10 (MCT10), B Slc16a2 (MCT8), C Slco1c1 (Oatp1c1), D Slc7a5 (Lat1), and E Slc7a8 (Lat2). Each of six replicates is represented by a dot and the statistical distribution of FPKM values is represented by the boxplot. F qRT-PCR validation of Slc16a10 expression in soleus (Sol), gastrocnemius (Gas), and tibialis anterior (TA) muscles. Expression was normalized over the geometric mean of control genes Actnb and 18S rRNA. Expression in soleus and tibialis anterior is lower than in gastrocnemius, by paired, two-tailed t test (p value < 0.05 shown in red). G-I The expression profiles of Myh1, Myh2, and Myh7 are shown for comparison
Fig. 4
Fig. 4
Six1-binding profile and epigenetic marks at the genes coding the two main thyroid hormone transporters. At each locus, the gene name, genomic position (mm9 coordinates), and length of the interval shown are given. The Six1 ChIP-seq signal represents data from primary proliferating myoblasts or differentiated myotubes, quantitated in sliding windows across the genome in reads per million sequenced, and subtracted from the signal in input chromatin control sample. The ATAC-seq data in quadriceps and soleus is shown for inferred nucleosome-free regions (insert sites between 10 and 130 base pairs) and quantitated in bins of 10 base pairs in counts per millions sequenced (CPM). The H3K4me2, indicative of enhancers and promoters, and H3K27ac, indicative of active promoters and enhancers, are quantitated in bins of 10 and CPM. A Signal at the Slc16a10 (MCT10) locus. The pink box upstream of the Slc16a10 start site shows the location of a putative Six1-bound enhancer, active predominantly in fast-twitch quadriceps, compared to slow-twitch soleus. B Magnification of the −48 kb enhancer at the Slc16a10 locus. C Signal at the Slc16a2 locus. D Genomic signal at the locus comprising the Myh2 to Myh8 genes. E Genomic signal at the Myh7 locus. F Signal at the Myogenin gene. The blue box represents the area amplified by PCR, in Fig. 5
Fig. 5
Fig. 5
Confirmation of Six1 binding at the Slc16a10 enhancer. Chromatin from hindlimb muscles of four mice was harvested, was fixed, and ChIP was carried out using either anti-Six1 antibody or normal rabbit IgG. Results represent qPCR quantification of IP enrichment (expressed as percentage of input DNA) at the 48 kb binding site upstream of the Slc16a10/MCT10 locus (region corresponding to the pink box in Fig. 4A). Enrichment at the Myog proximal promoter is shown as positive control (region corresponding to the blue box in Fig. 4F) while lack of enrichment at the Hoxd10 proximal promoter is shown as specificity control. Results from each biological replicate are represented by different colors. Two-tailed paired T test were conducted to compare enrichment with IgG and with anti-Six1. One-tailed paired T tests also indicate that the degree of enrichment with anti-Six1 is significantly higher (p < 0.05) at the Myog and Slc16a10 loci compared to the Hoxd10 locus
Fig. 6
Fig. 6
Six1 is needed for MCT10 expression and activity of the TH pathway. A Western blots assaying Six1 protein expression levels under siRNA knockdown condition. siNS represents a control, non-silencing RNA duplex. Note that animals 1 to 4 and 5 to 7 were processed on different days and the western blots were done on different gels and membranes. B Densitometric quantitation of Six1 abundance shown in panel A. Error bars indicate the SEM. The difference in Six1 protein abundance is statistically significant by a one-tailed paired T test relative to siNS (*p value < 0.05). The experiment was performed with seven mice treated identically. C mRNA expression levels of Six1 and MCT10 in electroporated mouse TA muscle after Six1 knockdown, quantified by qRT-PCR. Six4 and MCT8 are shown as members of the same gene families with invariant expression in this experiment. mRNA levels were normalized to the geometric mean of those of 18S rRNA and Actnb. Data represent an average of 7 biological replicates (animals). The normalized expression data is given, with each individual replicate (mouse) shown in a distinct color. Error bars indicate the mean ± SEM of the replicates. P values in red indicate statistically significant decreases in levels of expression as determined by a one-tailed paired Student’s T test relative to siNS (p value < 0.05). D mRNA expression level of a panel of four TH pathway target genes in the control and Six1 knockdown samples from panel C. Two-way ANOVA (testing mRNA levels as a function of which gene was tested and which siRNA was received) indicates significant reduction of the TH signaling gene panel with Six1 knockdown (p value = 0.001)
Fig. 7
Fig. 7
Six1 function is correlated with that of the TH receptor alpha. Gene set enrichment analysis performed on the gene expression profiling of wild-type or Six1-cKO skeletal muscle (Sakakibara et al.), using two custom sets representing genes that are significantly less or more expressed in Thra knock-out skeletal muscle treated with T3 compared to wild-type T3-treated muscle (from Nicolaisen et al.). A Enrichment score graph showing that when genes are ranked from the most downregulated in Six1-cKO to the most upregulated, the beginning of the list is enriched in genes that are more expressed in T3-treated wild-type muscle compared to Thra-cKO muscle. B Heat map of the genes that contribute the most to the enrichment shown in panel A (“core enrichment” genes). The gene order from top to bottom in the heatmap follows the order from left to right in panel A. C and D Similar analyses as in A and B but for the set representing genes that are more expressed in Thra-cKO compared to WT. The gene symbols shown in panels B and D are listed in supplementary files Code_S3 and Code_S4
Fig. 8
Fig. 8
Recapitulation of TH pathway effects with MCT10 knock-down. A Gene expression in TA muscles electroporated with siRNA against MCT10 or a non-silencing RNA duplex. Expression levels of MCT10, targeted by the siRNA employed, and those of the related gene MCT8 and Six1 are shown. mRNA levels are normalized to the geometric mean of 18S and Actnb. Data were obtained from 4 biological replicates (animals). Error bars indicate the mean ± SEM of the replicates. P values in red indicate statistically significant changes in levels of expression as determined by one-tailed paired Student’s T tests relative to siNS (p value < 0.05). B mRNA expression level of a panel of four TH pathway target genes in the control and MCT10 knockdown samples from panel A. Two-way ANOVA (testing mRNA levels as a function of which gene was tested and which siRNA was received) indicates significant reduction of the TH signaling gene panel with MCT10 knockdown (p value = 0.005). C MCT10 knock-down leads to a decrease in TH-dependent gene transcription. Relative TRE-dependent luciferase activity in TA muscle electroporated with siRNA targeting MCT10. N = 5 biological replicates. The decrease in reporter gene expression is significant as determined by paired one-tailed T test, compared to non-silencing control (siNS)

Similar articles

Cited by

References

    1. Kawakami K, Ohto H, Takizawa T, Saito T. Identification and expression of six family genes in mouse retina. FEBS Lett. 1996;393(2–3):259–263. - PubMed
    1. Kawakami K, Sato S, Ozaki H, Ikeda K. Six family genes–structure and function as transcription factors and their roles in development. BioEssays News Rev Mol Cell Dev Biol. 2000;22(7):616–626. - PubMed
    1. Serikaku MA, O’Tousa JE. sine oculis is a homeobox gene required for Drosophila visual system development. Genetics. 1994;138(4):1137–1150. - PMC - PubMed
    1. Pineda D, Gonzalez J, Callaerts P, Ikeo K, Gehring WJ, Salo E. Searching for the prototypic eye genetic network: sine oculis is essential for eye regeneration in planarians. Proc Natl Acad Sci. 2000;97(9):4525–4529. - PMC - PubMed
    1. Bebenek IG, Gates RD, Morris J, Hartenstein V, Jacobs DK. sine oculis in basal Metazoa. Dev Genes Evol. 2004;214(7):342–351. - PubMed

Publication types

Grants and funding