

Trib1 deficiency causes brown adipose respiratory chain depletion and mitochondrial disorder
- PMID: 34811364
- PMCID: PMC8608845
- DOI: 10.1038/s41419-021-04389-x
Trib1 deficiency causes brown adipose respiratory chain depletion and mitochondrial disorder
Erratum in
-
Author Correction: Trib1 deficiency causes brown adipose respiratory chain depletion and mitochondrial disorder.Cell Death Dis. 2024 Oct 14;15(10):747. doi: 10.1038/s41419-024-07066-x. Cell Death Dis. 2024. PMID: 39402019 Free PMC article. No abstract available.
Abstract
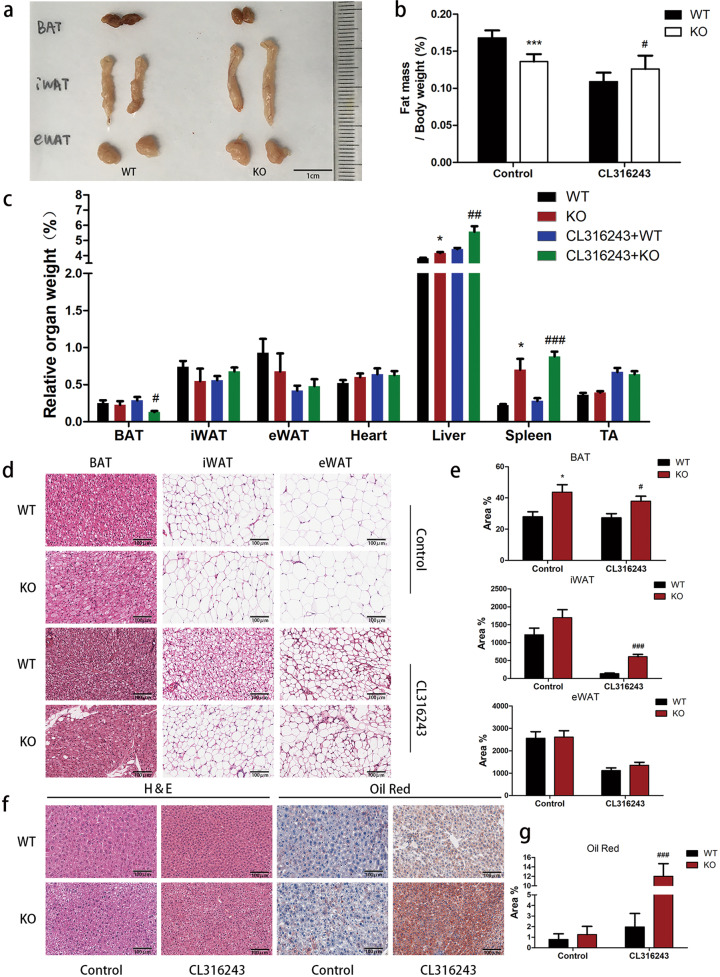
Tribbles homolog 1 (TRIB1) belongs to the Tribbles family of pseudokinases, which plays a key role in tumorigenesis and inflammation. Although genome-wide analysis shows that TRIB1 expression is highly correlated with blood lipid levels, the relationship between TRIB1 and adipose tissue metabolism remains unclear. Accordingly, the aim of the present study was to explore the role of TRIB1 on mitochondrial function in the brown adipose tissue (BAT). Trib1-knockout mice were established using clustered regularly interspaced short palindromic repeats (CRISPR)/Cas9 technology. The metabolic function of the BAT was induced by a β3-adrenoceptor agonist and the energy metabolism function of mitochondria in the BAT of mice was evaluated. Trib1-knockout mice exhibited obesity and impaired BAT thermogenesis. In particular, Trib1 knockout reduced the ability of the BAT to maintain body temperature, inhibited β3-adrenoceptor agonist-induced thermogenesis, and accelerated lipid accumulation in the liver and adipose tissues. In addition, Trib1 knockout reduced mitochondrial respiratory chain complex III activity, produced an imbalance between mitochondrial fusion and fission, caused mitochondrial structural damage and dysfunction, and affected heat production and lipid metabolism in the BAT. Conversely, overexpression of Trib1 in 3T3-L1 adipocytes increased the number of mitochondria and improved respiratory function. These findings support the role of Trib1 in regulating the mitochondrial respiratory chain and mitochondrial dynamics by affecting mitochondrial function and thermogenesis in the BAT.
© 2021. The Author(s).
Conflict of interest statement
The authors declare no competing interests.
Figures


Similar articles
-
Thyroid hormone (T3) stimulates brown adipose tissue activation via mitochondrial biogenesis and MTOR-mediated mitophagy.Autophagy. 2019 Jan;15(1):131-150. doi: 10.1080/15548627.2018.1511263. Epub 2018 Sep 13. Autophagy. 2019. PMID: 30209975 Free PMC article.
-
Proteome Imbalance of Mitochondrial Electron Transport Chain in Brown Adipocytes Leads to Metabolic Benefits.Cell Metab. 2018 Mar 6;27(3):616-629.e4. doi: 10.1016/j.cmet.2018.01.018. Cell Metab. 2018. PMID: 29514069 Free PMC article.
-
Adipocyte MTERF4 regulates non-shivering adaptive thermogenesis and sympathetic-dependent glucose homeostasis.Biochim Biophys Acta Mol Basis Dis. 2019 Jun 1;1865(6):1298-1312. doi: 10.1016/j.bbadis.2019.01.025. Epub 2019 Jan 26. Biochim Biophys Acta Mol Basis Dis. 2019. PMID: 30690068
-
Quantification of UCP1 function in human brown adipose tissue.Adipocyte. 2017 Apr 3;6(2):167-174. doi: 10.1080/21623945.2017.1319535. Epub 2017 Apr 14. Adipocyte. 2017. PMID: 28453364 Free PMC article. Review.
-
TRIB1: a multifaceted regulator of cardiometabolic health.Am J Physiol Cell Physiol. 2025 Jun 1;328(6):C1973-C1981. doi: 10.1152/ajpcell.00231.2025. Epub 2025 May 7. Am J Physiol Cell Physiol. 2025. PMID: 40331689 Review.
Cited by
-
Diet-induced obesity and aging-induced upregulation of Trib3 interfere with energy homeostasis by downregulating the thermogenic capacity of BAT.Exp Mol Med. 2024 Dec;56(12):2690-2702. doi: 10.1038/s12276-024-01361-5. Epub 2024 Dec 2. Exp Mol Med. 2024. PMID: 39623091 Free PMC article.
-
"Oh, Dear We Are in Tribble": An Overview of the Oncogenic Functions of Tribbles 1.Cancers (Basel). 2024 May 16;16(10):1889. doi: 10.3390/cancers16101889. Cancers (Basel). 2024. PMID: 38791967 Free PMC article. Review.
-
SRSF1 Is Required for Mitochondrial Homeostasis and Thermogenic Function in Brown Adipocytes Through its Control of Ndufs3 Splicing.Adv Sci (Weinh). 2024 Jun;11(21):e2306871. doi: 10.1002/advs.202306871. Epub 2024 Apr 3. Adv Sci (Weinh). 2024. PMID: 38569495 Free PMC article.
-
Long Noncoding RNA TRIBAL Links the 8q24.13 Locus to Hepatic Lipid Metabolism and Coronary Artery Disease.Circ Genom Precis Med. 2024 Dec;17(6):e004674. doi: 10.1161/CIRCGEN.124.004674. Epub 2024 Dec 3. Circ Genom Precis Med. 2024. PMID: 39624902 Free PMC article.
-
Bioinformatics analysis of the common targets of miR-223-3p, miR-122-5p, and miR-93-5p in polycystic ovarian syndrome.Front Genet. 2023 Feb 16;14:1097706. doi: 10.3389/fgene.2023.1097706. eCollection 2023. Front Genet. 2023. PMID: 36873932 Free PMC article.
References
-
- Schulman AR, Thompson CC. Complications of bariatric surgery: what you can expect to see in your GI practice. Am J Gastroenterol. 2017;112:1640–55. - PubMed
-
- Diano S, Horvath TL. Mitochondrial uncoupling protein 2 (UCP2) in glucose and lipid metabolism. Trends Mol Med. 2012;18:52–8. - PubMed
-
- Schmitt K, Grimm A, Dallmann R, Oettinghaus B, Restelli LM, Witzig M, et al. Circadian Control of DRP1 Activity Regulates Mitochondrial Dynamics and Bioenergetics. Cell Metab. 2018;27:657–66. e655. - PubMed
Publication types
MeSH terms
Substances
LinkOut - more resources
Full Text Sources
Medical
