. 2021 Nov 22;11(1):22651.
doi: 10.1038/s41598-021-01840-z.

Dynamic changes in immune gene co-expression networks predict development of type 1 diabetes

Collaborators, Affiliations

Dynamic changes in immune gene co-expression networks predict development of type 1 diabetes

Ingrid Brænne et al. Sci Rep. .

Abstract

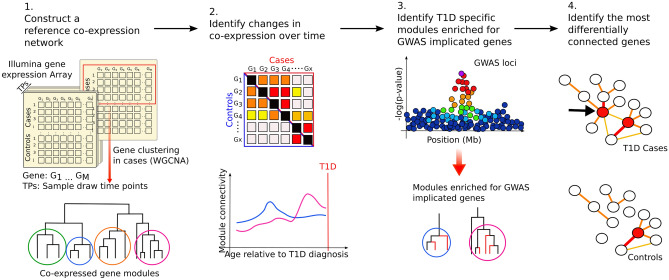
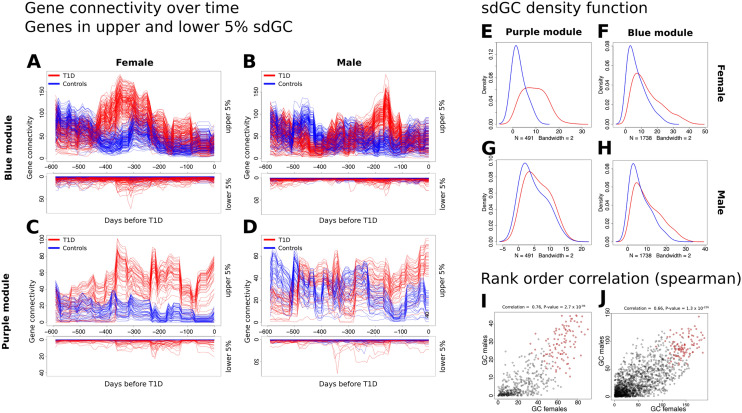
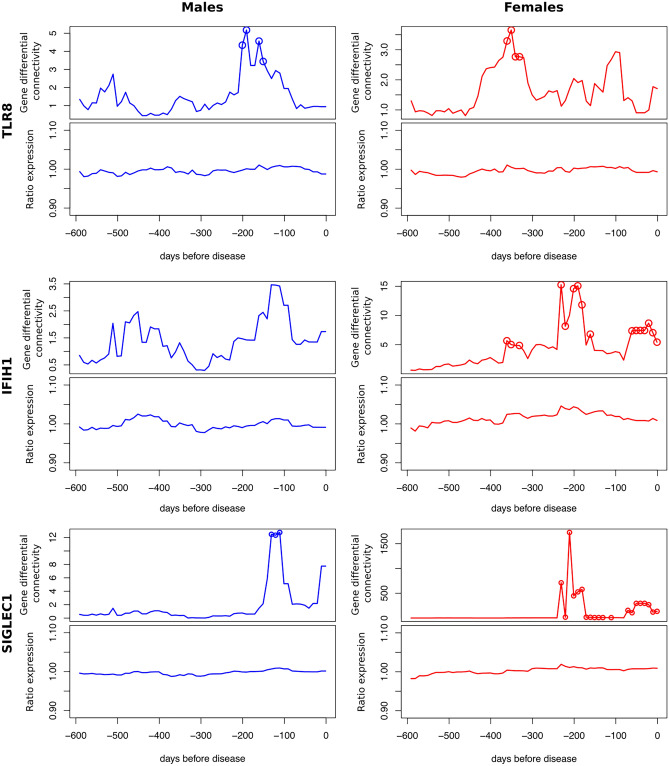
Significant progress has been made in elucidating genetic risk factors influencing Type 1 diabetes (T1D); however, features other than genetic variants that initiate and/or accelerate islet autoimmunity that lead to the development of clinical T1D remain largely unknown. We hypothesized that genetic and environmental risk factors can both contribute to T1D through dynamic alterations of molecular interactions in physiologic networks. To test this hypothesis, we utilized longitudinal blood transcriptomic profiles in The Environmental Determinants of Diabetes in the Young (TEDDY) study to generate gene co-expression networks. In network modules that contain immune response genes associated with T1D, we observed highly dynamic differences in module connectivity in the 600 days (~ 2 years) preceding clinical diagnosis of T1D. Our results suggest that gene co-expression is highly plastic and that connectivity differences in T1D-associated immune system genes influence the timing and development of clinical disease.


Conflict of interest statement

The authors declare no competing interests.

Figures

Figure 1
Figure 1
Construction of a “reference” T1D co-expression network enabled the exploration of changes of gene network dynamics across time, sex and disease status. (1) TEDDY transcriptomic profiles were grouped based on time from diagnosis and a “reference” WGCNA network was constructed for cases sampled approximately 180 days before T1D diagnosis. (2) Reference network modules were tested for enrichment of GWAS implicated genes. (3) For modules identified in step 2, we evaluated longitudinal differences in connectivity between cases and controls, (4) and we investigated the role of individual genes module behavior and T1D.
Figure 2
Figure 2
Maximum and minimum logarithmic MDC values in females and males over a time period of 600 days per module. The modules are ordered by module size.
Figure 3
Figure 3
Characterization of the TEDDY blood co-expression network. (A) Modules enriched for T1D GWAS-implicated genes (adjusted using FDR method). (B, C) GO term and pathway enrichment based on ConsensusPathDB. The P values are FDR adjusted P values. (DG) All enrichment P values are adjusted based on FDR method (D) Percentage of context dependent signature genes found in modules based on proxy genes identified by Zhernakova et al. (E) Percentage of genes differentially expressed under viral infection identified by Zaas et al. (F) Percentage of genes differentially expressed between EBV + and EBV- Ramos B cells (G) Percentage of genes found in the IRF7-driven inflammation network based on Heinig et al. (HK) Ratio of expression in cases versus controls over time for cell type proxy genes (L, M) Ratio of expression in cases versus controls of viral infection signature genes .
Figure 4
Figure 4
Dynamic changes in connectivity in the blue and purple modules. (A) and (B) module differential connectivity (MDC) over time in intervals of 10 days for the purple and blue modules, respectively. Solid points indicate a significant difference between cases and controls (FDR < 0.05). (CF) Direct comparison of topological overlap matrix for cases (upper left triangle) and controls (lower right triangle) at the MDC peak time point. (G) MDC metrics. (H, I) Change in MDC in the purple module correlates with change in the module eigengene (ME). MDC and ME patterns were strikingly similar, except for the last time point before diagnosis in the purple module. The correlated patterns suggest that gene expression influences, MDC but is not the only factor. Solid points indicate a significant difference between cases and controls (P < 0.05). (J, K) Change in MDC in the blue module also correlates with change in ME.
Figure 5
Figure 5
Assessing gene connectivity in Blue and Purple module. (AD) Gene connectivity (GC) over time. Red: cases, blue: controls. Genes were ranked based on variance in connectivity (based on standard deviation over time). Upper plot shows the upper 5 percent of genes based on GC for cases and controls. Lower plot shows genes of the lower 5 percentile of genes based on GC in cases and controls. (EH) Density function of the standard deviation of the GC over time. We observed a shift to the right in cases (red line) compared to controls (blue line) that was more profound in females (E, F) than males (G, H). (C) Rank order correlation (Spearman correlation) of GC at the MDC peak between females (I) and males (J). Red dots show the top 100 differential hub genes.
Figure 6
Figure 6
Gene connectivity (upper) and gene expression (lower) for TLR8 (blue module) and IFIH1 and SIGLEC1 (purple module). Gene differential connectivity P values < 0.05 are shown as circles.

References

    1. Eisenbarth GS. Banting Lecture 2009: An unfinished journey: Molecular pathogenesis to prevention of type 1A diabetes. Diabetes. 2010;59:759–774. doi: 10.2337/db09-1855. - DOI - PMC - PubMed
    1. Mayer-Davis EJ, et al. Incidence trends of type 1 and type 2 diabetes among youths, 2002–2012. N. Engl. J. Med. 2017;376:1419–1429. doi: 10.1056/NEJMoa1610187. - DOI - PMC - PubMed
    1. Insel RA, et al. Staging presymptomatic type 1 diabetes: A scientific statement of JDRF, the Endocrine Society, and the American Diabetes Association. Diabetes Care. 2015;38:1964–1974. doi: 10.2337/dc15-1419. - DOI - PMC - PubMed
    1. Noble JA, Valdes AM. Genetics of the HLA region in the prediction of type 1 diabetes. Curr. Diab. Rep. 2011;11:533–542. doi: 10.1007/s11892-011-0223-x. - DOI - PMC - PubMed
    1. Robertson CC, Rich SS. Genetics of type 1 diabetes. Curr. Opin. Genet. Dev. 2018;50:7–16. doi: 10.1016/j.gde.2018.01.006. - DOI - PubMed

Publication types