Meta-Analysis
. 2021 Nov 22;11(1):22660.
doi: 10.1038/s41598-021-02015-6.

Diversity and compositional changes in the gut microbiota of wild and captive vertebrates: a meta-analysis

Affiliations
Meta-Analysis

Diversity and compositional changes in the gut microbiota of wild and captive vertebrates: a meta-analysis

Antton Alberdi et al. Sci Rep. .

Abstract

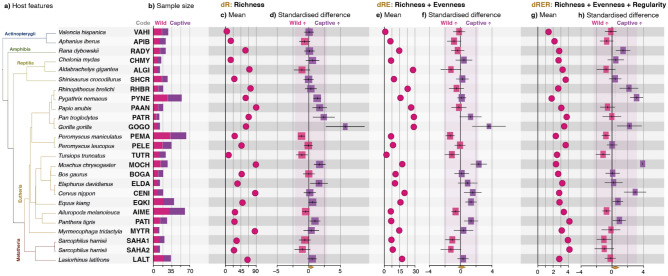
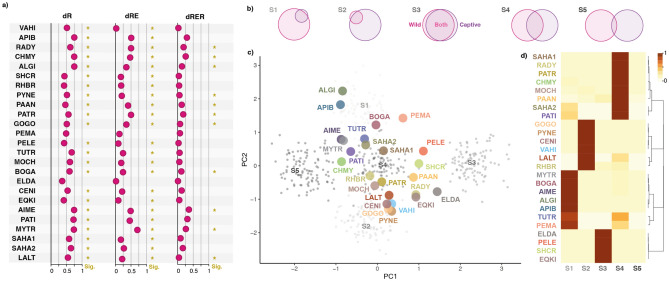
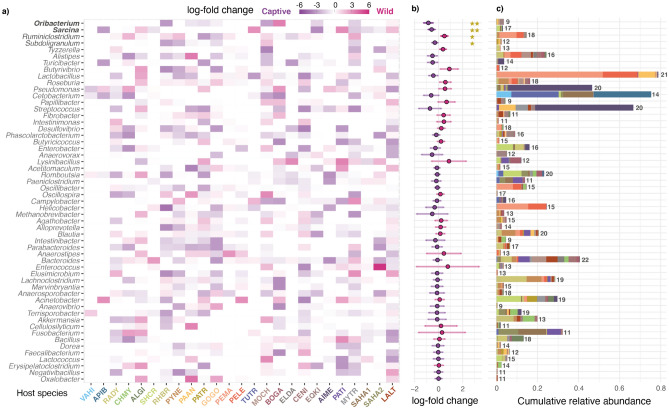
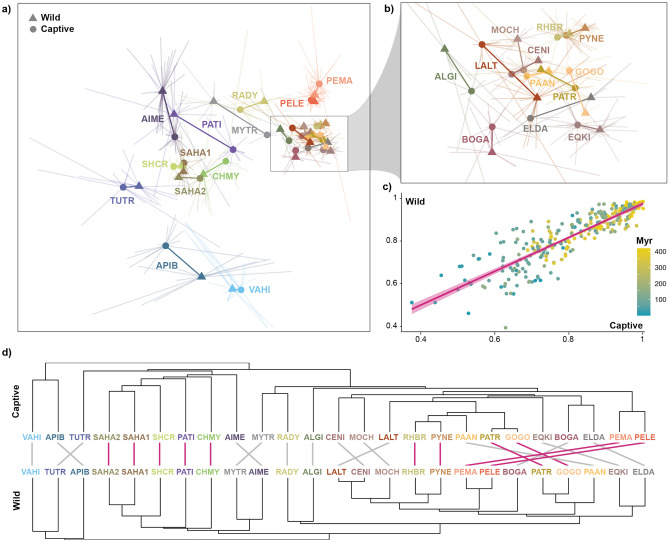
The gut microbiota is recognised as an essential asset for the normal functioning of animal biology. When wild animals are moved into captivity, the modified environmental pressures are expected to rewire the gut microbiota, yet whether this transition follows similar patterns across vertebrates is still unresolved due to the absence of systematic multi-species analyses. We performed a meta-analysis of gut microbiota profiles of 322 captive and 322 wild specimens from 24 vertebrate species. Our analyses yielded no overall pattern of diversity and compositional variation between wild and captive vertebrates, but a heterogeneous landscape of responses, which differed depending on the components of diversity considered. Captive populations showed enrichment patterns of human-associated microorganisms, and the minimal host phylogenetic signal suggests that changes between wild and captive populations are mainly driven by case-specific captivity conditions. Finally, we show that microbiota differences between wild and captive populations can impact evolutionary and ecological inferences that rely on hierarchical clustering-based comparative analyses of gut microbial communities across species.


Conflict of interest statement

The authors declare no competing interests.

Figures

Figure 1
Figure 1
Diversity differences of the gut microbiota between wild and captive vertebrate populations. (a) Phylogenetic tree, scientific names and dataset code of the analysed host species. (b) Number of wild and captive individuals. (c) Mean richness (number of genera) detected. (d) Mean standardised difference between the richness (dR) of wild and captive populations. Positive numbers indicate that the captive population is richer than the wild population and vice versa. (e) Mean effective number of taxa detected considering richness and eveness components (dRE). (f) Mean standardised difference between diversity dRE of wild and captive populations. (g) Mean effective number of lineages detected considering richness, eveness and regularity components (dRER). (h) Mean standardised difference between phylogenetic diversity dRER of wild and captive populations.
Figure 2
Figure 2
Compositional differences of the gut microbiota between wild and captive vertebrate populations. (a) Compositional dissimilarity values between captive and wild populations for the different diversity metrics analysed. Stars indicate whether dissimilarities were significant according to the null models. (b) Visual representation of the five scenarios of microbiota variation. “S1” depicts the gut microbiota of captive animals as a subset of that of wild counterparts. “S2” describes the opposite scenario in which the gut microbiota of wild animals is a subset of that of captive counterparts. “S3” assumes barely no difference between the gut microbiota of both populations. “S4” defines a a situation in which captive animals recruit a proportional set of microorganisms that is different from that of wild counterparts, yet maintain a considerable overlap. “S5” describes a scenario in which the gut microbiotas of both populations are almost totally different. (c) Principal components analysis showing observed microbiota variation in the studied host species (large coloured dots) over simulated data points (small greyscale dots). (d) Histogram of posterior probabilities of the contrasted scenarios for each host species, sorted according to hierarchical clustering dendrogram. Abbreviations are explained in Fig. 1a.
Figure 3
Figure 3
Differential abundance of the microbial taxa with highest prevalence. The listed microbial taxa were detected in more than a 33% (9) of the studies. (a) Log-fold changes of the most prevalent taxa in each host species. Purple tones indicate enrichment towards captive conditions, while pink tones indicate enrichment towards wild conditions. (b) Log-fold change estimates and their standard errors derived from the random effects meta-analysis of microbial abundances. Two stars indicate p-values under 0.05, while a single star indicate p-values under 0.1. (c) Cumulative relative abundances of taxa across the analysed datasets. Each coloured box indicates the mean relative abundance value of the microbial taxa in each study. Numbers indicate number of host species in which each taxon was detected. Abbreviations are explained in Fig. 1a.
Figure 4
Figure 4
Compositional differences of the gut microbiota between wild and captive animals. (a) NMDS plot of the gut microbiota composition between wild and captive animals coloured by host species. Triangles and circles linked by solid lines indicate the centroids of the gut microbiota composition in wild and captive animals, respectively, as defined by the individual data (outer edges of the thin lines) of each species. (b) Zoomed image of the NMDS plot to improve the visualisation of compositionally similar primates and artiodactylans. (c) Correlation plot between pairwise compositional differences of the gut microbiota between host species as calculated based on wild (Y axis) and captive (X axis) specimens. Colours of the dots indicate the evolutionary distance (in millions of years) between compared hosts. (d) Topological differences of the hierarchical clustering of species-level gut microbiota based on captive and wild animals. Common subtrees between captive and wild cladograms are highlighted by pink connecting lines. Abbreviations are explained in Fig. 1a.

References

    1. McFall-Ngai M, et al. Animals in a bacterial world, a new imperative for the life sciences. Proc. Natl. Acad. Sci. U.S.A. 2013;110:3229–3236. - PMC - PubMed
    1. Lynch JB, Hsiao EY. Microbiomes as sources of emergent host phenotypes. Science. 2019;365:1405–1409. - PubMed
    1. Alberdi A, Aizpurua O, Bohmann K, Zepeda-Mendoza ML, Gilbert MTP. Do vertebrate gut metagenomes confer rapid ecological adaptation? Trends Ecol. Evol. 2016;31:689–699. - PubMed
    1. Suzuki TA, Martins FM, Nachman MW. Altitudinal variation of the gut microbiota in wild house mice. Mol. Ecol. 2019;28:2378–2390. - PMC - PubMed
    1. Kueneman JG, et al. Probiotic treatment restores protection against lethal fungal infection lost during amphibian captivity. Proc. Biol. Sci. 2016;283:20161553. - PMC - PubMed

Publication types

Substances