. 2021 Nov 22;11(1):22725.
doi: 10.1038/s41598-021-02242-x.

MUC1 ectodomain is a flagellin-targeting decoy receptor and biomarker operative during Pseudomonas aeruginosa lung infection

Affiliations

MUC1 ectodomain is a flagellin-targeting decoy receptor and biomarker operative during Pseudomonas aeruginosa lung infection

Avelino C Verceles et al. Sci Rep. .

Abstract

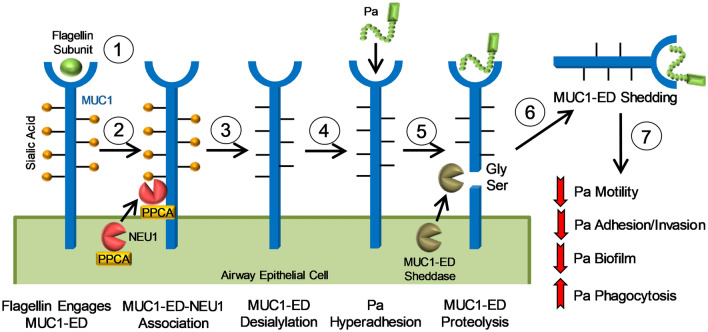
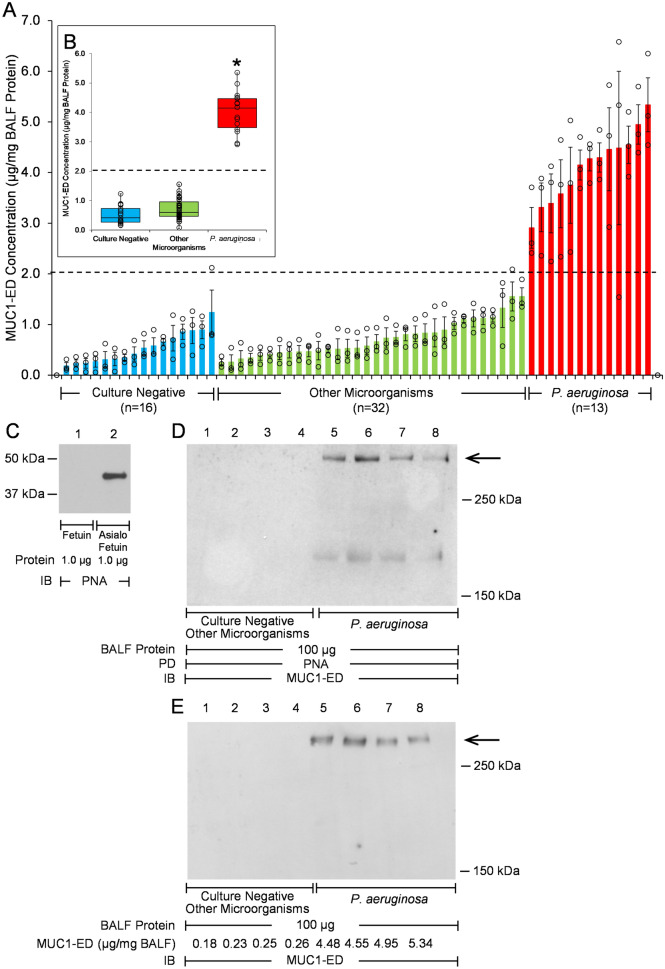
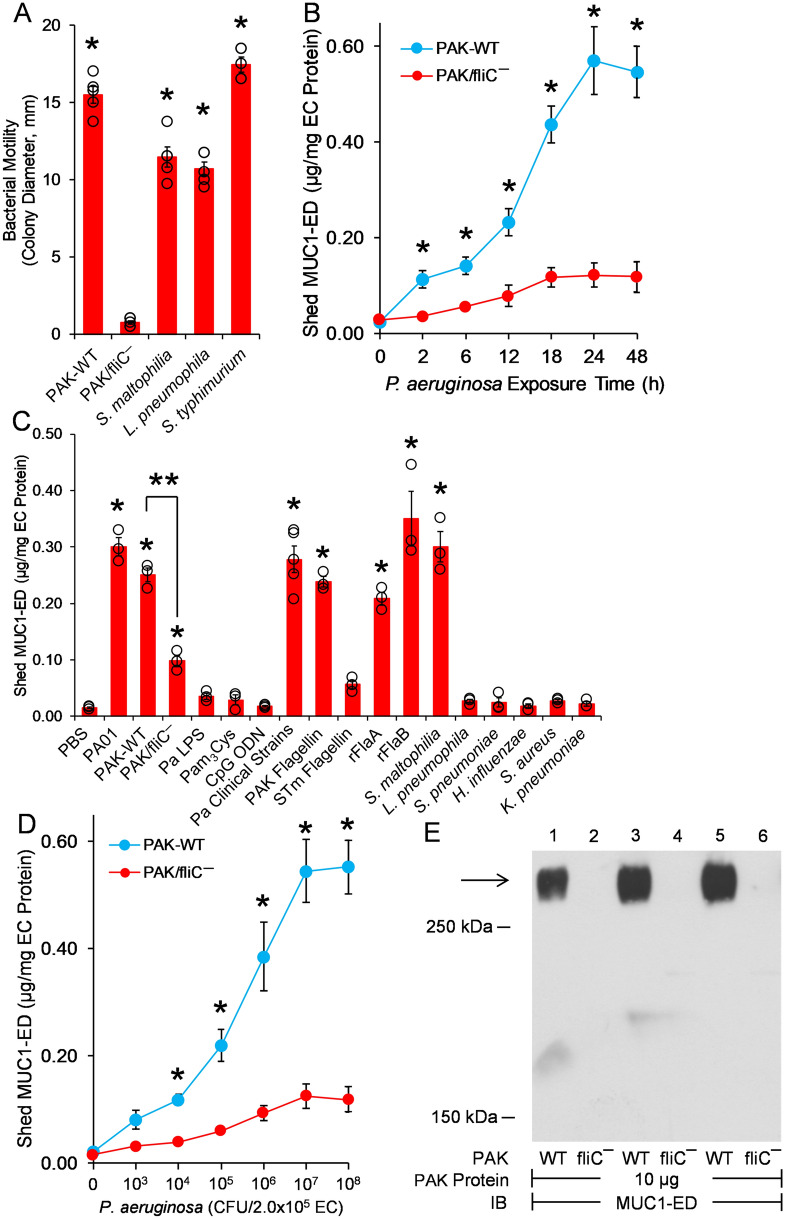
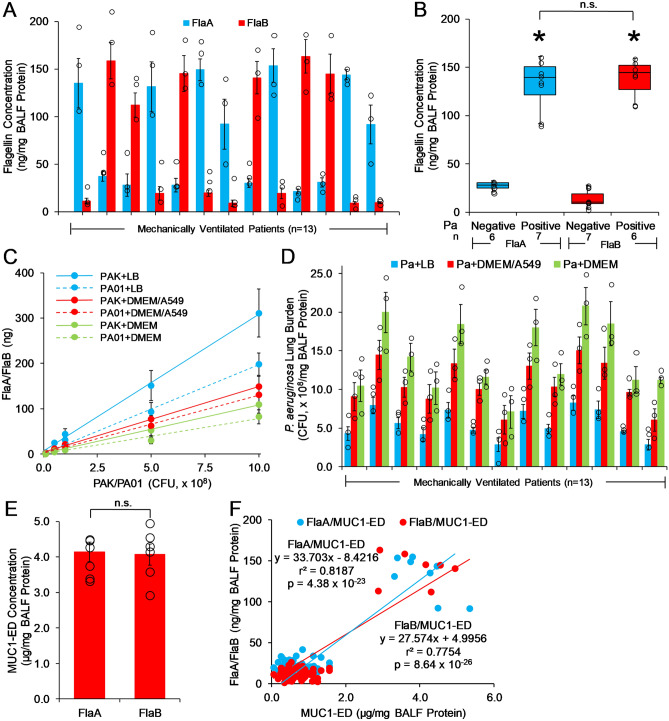
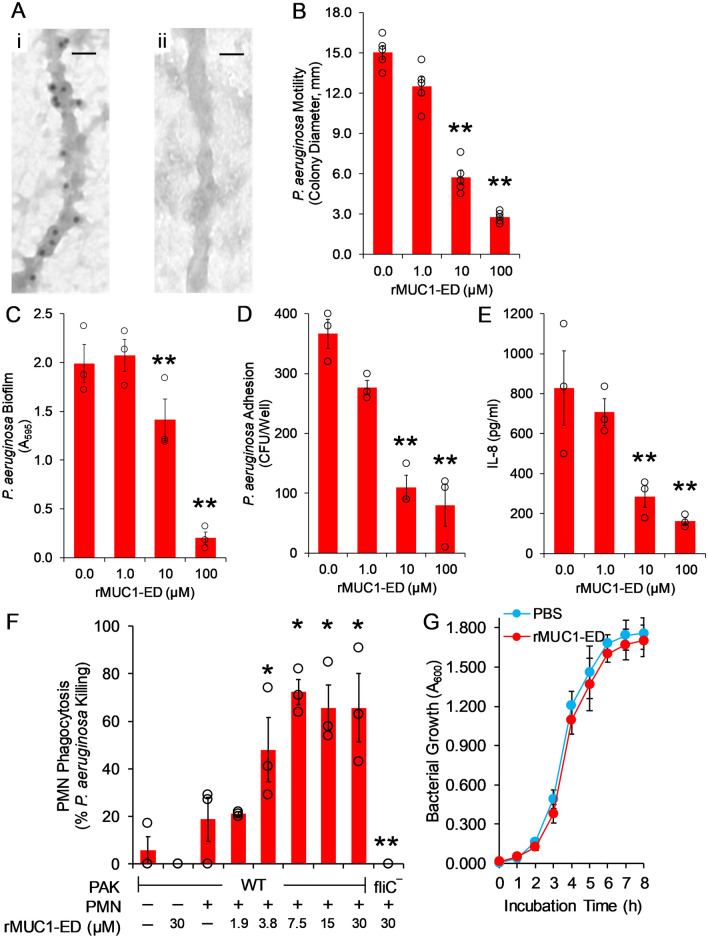
We previously reported that flagellin-expressing Pseudomonas aeruginosa (Pa) provokes NEU1 sialidase-mediated MUC1 ectodomain (MUC1-ED) desialylation and MUC1-ED shedding from murine lungs in vivo. Here, we asked whether Pa in the lungs of patients with ventilator-associated pneumonia might also increase MUC1-ED shedding. The levels of MUC1-ED and Pa-expressed flagellin were dramatically elevated in bronchoalveolar lavage fluid (BALF) harvested from Pa-infected patients, and each flagellin level, in turn, predicted MUC1-ED shedding in the same patient. Desialylated MUC1-ED was only detected in BALF of Pa-infected patients. Clinical Pa strains increased MUC1-ED shedding from cultured human alveolar epithelia, and FlaA and FlaB flagellin-expressing strains provoked comparable levels of MUC1-ED shedding. A flagellin-deficient isogenic mutant generated dramatically reduced MUC1-ED shedding compared with the flagellin-expressing wild-type strain, and purified FlaA and FlaB recapitulated the effect of intact bacteria. Pa:MUC1-ED complexes were detected in the supernatants of alveolar epithelia exposed to wild-type Pa, but not to the flagellin-deficient Pa strain. Finally, human recombinant MUC1-ED dose-dependently disrupted multiple flagellin-driven processes, including Pa motility, Pa biofilm formation, and Pa adhesion to human alveolar epithelia, while enhancing human neutrophil-mediated Pa phagocytosis. Therefore, shed desialylated MUC1-ED functions as a novel flagellin-targeting, Pa-responsive decoy receptor that participates in the host response to Pa at the airway epithelial surface.


Conflict of interest statement

The authors declare no competing interests.

Figures

Figure 1
Figure 1
Pa-expressed flagellin provokes NEU1-mediated MUC1-ED desialylation to generate a flagellin-targeting MUC1-ED decoy receptor. The Pa flagellin subunit engages cell-associated MUC1-ED (step 1), leading to recruitment of a preformed pool of intracellular NEU1, together with its chaperone protein, PPCA, to MUC1-ED (step 2). NEU1 desialylates the MUC1-ED (step 3), to increase its adhesiveness for Pa (step 4) and unmask its glycine-serine (Gly-Ser) protease recognition site (step 5), permitting sheddase-mediated MUC1-ED release from the airway EC surface (step 6). Shed, desialylated MUC1-ED in the airway lumen acts as a soluble decoy receptor that reduces Pa motility, competitively inhibits Pa adhesion to cell-associated MUC1-ED and subsequent invasion of airway epithelia, protects against Pa biofilm formation, and enhances Pa phagocytosis by host PMNs (step 7).
Figure 2
Figure 2
MUC1-ED levels are increased in BALF from P. aeruginosa-infected VAP patients. (A) MUC1-ED levels in BALF from noninfected patients (n = 16), patients infected with microorganisms other than Pa (n = 32), or Pa-infected patients (n = 13) were quantified by ELISA and normalized to total BALF protein. The dashed line represents an arbitrary cut-off value to differentiate BALF MUC1-ED levels in Pa-infected patients from patients infected with microorganisms other than Pa or noninfected patients. Bars represent mean ± S.E. values (n = 3). Open circles represent individual values. (B) Box and whisker plots of the data in (A). *, increased MUC1-ED levels compared with noninfected patients or patients infected with microorganisms other than Pa at p < 0.05. (C) Fetuin and asialofetuin (1.0 µg) were processed for PNA lectin blotting (lanes 1, 2) as controls to validate PNA specificity. (D, E) Equal protein aliquots (100 µg) of BALF from noninfected patients or patients infected with microorganisms other than Pa (lanes 1–4), or Pa-infected patients (lanes 5–8) were (D) incubated with PNA-agarose and the PNA-binding proteins processed for MUC1-ED immunoblotting or (E) directly processed for MUC1-ED immunoblotting. MUC1-ED concentrations by ELISA are indicated under each lane in (E). Molecular weights in kDa are indicated on the right. Each arrow indicates the > 250 kDa MUC1-ED band of interest. PD, pull down; IB, immunoblot. The full-length immunoblot is shown. The results are representative of 2 independent experiments.
Figure 3
Figure 3
Flagellin-expressing Pa induces MUC1-ED shedding in vitro. (A) Bacterial motility assays were used to verify flagellin expression by S. maltophilia, L. pneumophila, and S. enterica serovar Typhimurium. WT-PAK and the PAK/fliC¯ flagellin-deficient strain were used as positive and negative controls, respectively. Bars represent mean ± S.E. colony diameters (mm) as a functional assay for motility (n = 5). *, increased motility compared with the PAK/fliC¯ strain at p < 0.05. (B) To establish the time profile for MUC1-ED shedding, A549 cells (2.0 × 105 cells/well) cultured in 24-well plates were incubated for increasing times with fixed inocula of either WT-PAK or the PAK/fiC¯ mutant (1.0 × 107 CFUs/well). At each time point, MUC1-ED levels in cell culture supernatants were measured by ELISA and normalized to total A549 cell protein. (C) A549 cells (2.0 × 105 cells/well) in 24-well plates were incubated for 24 h at 37 °C with 1.0 × 107 CFUs/well of the indicated bacterial strains, 100 ng/well of Pa LPS, 10 µg/well of Pam3Cys-Ser-(Lys)4, 10 µg/well of CpG ODN 1826, 10 ng/well of Pa or STm flagellins, 10 ng/well of Pa rFlaA or rFla flagellins, or the PBS vehicle control. MUC1-ED levels in cell culture supernatants were measured by ELISA and normalized to total A549 cell protein. (D) A549 cells (2.0 × 105 cells/well) cultured in 24-well plates were incubated for 24 h at 37 °C with increasing CFUs/well of WT-PAK or the PAK/fliC¯ flagellin-deficient strain. MUC1-ED levels in cell culture supernatants were measured by ELISA and normalized to total cell protein. (BD) Bars and data points represent mean ± S.E. values (n = 3 or 5). (A, C) Open circles represent individual values. *, increased MUC1-ED levels compared with (A, B, D) PAK/fliC¯ or (C) the PBS control at p < 0.05. **, decreased MUC1-ED levels provoked by the PAK/fliC¯ flagellin-deficient strain compared with WT-PAK at p < 0.05. (E) WT-PAK (lanes 1, 3, 5) or the PAK/fliC¯ mutant strain (lanes 2, 4, 6) were co-cultured for 24 h with A549 cells, the supernatants collected, and centrifuged at 5,000 xg for 10 min to collect the bacteria. The bacteria were lysed and equal protein aliquots (10 µg) of the lysates processed for MUC1-ED immunoblotting to detect Pa:MUC1-ED complexes. Molecular weights in kDa are indicated on the left. The arrow indicates the > 250 kDa MUC1-ED band of interest. IB, immunoblot. The full-length immunoblot is shown. The results are representative of 2 or 3 independent experiments.
Figure 4
Figure 4
Pa-derived flagellin is present in the BALF of Pa-infected VAP patients. (A) Pa FlaA and FlaB flagellin levels in BALF from Pa-infected patients (n = 13) were quantified by ELISA and normalized to total BALF protein. (B) Box and whisker plots of the data in (A). *, increased MUC1-ED levels compared with FlaA-negative or FlaB-negative BALF. n.s., not significant. (C) Increasing CFUs of FlaA-expressing PAK or FlaB-expressing PA01 bacteria were cultured in LB medium or DMEM containing 10% FBS in the presence or absence of A549 cells. The bacteria were lysed and the lysates processed for FlaA or FlaB levels by ELISA. Standard curves were calculated by linear regression. (D) Pa lung burden was calculated using the flagellin levels in (A) with interpolation from the standard curves in (C). Bars represent mean ± S.E. values (n = 3). Open circles represent individual values. (E) MUC1-ED levels in BALFs that cultured positive for FlaA-expressing Pa (n = 7) were compared with MUC1-ED levels in BALFs that cultured positive for FlaB-expressing Pa (n = 6). Bars represent mean ± S.E. MUC1-ED levels normalized total BALF protein. Open circles represent individual values. (F) BALF Pa FlaA and FlaB levels in (A) were correlated with BALF MUC1-ED levels (Fig. 2A) and analyzed by linear regression. The results are representative of 3 independent experiments.
Figure 5
Figure 5
Human rMUC1-ED exhibits flagellin-targeting decoy receptor function, and enhances the PMN phagocytic response. (A) PAK was incubated for 1 h at 4 °C with 25 µM of human rMUC1-ED. The bacteria were washed with PBS, pH 7.4 and incubated for 1 h at 4 °C with mouse anti-MUC1-ED antibody (panel i) or nonimmune mouse IgG control (panel ii), each at 1:5,000 dilution, followed by 1 h at 4 °C with gold-labeled goat anti-mouse IgG secondary antibody at 1:10,000 dilution. Bacterial flagella were examined by transmission immunoelectron microscopy. Each section was photographed at 44,000X. Scale bar, 25 nm. (B, C) The indicated concentrations of human rMUC1-ED or the PBS vehicle control were incubated with PAK, and the bacteria were washed and assayed for (B) motility and (C) biofilm formation. (D, E) The indicated concentrations of human rMUC1-ED or the PBS vehicle control were incubated with PAK, and (D) the bacteria were assayed for adhesion to A549 cells and (E) cell culture supernatants were assayed for IL-8 levels by ELISA. (F) The indicated concentrations of human rMUC1-ED or the PBS vehicle control were incubated with WT-PAK or the PAK/fliC¯ flagellin-deficient strain and the bacteria were assayed for phagocytosis by PMNs. Bars represent mean ± S.E. values (n = 3). Open circles represent individual values. **, significantly decreased Pa motility, biofilm, adhesion, or IL-8 levels compared with the PBS control, or phagocytosis of PAK/fliC¯ compared with WT-PAK, at p < 0.05. *, significantly increased WT-PAK phagocytosis compared with the PBS control at p < 0.05. (G) PAK were cultured with 100 µM of human rMUC1-ED or the PBS vehicle, cultured over time in LB medium, and assayed for bacterial growth. Error bars represent mean ± S.E. A600 values (n = 3). The results are representative of 2 or 3 independent experiments.

References

    1. Kalil AC, Metersky ML, Klompas M, Muscedere J, Sweeney DA, Palmer LB, Napolitano LM, O'Grady NP, Bartlett JG, Carratalà J, El Solh AA, Ewig S, Fey PD, File TM, Jr, Restrepo MI, Roberts JA, Waterer GW, Cruse P, Knight SL, Brozek JL. Management of adults with hospital-acquired and ventilator-associated pneumonia: 2016 Clinical practice guidelines by the Infectious Diseases Society of America and the American Thoracic Society. Clin. Infect. Dis. 2016;63:575–582. doi: 10.1093/cid/ciw504. - DOI - PMC - PubMed
    1. Metersky ML, Wang Y, Klompas M, Eckenrode S, Bakullari A, Eldridge N. Trend in ventilator-associated pneumonia rates between 2005 and 2013. JAMA. 2016;316:2427–2429. doi: 10.1001/jama.2016.16226. - DOI - PubMed
    1. Edwards JR, Peterson KD, Andrus ML, Tolson JS, Goulding JS, Dudeck MA, Mincey RB, Pollock DA, Horan TC. NHSN facilities, national healthcare safety network (NHSN) report, data summary for 2006, issued June 2007. Am. J. Infect. Control. 2007;35:290–301. doi: 10.1016/j.ajic.2007.04.001. - DOI - PubMed
    1. Dudeck MA, Weiner LM, Allen-Bridson K, Malpiedi PJ, Peterson KD, Pollock DA, Sievert DM, Edwards JR. National Healthcare Safety Network (NHSN) report, data summary for 2012, device-associated module. Am. J. Infect. Control. 2013;41:1148–1166. doi: 10.1016/j.ajic.2013.09.002. - DOI - PMC - PubMed
    1. Muscedere JG, Day A, Heyland DK. Mortality, attributable mortality, and clinical events as end points for clinical trials of ventilator-associated pneumonia and hospital-acquired pneumonia. Clin. Infect. Dis. 2010;51(Suppl. 1):S120–S125. doi: 10.1086/653060. - DOI - PubMed

Publication types

MeSH terms