

doi: 10.1038/s41593-021-00951-0.
Epub 2021 Nov 22.
Microglia contribute to the propagation of Aβ into unaffected brain tissue
Affiliations
- PMID: 34811521
- PMCID: PMC8737330
- DOI: 10.1038/s41593-021-00951-0
Item in Clipboard
Microglia contribute to the propagation of Aβ into unaffected brain tissue
Nat Neurosci.
2022 Jan.
Abstract
Microglia appear activated in the vicinity of amyloid beta (Aβ) plaques, but whether microglia contribute to Aβ propagation into unaffected brain regions remains unknown. Using transplantation of wild-type (WT) neurons, we show that Aβ enters WT grafts, and that this is accompanied by microglia infiltration. Manipulation of microglia function reduced Aβ deposition within grafts. Furthermore, in vivo imaging identified microglia as carriers of Aβ pathology in previously unaffected tissue. Our data thus argue for a hitherto unexplored mechanism of Aβ propagation.
© 2021. The Author(s).
Conflict of interest statement
The authors declare no competing interests.
Figures
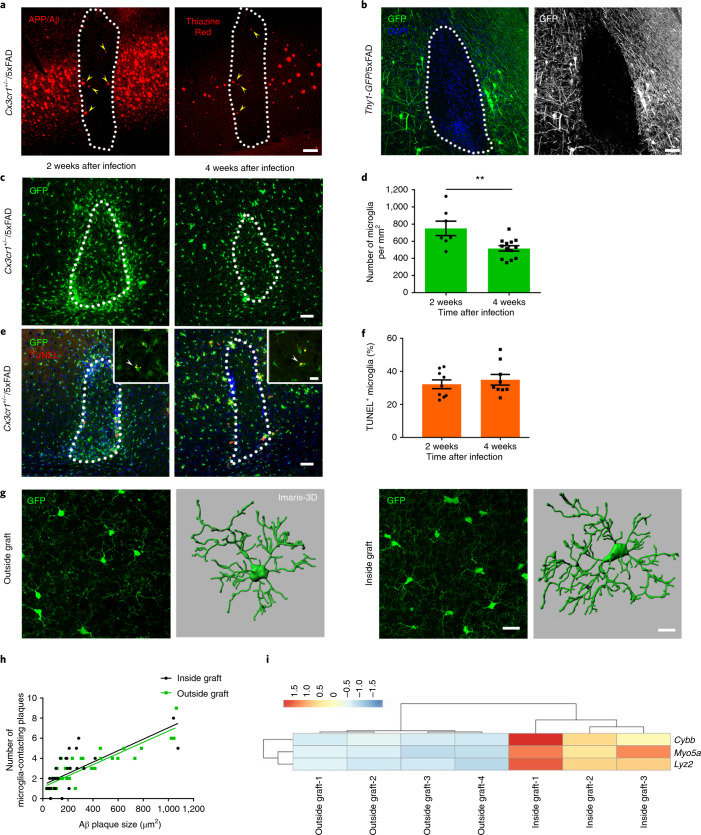
a, Fluorescence microscopy of a graft 4 weeks after injection into Cx3cr1+/−/5xFAD cortex. Yellow arrowheads indicate Aβ deposition (left: 6E10 in red, from n = 9 mice; right: Thiazine Red in red, from n = 4 mice) inside the graft (outlined with a white dotted line). Scale bar, 50 μm. b, Representative fluorescence microscopy of a graft at 4 weeks after injection in Thy1-GFP/5xFAD recipient mice, from n = 4 mice. Scale bar, 50 μm. c, Analysis of microglia accumulation inside grafts at 2 and 4 weeks after injection in Cx3cr1+/−/5xFAD transgenic mice. Scale bar, 50 μm. d, Graph shows mean (± s.e.m.) of microglia cell density inside grafts; each symbol represents one graft from n = 7 (2 weeks) and n = 13 (4 weeks) mice. Significant differences were determined using the Mann–Whitney test (**P = 0.0085). e, Fluorescence microscopy of TUNEL-positive (red) microglia (green) inside grafts at 2 and 4 weeks after injection in Cx3cr1+/−/5xFAD transgenic mice. Scale bars, 50 μm in the overview and 15 μm in the inset. f, Percentage of TUNEL-positive microglia inside grafts. Each symbol represents one graft from n = 9 mice per group. Data are presented as mean (± s.e.m.). Significant differences were determined using the two-tailed Mann–Whitney test. g, Confocal microscopy and Imaris-3D reconstruction of microglia outside (left) or inside (right) the graft. Scale bars, 20 μm in the confocal acquisition and 10 μm in the Imaris reconstruction. For 3D reconstruction, we considered two regions inside and outside grafts in n = 2 mice per group. h, Pearson correlation between the number of microglia-contacting plaques and plaque size inside (r = 0.53, P < 0.0001) and outside (r = 0.80, P < 0.0001) the grafts. Each symbol represents one compact plaque from n = 7 Cx3cr1+/−/5xFAD mice. i, Heat map of the three top differentially regulated genes (**P < 0.01) in microglia FACS-sorted from either isolated cortical grafts or cortical regions outside the transplant that were used as controls. Differentially expressed genes were determined using the limma-voom package in R. Source data
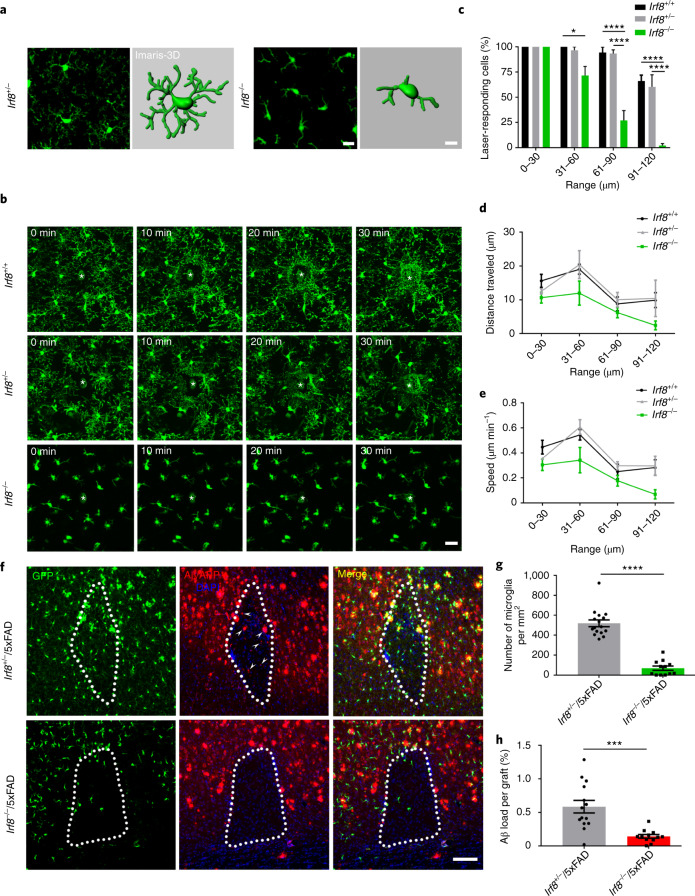
a, Representative confocal images (left) and corresponding Imaris-3D reconstruction (right) of microglia in the cortex of Irf8+/− and Irf8−/− mice. Scale bars, 15 μm in the left image and 10 μm in the 3D reconstruction on the right. For 3D reconstruction, two cells were considered in n = 2 mice per group. b–e, In vivo two-photon analysis of microglia process motility between 0 and 30 min after laser lesion ablation in Irf8+/+, Irf8+/− and Irf8−/− mice. Scale bar, 20 μm. Quantification of percentage of laser-responding cells (c), mean distance traveled (d) and speed of microglia processes (e) based on their distance from the injury site. Data are presented as mean (± s.e.m.). Significant differences were determined using two-way ANOVA followed by Sidak’s multiple comparison test (in c, ****P < 0.0001 and *P = 0.030), Tukey’s multiple comparison test F6,46 = 0.8661 (in d, range 31–60 μm: *P = 0.044 Irf8+/+ versus Irf8−/− and **P = 0.008 Irf8+/− versus Irf8−/−; range 91–120 μm: P = 0.054 Irf8+/+ versus Irf8−/− and *P = 0.0199 Irf8+/− versus Irf8−/−) and Tukey’s multiple comparison test F6,46 = 0.9551 (in e, range 31–60 μm: *P = 0.0484 Irf8+/+ versus Irf8−/− and **P = 0.0039 Irf8+/− versus Irf8−/−; range 91–120 μm: P = 0.0584 Irf8+/+ versus Irf8−/− and *P = 0.0235 Irf8+/− versus Irf8−/−). Data are from n = 4 Irf8+/+, n = 5 Irf8+/− and n = 6 Irf8−/− mice. f, Grafts in Irf8+/−/5xFAD and Irf8−/−/5xFAD recipient mice immunostained for Aβ (6E10, red; white arrowheads indicate Aβ depositions) and DAPI (blue). Scale bar, 100 μm. g,h, Graphs show mean (± s.e.m.) microglia density (g) and percentage of Aβ inside the grafts (h) in the two groups of mice. Each symbol represents one graft from n = 7 Irf8+/−/5xFAD and n = 6 Irf8−/−/5xFAD mice. Significant differences were determined using the two-tailed Mann–Whitney test (****P < 0.0001 in g and ***P = 0.001 in h). Source data
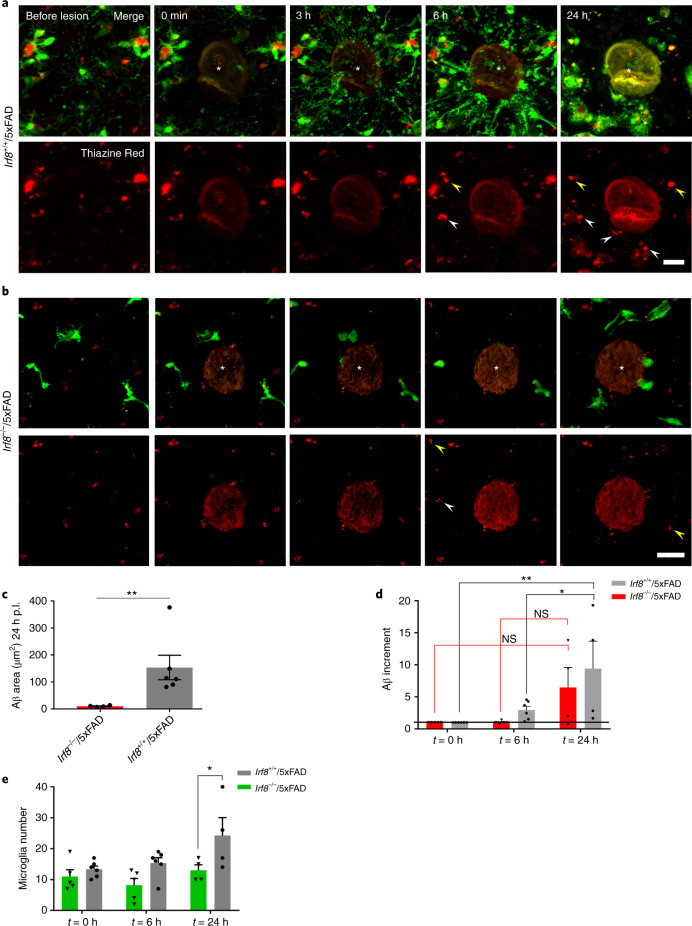
a,b, In vivo two-photon imaging of Aβ-containing microglial responses at different time points after laser-induced tissue injury in Irf8+/+/Cx3cr1+/−/5xFAD mice (a) and Irf8−/−/Cx3cr1+/−/5xFAD mice (b). The top panels show merged images of GFP (green) and Thiazine Red (red) signal; the bottom panel shows only the Thiazine Red signal; asterisks indicate laser ablations; white arrowheads depict internalized Aβ moving with time; and yellow arrowheads indicate amyloid material associated with small microglia debris or no microglia association at all (shown only in the red channel). Scale bars, 50 μm. c–e, Graphs show mean (± s.e.m.) of Aβ accumulation at the lesion site 24 h post lesion (p.l.) in both groups of mice (c), relative increment of Aβ at the lesion site at 0, 6 and 24 h p.l. (d), and microglia accumulation at 0, 6 and 24 h p.l (e). Each symbol represents one laser lesion from n = 6 Irf8+/+/Cx3cr1+/−/5xFAD mice and n = 5 Irf8−/−/Cx3cr1+/−/5xFAD mice. Significant differences were determined using either the two-tailed Mann–Whitney test (**P = 0.0095 in c) or two-way ANOVA with Sidak’s multiple comparison test (*P = 0.0436 and **P = 0.0068 in d and *P = 0.0282 in e). NS, not significant. Source data
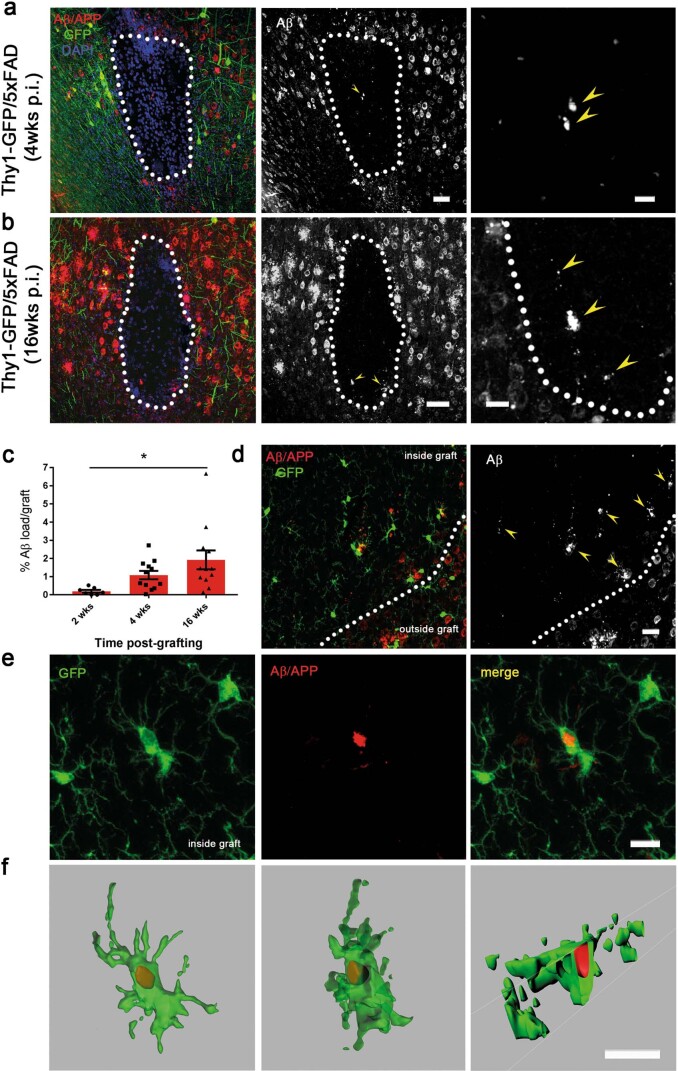
(a,b) Fluorescence microscopy of grafts in Thy1-GFP/5xFAD recipient mice at (a) 4 weeks p.i. and (b) 16 weeks p.i. immunostained for Aβ (6E10, red and white; yellow arrowheads indicate the amyloid deposition) and DAPI (blue). Scale bar, 50 μm in the overview (a) and (b), 20 μm in the higher magnification (a), 25 μm in the higher magnification (b). n = 3 mice per incubation time. (c) Histogram showing the percentage of Aβ accumulation inside the grafts of Cx3cr1+/−/5xFAD recipient mice at 2, 4 and 16 weeks p.i.. Each symbol represents one graft from n = 4 (2 weeks p.i.), n = 9 (4 weeks p.i.) and n = 8 (16 weeks p.i.) mice. Data are presented as mean (± s.e.m.). Significant differences were determined by one-way ANOVA followed by Tukey’s multiple comparison test, F(2, 28) = 4.412 (*P = 0.0175). (d-f) Representative confocal microscopy showing (d) Aβ localization (6E10, red) in the graft and (e) high magnification acquisition (f) and Imaris-3D reconstruction of microglia (GFP, green) containing Aβ (red). Scale bars, 50 μm in (d), 10 μm in (e) and (f). n = 3 mice. Source data
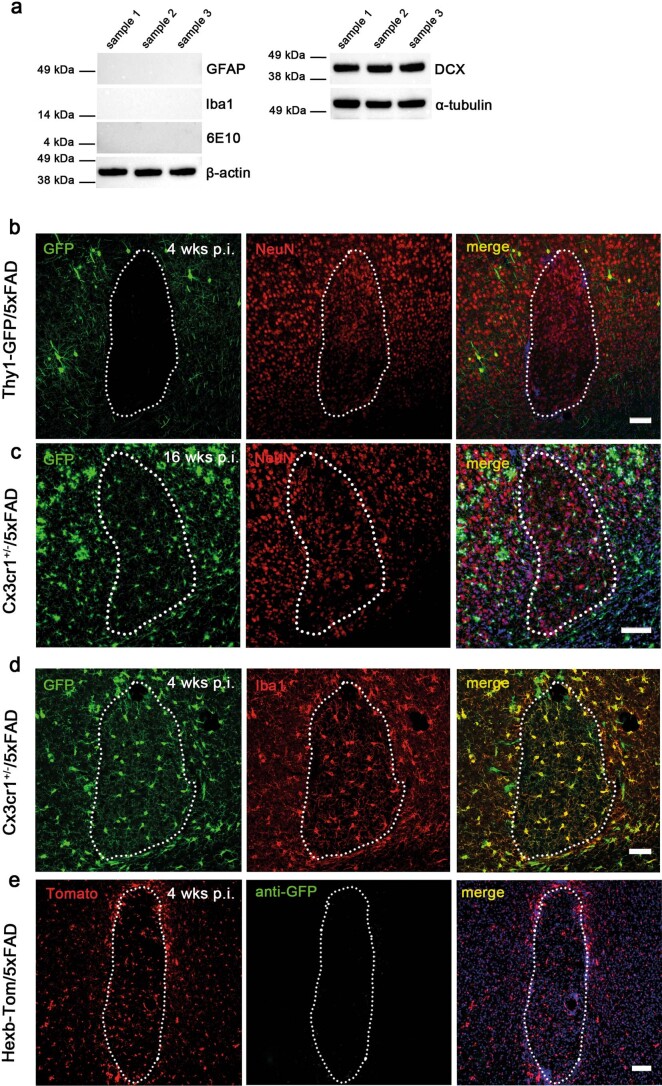
(a) Immunoblot analysis of cortical cell suspension that were used for grafting experiments. For the blot in the left panel, every protein was detected on separate membranes and only the loading control from the GFAP gel is shown. For uncropped gels with corresponding loading controls see Source Data Extended Data Fig. 2. n = 3 independent cell suspensions. (b) Representative confocal image of a graft in Thy1-GFP/5xFAD recipient mouse immunostained with NeuN (red) and DAPI (blue). n = 1 mouse. (c) Representative microscopy of a graft at 16 weeks p.i. of a Cx3cr1+/−/5xFAD recipient mouse immunostained with NeuN (red) and DAPI (blue). n = 1 mouse. (d) Confocal image of a graft in Cx3cr1+/−/5xFAD recipient mouse immunostained with Iba1 (red). n = 3 mice. (e) Confocal image of a graft in Hexb-tom/5xFAD recipient mouse transplanted with neurons from Cx3cr1-GFP embryos and counterstained with DAPI (blue). Scale bars 100 μm in (b), (c) and (e), 50 μm in (d). n = 4 mice. Source data
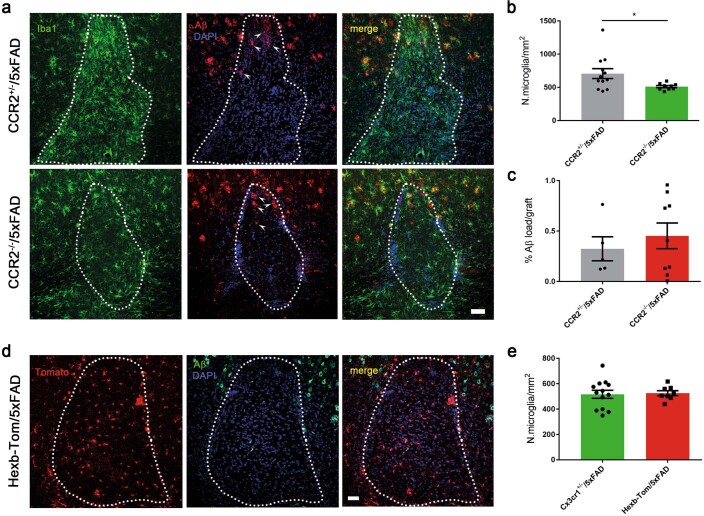
(a) Fluorescence microscopy of a graft in CCR2+/−/5xFAD (top) and CCR2−/−/5xFAD (bottom) mice immunostained for Aβ (6E10, red; white arrowheads indicate the Aβ), Iba1 (green) and DAPI (blue). Scale bar, 50 μm. (b and c) Graphs show mean (± s.e.m.) of (b) microglia density and (c) percentage of Aβ inside grafts in the two groups of mice. Each symbol represents one graft from n = 7 CCR2+/−/5xFAD and n = 4 CCR2−/−/5xFAD mice. Significant differences were determined by the Mann–Whitney test (*P = 0.04). (d) Fluorescence microscopy of a graft in Hexb-tom/5xFAD recipient immunostained for Aβ (6E10, green), and DAPI (blue). Scale bar, 50 μm. (e) Histogram compares mean (± s.e.m.) of microglia density in grafts of Cx3cr1+/−/5xFAD and Hexb-tom/5xFAD recipient mice. Each symbol represents one graft from n = 8 Cx3cr1+/−/5xFAD and n = 4 Hexb-tom/5xFAD. Significant differences were determined by the two-tailed Mann–Whitney test. Source data
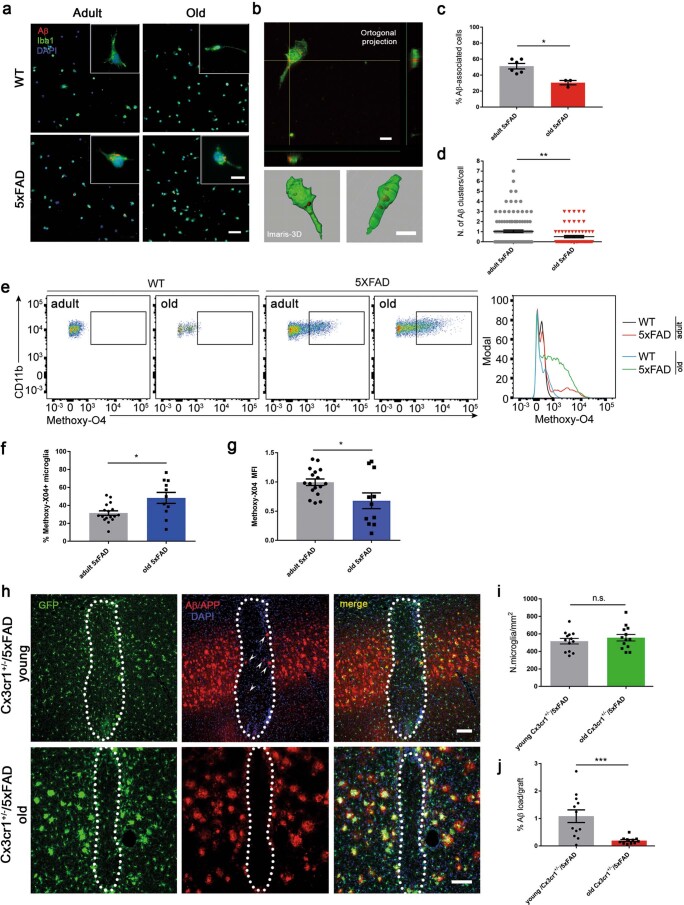
(a and b) Confocal microscopy of microglia cells in vitro isolated from adult (WT and 5xFAD) or old (WT and 5xFAD) mice immunostained for Aβ (6E10, red), Iba1 (green) and DAPI (blue). Scale bar 50 μm in the overview and 10 μm in the inset. (b) Confocal orthogonal projection (top) and Imaris-3D reconstruction (bottom) of a single microglia cell containing Aβ material. Scale bars, 10 μm. (c and d) Graph shows mean (± s.e.m.) of Aβ-associated microglia (c) in cells isolated from adult and old 5xFAD mice. Each symbol represents data from one mouse, n = 6 adult 5xFAD and n = 3 old 5xFAD mice. Significant differences were determined by the two-tailed Mann–Whitney test (*P = 0.023). (d) Number of Aβ clusters inside each microglia cell from adult and old 5xFAD mice. Each symbol represents one cell. From n = 5 adult 5xFAD and n = 3 old 5xFAD mice. Significant differences were determined by the two-tailed Mann–Whitney test (**P = 0.0038). (e-g) Methoxy-XO4 FACS analysis of microglia isolated from adult and old 5xFAD mice. (e) Representative FACS dot-plots (left) and cytometry graph (right) for WT, adult 5xFAD and old 5xFAD mice. Quantification of the (f) percentage (%) and (g) mean fluorescence intensity (MFI) of methoxy-XO4 positive CD11b+CD45low hippocampal microglial cells by flow cytometry isolated from the two 5xFAD groups 3 hours after methoxy-XO4 injection. Each symbol represents data from one mouse, with n = 17 adult 5xFAD and n = 11 old 5xFAD mice. Data are presented as mean (± s.e.m.). Significant differences were determined by the two-tailed Mann–Whitney test (*P = 0.022 in f; *P = 0.045 in g). (h) Fluorescence microscopy of grafts in young pre-depositing (top) and old (bottom) Cx3cr1+/−/5xFAD mice immunostained for Aβ (6E10, red; white arrowheads indicate Aβ deposition) and DAPI (blue). Scale bar, 100 μm. (i and j) Graphs show mean (± s.e.m.) of (i) microglia density and (j) percentage of Aβ inside grafts in the two groups of mice. Each symbol represents one graft from n = 9 young Cx3cr1+/−/5xFAD and n = 7 old Cx3cr1+/−/5xFAD mice. Significant differences were determined by the two-tailed Mann–Whitney test (P = 0.544 in i; ***P = 0.0005 in j). Source data
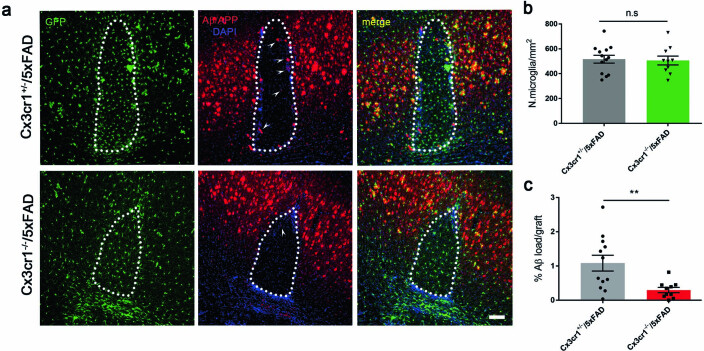
(a) Fluorescence microscopy of a graft in Cx3cr1+/−/5xFAD (top) and Cx3cr1−/−/5xFAD (bottom) mice immunostained for Aβ (6E10, red; white arrowheads indicate Aβ), and DAPI (blue) at 4 weeks p.i. Scale bar, 100 μm. (b and c) Graphs show mean (± s.e.m.) of (b) microglia density and (c) percentage of Aβ inside the grafts. Each symbol represents one graft from n = 9 Cx3cr1+/−/5xFAD and n = 7 Cx3cr1−/−/5xFAD mice. Significant differences were determined by the two-tailed Mann–Whitney test (**P = 0.009). Source data
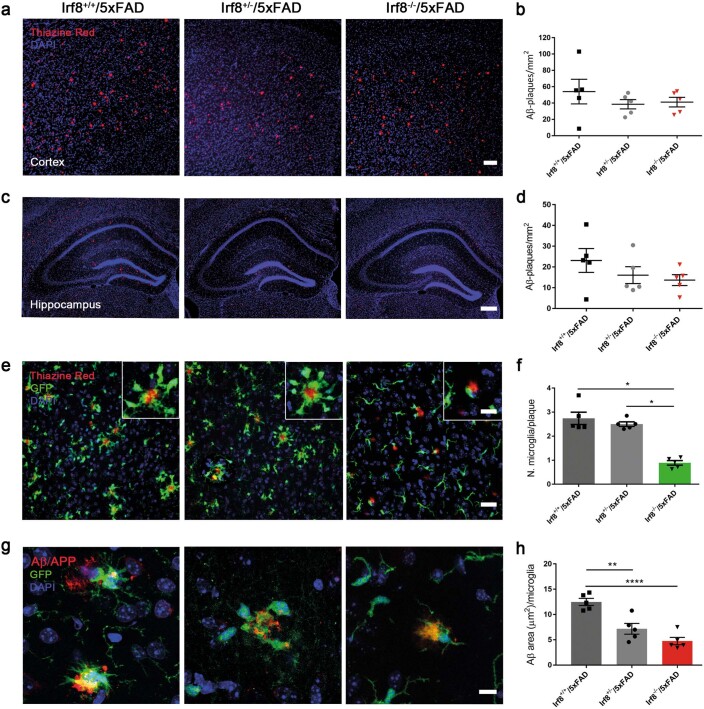
(a,c) Fluorescence microscopy of Irf8+/+/Cx3cr1+/−/5xFAD (left), Irf8+/−/Cx3cr1+/−/5xFAD (middle) and Irf8−/−/Cx3cr1+/−/5xFAD (right) cortices (a) and hippocampi (c) stained with Thiazine Red (red) and DAPI (blue). Scale bar, 100 μm in (a); 300 μm in (c). (b,d) Graphs show the mean (± s.e.m.) of Thiazine Red positive Aβ plaques in the three groups of mice in the cortex (b) and hippocampus (d). Each symbol represents one mouse from n = 5 mice per group. Significant differences were determined by one-way ANOVA followed by Tukey’s multiple comparison test. (e) Confocal microscopy of Irf8+/+/Cx3cr1+/−/5xFAD (left), Irf8+/−/Cx3cr1+/−/5xFAD (middle) and Irf8−/−/Cx3cr1+/−/5xFAD (right) cortices stained with Thiazine Red (red) and DAPI (blue). Scale bar, 30 μm; inset, 10 μm. (f) Graph shows the mean number (± s.e.m.) of microglia per plaque in the three groups. Each symbol represents one mouse from n = 5 mice per genotype. Significant differences were determined by Kruskal-Wallis test followed by Dunn’s multiple comparisons test, (*P = 0.014; *P = 0.04). (g) Confocal microscopy of Irf8+/+/Cx3cr1+/−/5xFAD (left), Irf8+/−/Cx3cr1+/−/5xFAD (middle) and Irf8−/−/Cx3cr1+/−/5xFAD (right) cortices immunolabeled with 6E10 antibody (red) and DAPI (blue). Scale bar, 10 μm. (h) Graph shows the mean (± s.e.m.) of Aβ internalized by microglia in the three groups of mice. Each symbol represents one mouse from n = 5 mice per group. Significant differences were determined by one-way ANOVA followed by Tukey’s multiple comparison test, F(2, 12) = 21.8 (**P = 0.0022; ****P < 0.0001). Source data
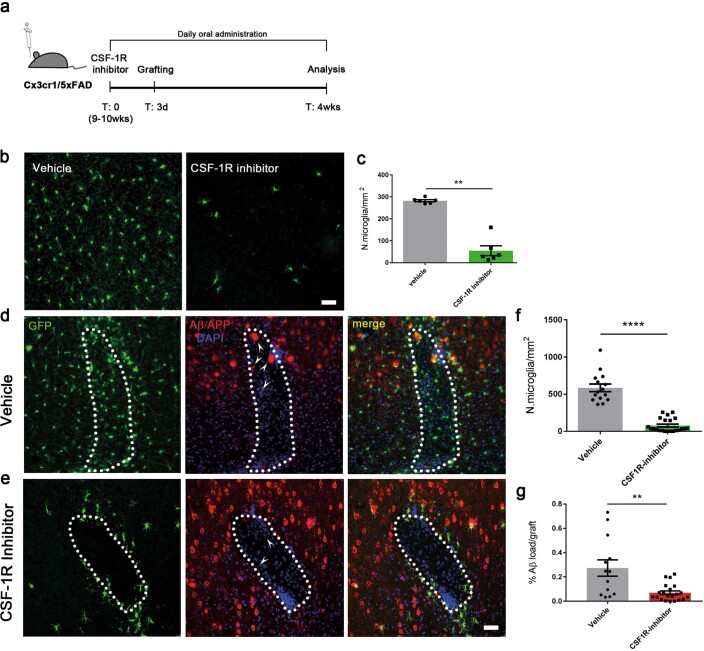
(a) Experimental setup for the elimination of microglia and transplantation procedure in Cx3cr1+/−/5xFAD mice. (b) Fluorescence microscopy of Cx3cr1+/−/5xFAD cortex treated with vehicle (left) or CSF-1R inhibitor (right). Scale bar, 50 μm. (c) Quantification shows mean (± s.e.m.) of cortical microglia density after treatment. Each symbol represents one mouse of n = 6 mice per group. Significant differences were determined by the two-tailed Mann–Whitney test (**P = 0.0022). (d-e) Fluorescence microscopy of a graft in Cx3cr1+/−/5xFAD mice treated for 30 days with (d) CSF-1R vehicle or (e) CSF-1R inhibitor and immunostained for Aβ (6E10, red; white arrowheads indicate Aβ), and DAPI (blue). Scale bar, 50 μm. (f and g) Graphs show mean (± s.e.m.) of (f) microglia density and (g) percentage of Aβ inside the graft in the two groups of mice. Each symbol represents one graft from n = 8 mice per group. Significant differences were determined by the two-tailed Mann–Whitney test (****P < 0.0001; **P = 0.0031). Source data
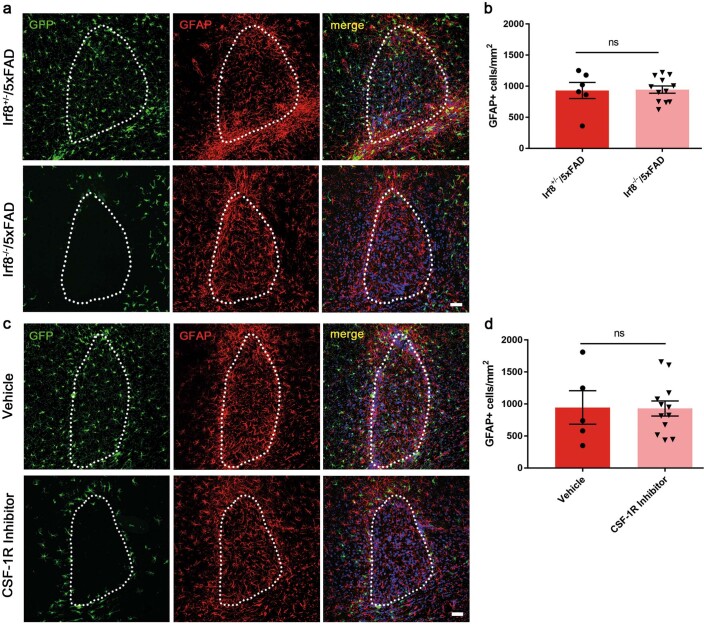
(a,c) Confocal image of a graft in (a) Irf8+/−/Cx3cr1+/−/5xFAD (top), Irf8−/−/Cx3cr1+/−/5xFAD (bottom) and (c) Cx3cr1+/−/5xFAD mouse treated with vehicle (top) or with CSF-1R inhibitor (bottom) immunostained with an antibody against GFAP (red) and DAPI (blue). Scale bar, 50 μm. (b,d) Graphs show mean density (± s.e.m.) of GFAP-positive astrocytes in (b) Irf8/Cx3cr1+/−/5xFAD and in (d) microglia depleted mice. Each symbol represents one graft from n = 4 mice per genotype. Significant differences were determined by the two-tailed Mann–Whitney test. Source data
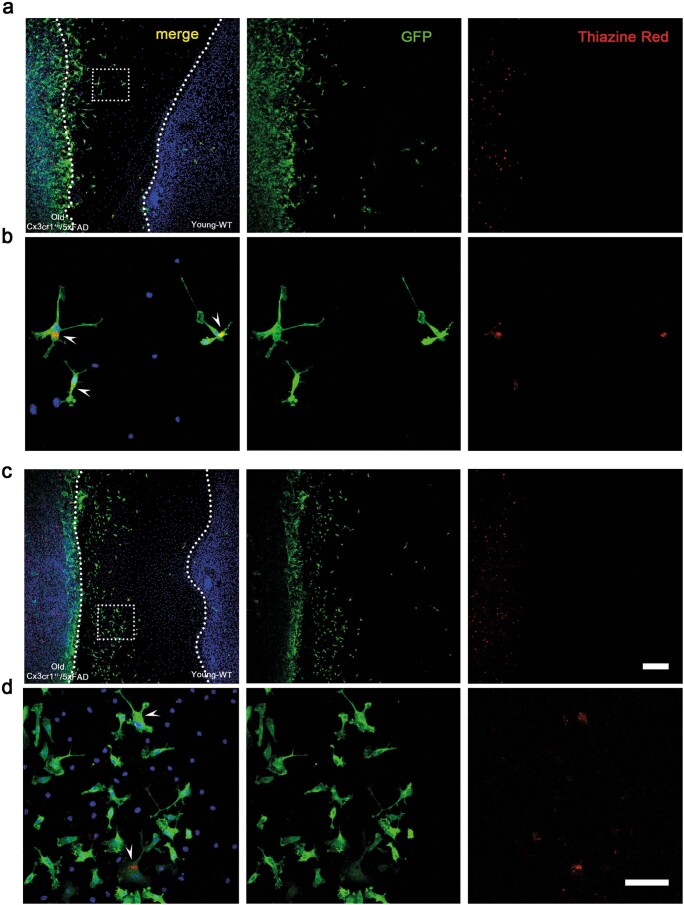
(a-d) Confocal images of co-cultures of organotypic brain slices from aged Cx3cr1+/−/5xFAD and postnatal WT mice. Slices were immunolabelled with GFP (green), Thiazine Red (red) and Hoechst (blue). (a,c) Overview images of two representative co-cultures. Boxed regions in (a, c) are shown with a higher magnification in (b, d) and depict migrating 5xFAD microglia (GFP+) carrying Aβ (Τhiazine Red+) from the aged AD tissue towards the young WT tissue. Scale bars, 200 µm (a, c), 50 µm (b, d). n = 9 co-cultured brain slices from n = 2 mice per genotype.
Comment in
-
Two-faced behavior of microglia in Alzheimer's disease.Nat Neurosci. 2022 Jan;25(1):3-4. doi: 10.1038/s41593-021-00963-w. Nat Neurosci. 2022. PMID: 34815557 No abstract available.
-
Microglia-Mediated Aβ Propagation in Alzheimer's Disease.Neurosci Bull. 2022 Oct;38(10):1274-1276. doi: 10.1007/s12264-022-00907-9. Epub 2022 Jun 21. Neurosci Bull. 2022. PMID: 35729454 Free PMC article. No abstract available.
References
-
- Sosna J, et al. Early long-term administration of the CSF1R inhibitor PLX3397 ablates microglia and reduces accumulation of intraneuronal amyloid, neuritic plaque deposition and pre-fibrillar oligomers in 5XFAD mouse model of Alzheimer’s disease. Mol. Neurodegener. 2018;13:11. doi: 10.1186/s13024-018-0244-x. - DOI - PMC - PubMed
Publication types
MeSH terms
Substances
LinkOut - more resources
Full Text Sources
Molecular Biology Databases
