Comparative Study
. 2021 Dec;22(12):1590-1598.
doi: 10.1038/s41590-021-01073-2. Epub 2021 Nov 22.

High-throughput and high-dimensional single-cell analysis of antigen-specific CD8+ T cells

Affiliations
Comparative Study

High-throughput and high-dimensional single-cell analysis of antigen-specific CD8+ T cells

Ke-Yue Ma et al. Nat Immunol. 2021 Dec.

Abstract

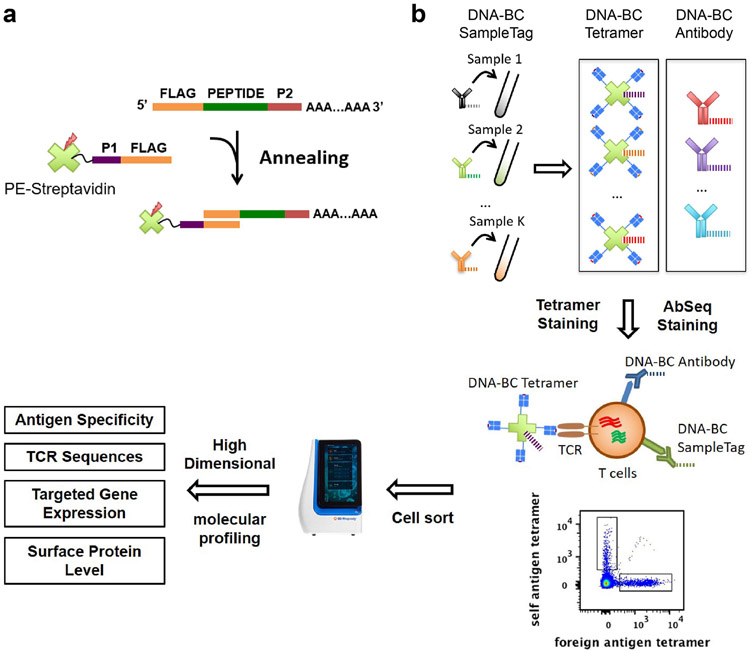
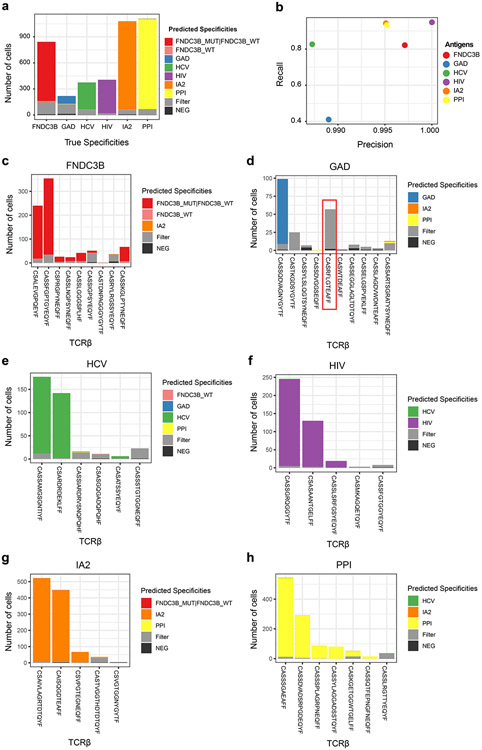
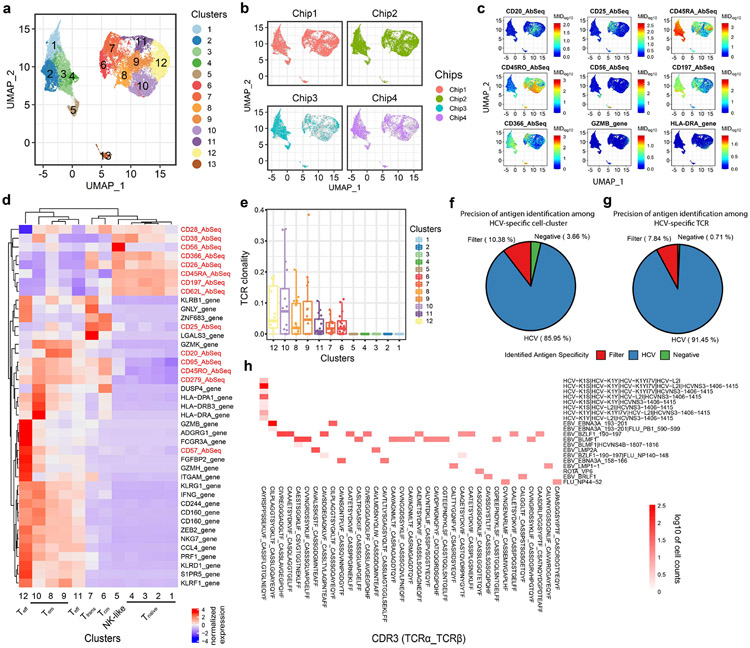
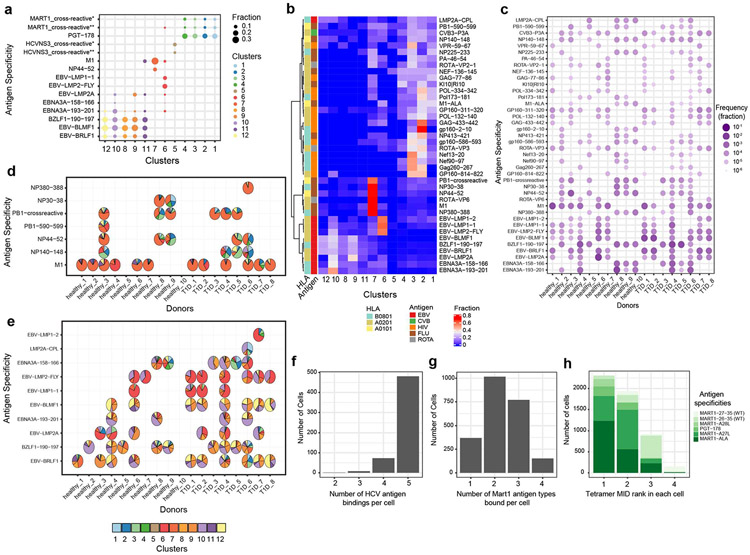
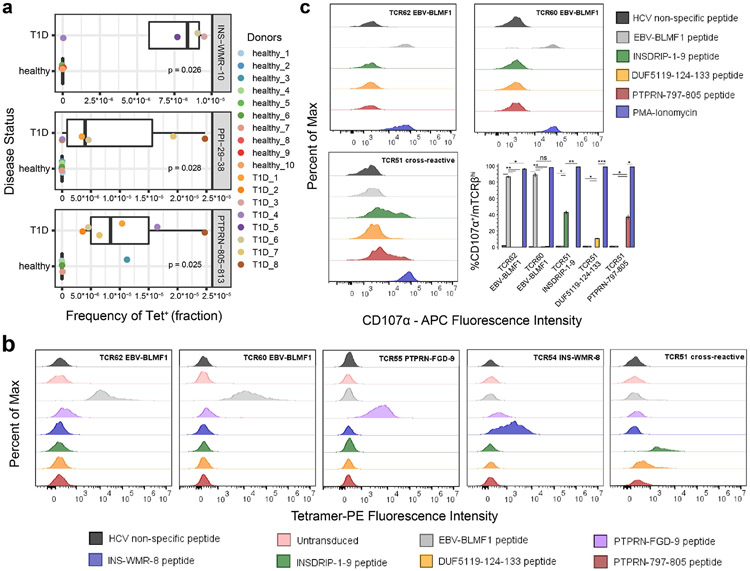
Although critical to T cell function, antigen specificity is often omitted in high-throughput multiomics-based T cell profiling due to technical challenges. We describe a high-dimensional, tetramer-associated T cell antigen receptor (TCR) sequencing (TetTCR-SeqHD) method to simultaneously profile cognate antigen specificities, TCR sequences, targeted gene expression and surface-protein expression from tens of thousands of single cells. Using human polyclonal CD8+ T cells with known antigen specificity and TCR sequences, we demonstrate over 98% precision for detecting the correct antigen specificity. We also evaluate gene expression and phenotypic differences among antigen-specific CD8+ T cells and characterize phenotype signatures of influenza- and Epstein-Barr virus-specific CD8+ T cells that are unique to their pathogen targets. Moreover, with the high-throughput capacity of profiling hundreds of antigens simultaneously, we apply TetTCR-SeqHD to identify antigens that preferentially enrich cognate CD8+ T cells in patients with type 1 diabetes compared to healthy controls and discover a TCR that cross-reacts with diabetes-related and microbiome antigens. TetTCR-SeqHD is a powerful approach for profiling T cell responses in humans and mice.


Figures

Figure 1.
Figure 1.
Schematics of TetTCR-SeqHD workflow. (a) DNA barcode for pMHC tetramer was synthesized with a 3’ polyA tail. Fluorophore labeled streptavidin conjugated with an oligonucleotide sequence complementary to the 5’ end of tetramer DNA barcode was then used to anneal to each unique tetramer DNA barcode to generate barcoded streptavidin. Barcoded streptavidin was further used to form tetramers with peptide loaded MHCs. (b) Each T cell sample was stained with a unique DNA-barcoded anti-CD50 antibody as a SampleTag, a panel of DNA-barcoded pMHC tetramers, and a panel of 59 DNA-barcoded antibodies. Stained cells were sorted and then loaded on BD Rhapsody single sell analysis platform for high-throughput and high-dimensional molecular profiling, including cognate antigen specificity, TCR sequences, targeted gene expression, and surface protein level.
Figure 2.
Figure 2.
TetTCR-SeqHD validation in cultured polyclonal CD8+ T cells. Seven pMHCs were used to sort six groups of polyclonal T cells and expanded in vitro. These included a group of cross-reactive T cells sorted by two similar antigens, FNDC3B_WT and FNDC3B_MUT. TCRβ sequencing was performed for each polyclonal T cell culture using MIDCIRS. These TCRs and their associate antigen specificity were used to assess the recall and precision rates (see Methods) for TetTCR-SeqHD. (a) Fraction of antigen specificities identified in different categories for each of the six polyclonal T cell cultures. True specificities was assigned based on TCRβ sequence found in the TetTCR-SeqHD experiment that matches known TCR sequences from bulk TCRβ sequencing. Cells were classified into the “filter” category based on the criteria described in Methods. (b) The recall and precision rates for each polyclonal T cell culture shown in (a). (c)-(h) Distribution of predicted antigen specificities for each T cell clone within each polyclonal T cell culture. The x-axis for each plot was ranked by TCRβ associated transcript copy numbers from MIDCIRS assay (Left to right, high to low). Red box denotes the contaminant TCR clone in GAD antigen-specific polyclonal culture. Filter category is defined the same as in (a).
Figure 3.
Figure 3.
TetTCR-SeqHD enables combined gene expression, phenotype, and TCR clonality comparison among antigen-specific CD8+ T cells. (a) The UMAP projection of 32,992 single cells sorted from healthy and T1D donors. 13 clusters, including a cluster consisting of HCV spike-in T cell clone, were identified. (b) UMAP projection of single cells from different chips. Grey dots represent all cells and colored dots are cells from different chips. (c) Expression level of seven surface-proteins, CD20, CD25, CD45RA, CD45RO, CD56, CD197 (CCR7), and CD366 (TIM3), and two genes, GZMB and HLA-DRA across single T cells illustrated in (a). (d) Z-score normalized mean expression of differentially expressed genes and surface proteins (by antibodies) in each identified cluster. (e) TCR clonality in 12 primary CD8+ T cell clusters among 18 donors. (f)-(g) Precision of antigen identification among HCV-specific T cell-cluster (cluster13) (f) and HCV-specific TCR bearing cells (g). Cells were classified into “filter” category based on following criteria: 1) more than one antigens bind to single cell, and these antigens are more than 3 amino acid distance away from each other; 2) correlation of tetramer MID between single cell and median of all cells with same TCR sequence is below 0.9, identified as described in Methods. (h) Heatmap for the cognate antigen specificities of the top enriched TCRs (T cell clonality >= 10 cells). Top enriched TCRs are listed in the x-axis and the antigen specificities detected by TetTCR-SeqHD are listed in the y-axis. Colored blocks indicate antigen binding to a particular TCR. White background represents no binding, which was true for most of the TCR-antigen combinations.
Figure 4.
Figure 4.
Gene expression and phenotype analysis of foreign-antigen specific T cells and cross-reactivity validation. (a) The top representative antigen specificities in 12 primary CD8+ T cell clusters (MART1_crossreactive*: MART1-26-35∣MART1-A27L∣MART1-ALA; MART1_crossreactive**: MART1-A27L∣MART1-ALA; HCVNS3_crossreactive*: HCV-K1S∣HCV-K1Y∣HCV-K1YI7V∣HCV-L2I∣HCVNS3-1406-1415;HCVNS3_crossreactive**: HCV-K1S∣HCV-K1Y∣HCV-L2I∣HCVNS3-1406-1415). (b) The distribution of viralantigen specific CD8+ T cells from all 18 donors among 12 primary CD8+ T cells clusters. Fraction was calculated as the fraction of each phenotype cluster among each antigen specificity. (c) Frequency comparison of viralantigen specific T cells in 18 donors (in b,c,d: PB1-crossreactive represents cross-reactivity between PB1-590-599 and PB1-591-599). (d)-(e) Phenotypes distribution of influenza-specific (d) and EBV-specific (e) T cells in each individual. Each pie represents the T cell distribution in 12 phenotypes of primary CD8+ T cells for the corresponding donor (x-axis) and antigen (y-axis) combination. Empty spaces in d and e mean no antigens were detected above the threshold for the corresponding donor-antigen combination (antigen specificities with < 10 cells were excluded in some subjects). (f) Histogram of the number of different types of HCV antigens, WT and variant antigens, bound per cell. (g) Histogram showing the number of different types of Mart1 antigens, WTs and variant antigens, bound per cell. (h) Distributions of tetramer MID ranks of Mart1 WT, variant antigens, and a cross-reactive antigen in each cell for four groups of binding patterns. MART1-27-35: AAGIGILTV (WT), MART1-26-35: EAAGIGILTV (WT), MART1-A28L: ALGIGILTV, MART1-A27L: ELAGIGILTV, MART1-ALA: ALAGIGILTV, PGT-178: LLAGIGTVPI, PGT-178: LLAGIGTVPI.
Figure 5.
Figure 5.
Identification of three T cell specificities selectively enriched in T1D patients and TCR specificity and cross-reactivity validation. (a) Three T1D-related antigens (INS-WMR-10, PPI-29-38, and PTPRN-805-813) were identified to have a significantly higher frequency of cognate T cells in the peripheral blood of T1D patients compared to healthy donors. Wilcoxon signed-rank test was performed. (b) TCR specificity and cross-reactivity validation by pMHC tetramer staining. Five TCRs that were identified to recognize six different antigens in complex with distinct HLA alleles, including TCR51 that recognized three unrelated antigens, were transduced into human primary CD8+ T cells and stained with respective cognate pMHC tetramers or other pMHC tetramers. The percentage of Tetramer+ was gated on TCRβhi fraction of the cells. Statistic comparisons are listed in Supplementary Figure 13. HLA-A02:01: EBV-BLMF1, INSDRIP-1-9, DUF5119-124-133, PTPRN-797-805; HLA-B08:01: INS-WMR-8; HLA-A01:01: PTPRN-FGD-9. (c) TCR specificity and cross-reactivity validation by T cell functionality. The HLA-A02:01 restricted TCR transduced cells generated in (b) were further stimulated with respective cognate pMHC tetramers or other pMHC tetramers. The percentage of CD107α+ was measured on TCRβhi fraction of the cells. Experiments in (b) and (c) were performed in triplicates. Two-tailed student’s t-test was performed. EBV-BLMF1: GLCTLVAML; INSDRIP-1-9: MLYQHLLPL; DUF5119-124-133: MVWGPDPLYV; PTPRN-797-805: MVWESGCTV; INS-WMR-8: WMRLLPLL; PTPRN-FGD-9: FGDHPGHSY. ns, not significant; *, p ≤ 0.05; **, p ≤ 0.01; ***, p ≤ 0.001; ****, p ≤ 0.0001.

References

    1. Davis MM & Boyd SD Recent progress in the analysis of alphabetaT cell and B cell receptor repertoires. Curr Opin Immunol 59, 109–114 (2019). - PMC - PubMed
    1. Pulendran B & Davis MM The science and medicine of human immunology. Science 369 (2020). - PMC - PubMed
    1. Satpathy AT et al. Transcript-indexed ATAC-seq for precision immune profiling. Nat Med 24, 580–590 (2018). - PMC - PubMed
    1. Stoeckius M et al. Simultaneous epitope and transcriptome measurement in single cells. Nat Methods 14, 865–868 (2017). - PMC - PubMed
    1. Peterson VM et al. Multiplexed quantification of proteins and transcripts in single cells. Nature Biotechnology 35, 936 (2017). - PubMed

Publication types

MeSH terms

LinkOut - more resources