Comparative Study
. 2021 Dec;22(12):1563-1576.
doi: 10.1038/s41590-021-01064-3. Epub 2021 Nov 22.

Disrupting Roquin-1 interaction with Regnase-1 induces autoimmunity and enhances antitumor responses

Affiliations
Comparative Study

Disrupting Roquin-1 interaction with Regnase-1 induces autoimmunity and enhances antitumor responses

Gesine Behrens et al. Nat Immunol. 2021 Dec.

Abstract

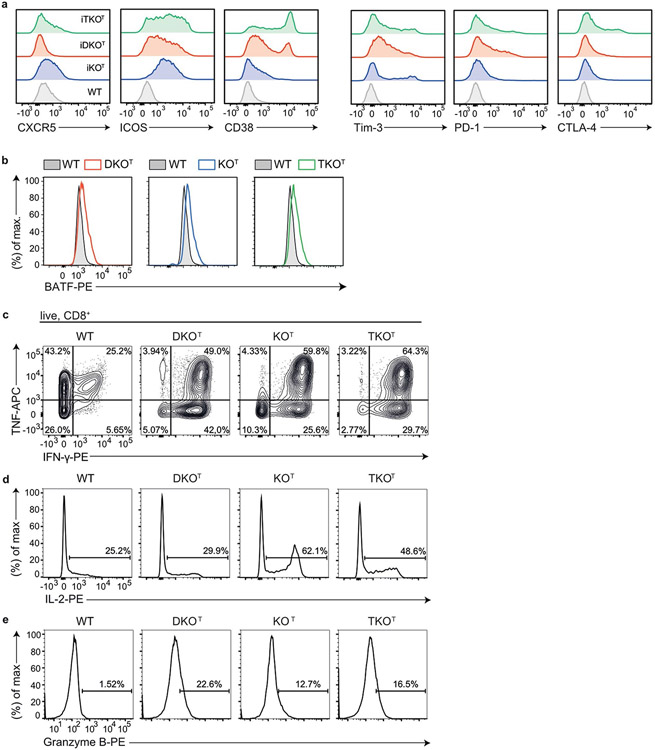
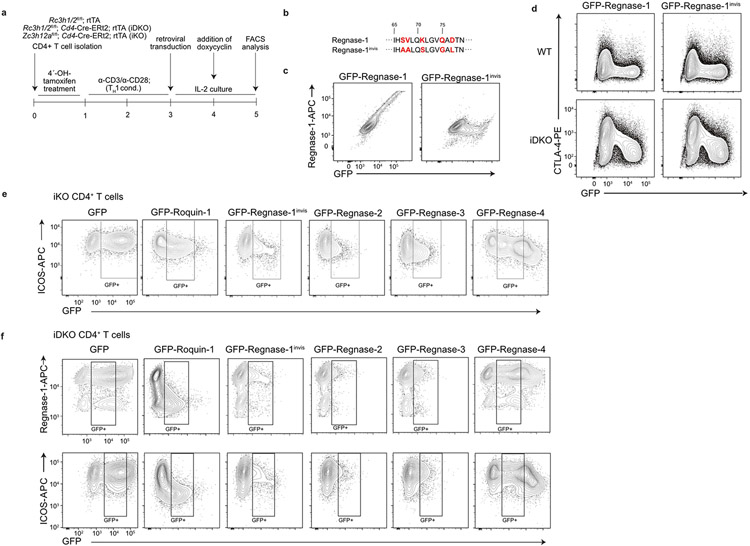
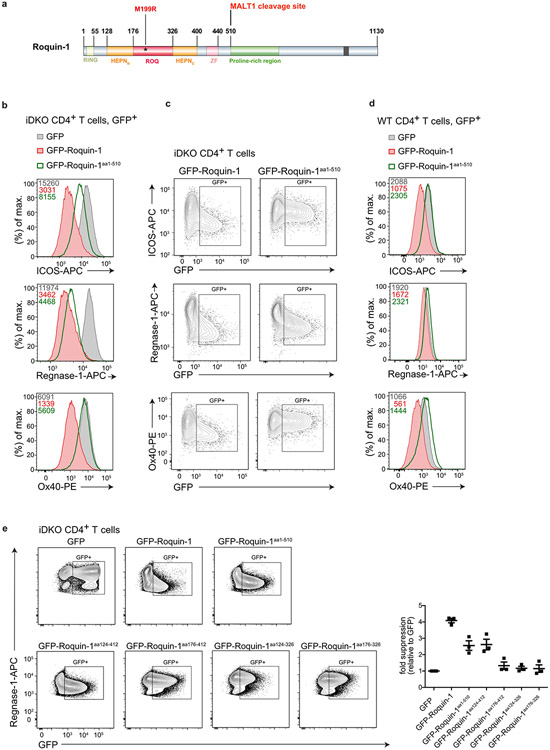
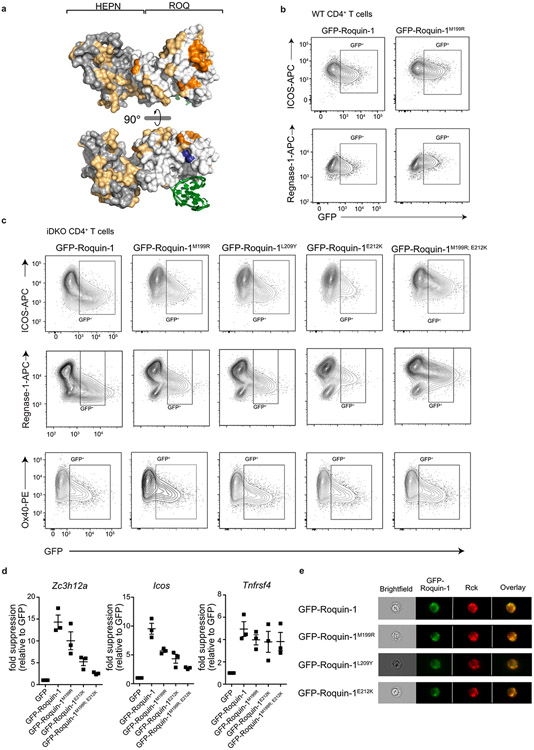
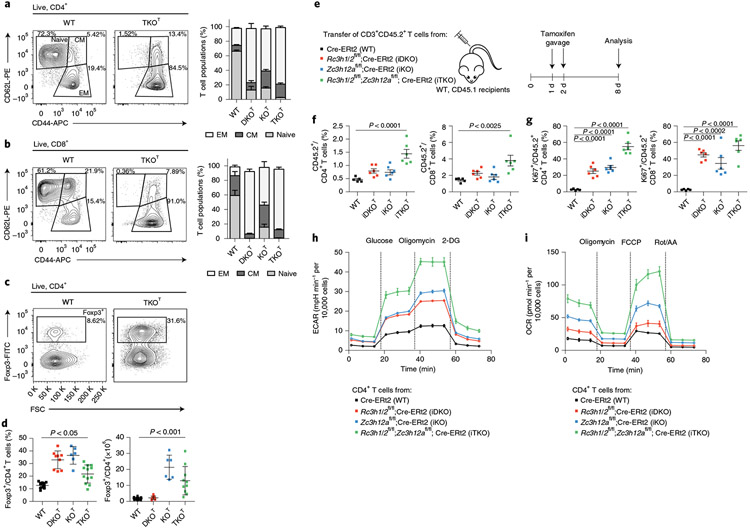
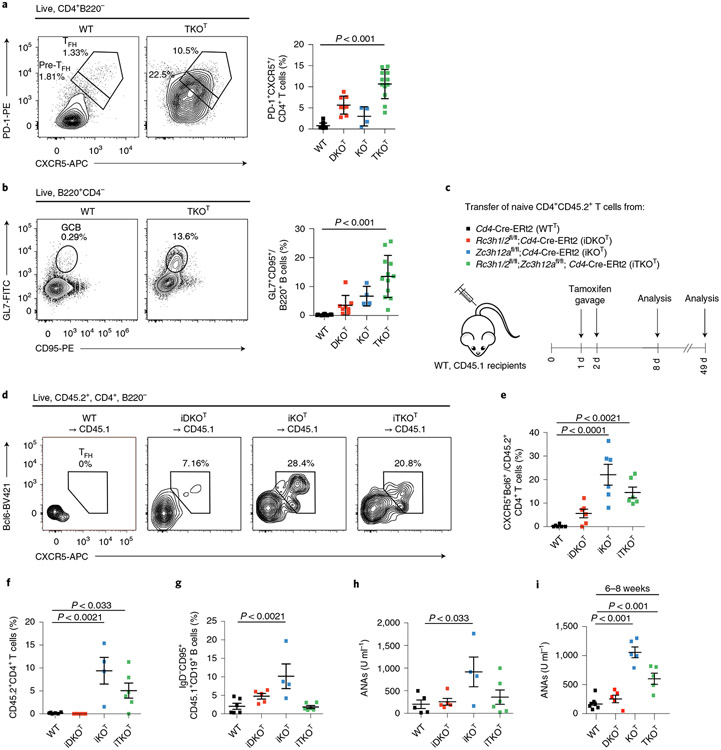
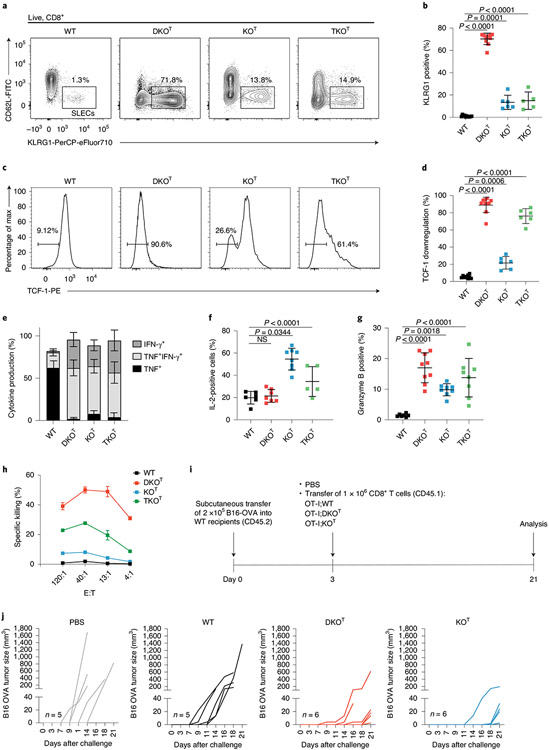
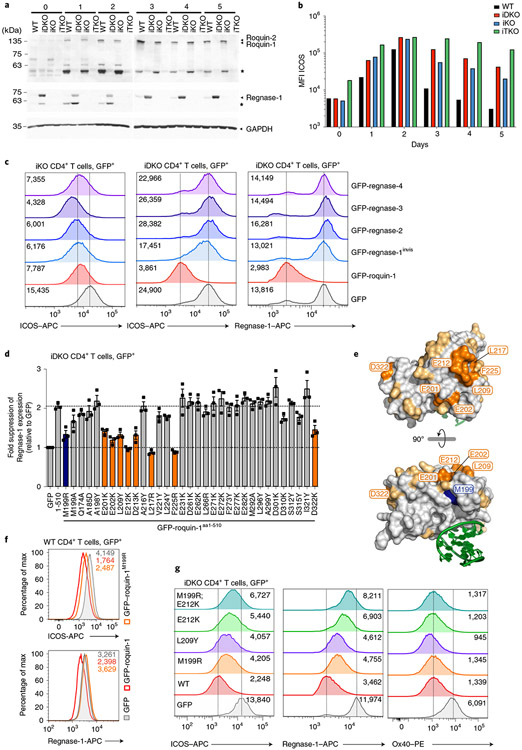
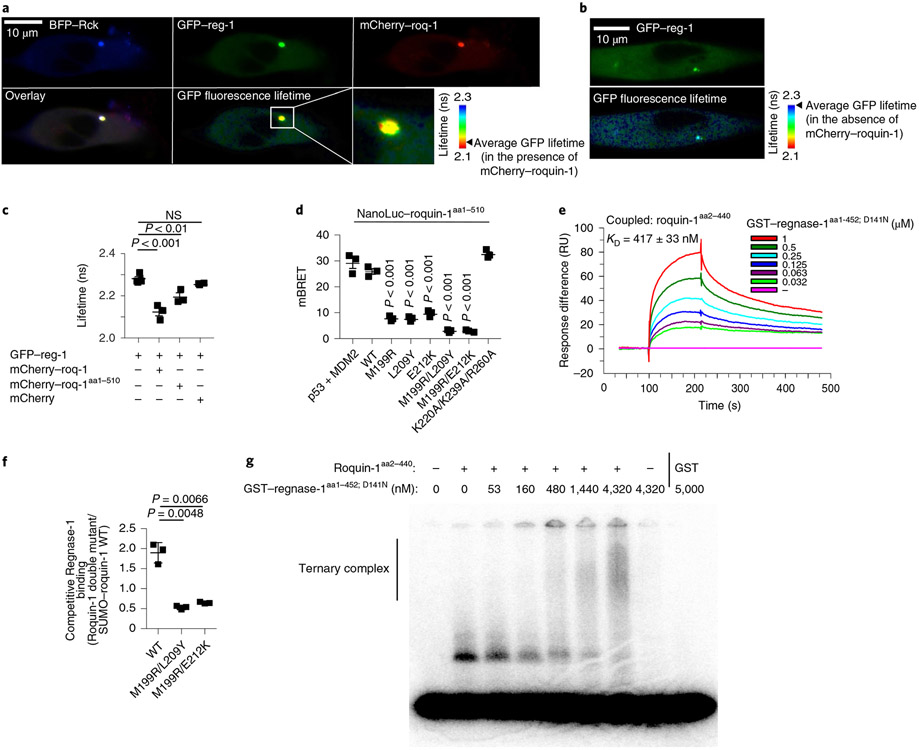
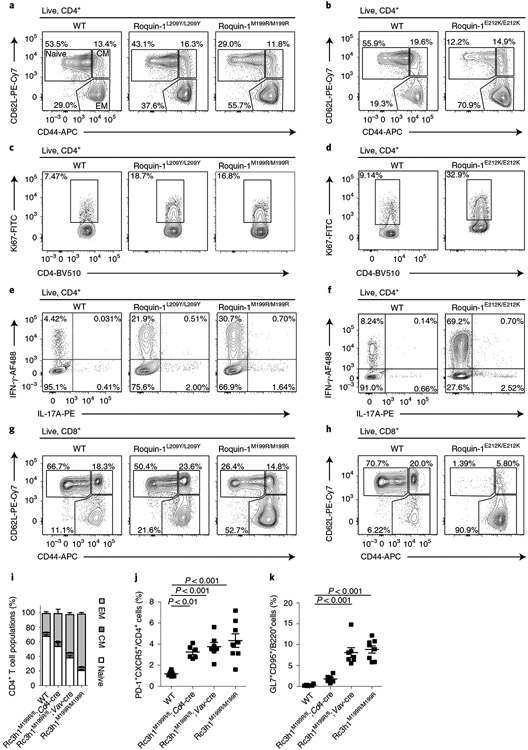
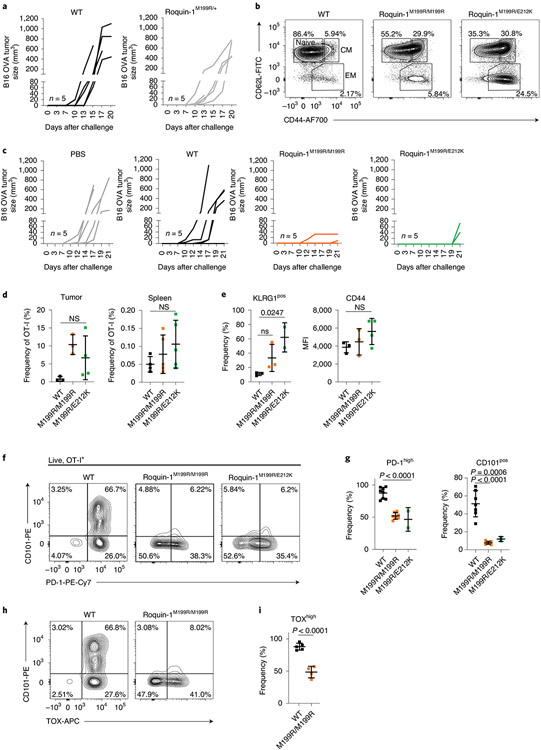
Roquin and Regnase-1 proteins bind and post-transcriptionally regulate proinflammatory target messenger RNAs to maintain immune homeostasis. Either the sanroque mutation in Roquin-1 or loss of Regnase-1 cause systemic lupus erythematosus-like phenotypes. Analyzing mice with T cells that lack expression of Roquin-1, its paralog Roquin-2 and Regnase-1 proteins, we detect overlapping or unique phenotypes by comparing individual and combined inactivation. These comprised spontaneous activation, metabolic reprogramming and persistence of T cells leading to autoimmunity. Here, we define an interaction surface in Roquin-1 for binding to Regnase-1 that included the sanroque residue. Mutations in Roquin-1 impairing this interaction and cooperative regulation of targets induced T follicular helper cells, germinal center B cells and autoantibody formation. These mutations also improved the functionality of tumor-specific T cells by promoting their accumulation in the tumor and reducing expression of exhaustion markers. Our data reveal the physical interaction of Roquin-1 with Regnase-1 as a hub to control self-reactivity and effector functions in immune cell therapies.


Figures

Extended Data Fig. 1 ∣
Extended Data Fig. 1 ∣. Roquin-1/2 and Regnase-1 maintain quiescence of T cells.
(a, b) Analysis of mixed bone marrow chimeric mice using either WT (CD45.2) and WT (CD45.1) or TKOT (CD45.2) and WT (CD45.1) bone marrow cells injected into lethally irradiated CD45.1/2 recipient mice. Flow cytometry analysis of CD45.1 and CD45.2 cell populations (a) or Treg cells (b) in splenocytes from recipient mice 9 weeks after reconstitution (WT CD45.1/WT CD45.2 recipients: n = 2, WT CD45.1/TKO CD45.2 recipients: n = 3, analyzed in one experiment). (c) H&E sections of lungs showing alveoli from WT, DKOT, KOT and TKOT mice at the age of 6-8 weeks (Representative data of n ≥3 individual mice). (d, e) Analysis of CD45.2+ CD3+ T cells from Cre-ERt2 (WT), Rc3h1/2fl/fl; Cre-ERt2 (iDKO), Zc3h12afl/fl; Cre-ERt2 (iKO) and Rc3h1/2fl/fl; Zc3h12afl/fl; Cre-ERt2 (iTKO) mice that were adoptively transferred into WT CD45.1+ mice. Recipient mice were treated with tamoxifen by oral gavage to induce deletion of floxed alleles. On day 8 post transfer, T cells were analyzed for their ability to acquire an effector/memory phenotype (d) or to proliferate (e) within the host (n = 6 biological replicates).
Extended Data Fig. 2 ∣
Extended Data Fig. 2 ∣. Roquin-1/2 and Regnase-1 control metabolism and humoral autoimmunity.
CD4+ (a–e) or CD8+ (f, g) T cells from Cre-ERt2 (WT), Rc3h1/2fl/fl; Cre-ERt2 (iDKO), Zc3h12afl/fl; Cre-ERt2 (iKO) and Rc3h1/2fl/fl; Zc3h12afl/fl; Cd4-Cre-ERt2 (iTKO) were treated with 4′-OH tamoxifen in vitro to induce deletion of floxed alleles. T cells were activated in vitro and expanded with IL-2 medium for 2d. IL-2 was withdrawn overnight before T cells were restimulated with anti-CD3/28 prior to glycolytic (a, b, f) and mitochondrial stress tests (c–e, g). Shown are calculated ratios for ECAR (mpH/min/10000 cells) (a–c) and OCR (pmol/min/10000 cells) (d–e) relative to WT, respectively. Naïve CD45.2+ CD4+ T cells from Cd4-Cre-ERt2 (WT), Rc3h1/2fl/fl; Cd4-Cre-ERt2 (iDKO), Zc3h12afl/fl; Cd4-Cre-ERt2 (iKO) and Rc3h1/2fl/fl; Zc3h12afl/fl; Cd4-Cre-ERt2 (iTKO) mice were adoptively transferred into CD45.1+ recipient mice. Mice were treated with tamoxifen by oral gavage to induce deletion of floxed alleles. Adoptively transferred cells were identified by congenic markers on day 8 (h) or accumulation of germinal center B (i) or plasma cells (j) was determined on day 49 after induced deletion. (a–e) Data are presented as mean +/− SD of n = 3 biological replicates analyzed over 3 independent experiments, (f, g) representative of 3 independent experiments, (h) n = 6 analyzed mice, or (i, j) WT: n = 6, iDKO: n = 5, iKO: n = 4, iTKO: n = 6 in 2 independent experiments. Statistical significance was calculated by one-way ANOVA with Dunnett’s post-hoc test.
Extended Data Fig. 3 ∣
Extended Data Fig. 3 ∣. Describing phenotypes of DKOT, KOT and TKOT CD8+ T cells.
Flow cytometry analysis of markers of activation and exhaustion (a) and BATF transcription factor expression (b) in splenic WT, DKOT, KOT and TKOT CD8+ T cells. Data are representative of at least 5 individual 6-12 week old mice per genotype in at least two independent experiments. Flow cytometry analysis to Fig. 3e, f: intracellular cytokine staining of IFN-γ, TNF (c) and IL-2 (d) after PMA/ionomycin stimulation in CD8+ T cells of splenocytes from WT, DKOT, KOT and TKOT mice for 4 h. Histogram analysis to Fig. 3g: Granzyme B expression in splenic WT, DKOT, KOT and TKOT CD8+ T cells (e).
Extended Data Fig. 4 ∣
Extended Data Fig. 4 ∣. Regnase paralogs cannot complement for Roquin loss of function.
(a) Workflow of in vitro reconstitution experiments. (b) Mutations introduced in Regnase-1 coding sequence (marked in red) for the generation of an antibody-invisible GFP-tagged Regnase-1 construct (GFP-Regnase-1invis). (c) Flow cytometry analysis of Regnase-1 expression after retroviral transduction of WT CD4+ T cells with GFP-Regnase-1 or GFP-Regnase-1invis constructs. (d) WT or iDKO CD4+ T cells were retrovirally transduced with GFP–Regnase-1 or GFP-Regnase-1invis. Contour plots of flow cytometry analysis of CTLA-4 expression in dependence of the GFP expression level. (e, f) Flow cytometry analysis of ICOS or Regnase-1 expression after retroviral transduction of iKO or iDKO CD4+ T cells with the indicated GFP-fusion protein. Contour plots of histograms shown in Fig. 4c. (d–f) Data are representative of n = 3 independent experiments.
Extended Data Fig. 5 ∣
Extended Data Fig. 5 ∣. Dissecting protein domains of Roquin-1 sufficient for cooperative target regulation with Regnase-1.
(a) Schematic representation of Roquin-1 domain organization with indication of M199R mutation. iDKO (b, c) or WT (d) CD4+ T cells were retrovirally transduced with GFP, GFP-Roquin-1 or GFP-Roquin-1aa1-510 constructs. Histograms of flow cytometry analysis of ICOS, Regnase-1 or Ox40 expression, as indicated, in GFP+ cells with indication of respective geometric MFI value. (c) Contour plots of histograms depicted in (b). (e) iDKO CD4+ T cells were retrovirally transduced with the constructs encoding GFP, GFP-Roquin-1 or GFP-Roquin-1 mutant proteins. Flow cytometry analysis of Regnase-1 expression and quantification of fold suppression of Regnase-1 expression level in GFP+ cells relative to cells expressing GFP control construct. (b–e) Data are representative of n = 3 independent experiments. (e) Data are presented as mean +/− SEM of n = 3 independent experiments.
Extended Data Fig. 6 ∣
Extended Data Fig. 6 ∣. Functional validation of point mutations in Roquin-1 that reduce cooperation with Regnase-1.
(a) Structure of the Roquin-1 HEPNN/ROQ/HEPNC domain with a bound RNA stem-loop marked in green. All amino acids tested are colored, essential amino acids for Roquin-1 and Regnase-1 interaction in the ROQ domain are marked in orange, non-essential ones in yellow and amino acid M199 in blue. WT (b) or iDKO (c) CD4+ T cells were retrovirally transduced with GFP, GFP-Roquin-1 or the indicated GFP-Roquin-1 mutants. Contour plots of flow cytometry measurement of indicated targets in GFP+ cells after 16 h of doxycycline induction of GFP-tagged constructs. (b) Contour plots of histograms shown in Fig. 4f or (c) shown in Fig. 4g. (d) iDKO CD4+ T cells were retrovirally transduced with GFP, GFP-Roquin-1 or the indicated GFP-Roquin-1 mutants and sorted for GFP+ cells 6 h after doxycycline induced expression of the respective constructs. The levels of Zc3h12a, Icos or Tnfrsf4 mRNAs in GFP+ cells were determined via RT-qPCR, normalized to YWHAZ and calculated as fold suppression of the respective construct relative to cells expressing the GFP control construct. Data show mean +/− SEM of n = 3 independent experiments. (e) Representative images of iDKO CD4+ T cells transduced with the indicated GFP-Roquin-1 WT or mutant proteins, stained with anti-Rck (P-body marker) antibody and analyzed via Image Stream. (b, c) Data are representative of n = 3 independent experiments or (e) n = 2 independent experiments.
Extended Data Fig. 7 ∣
Extended Data Fig. 7 ∣. Molecular determinants of Roquin-1 interaction with Regnase-1.
(a) Lysates of WT or iKO CD4+ T cells were subjected to immunoprecipitation (IP) with antibodies against Regnase-1. Input lysates before IP and eluates from beads after IP were analyzed in immunoblots with antibodies against Roquin-1 or Regnase-1. (b, d) Fluorescence microscopy images of HeLa cells transfected with BFP-Rck and GFP-Regnase-1 (GFP-Reg-1) and stained with ER staining dye (b), or of cells transfected with GFP-Regnase-1aa112-297 and mCherry-Roquin-1aa1-510 (d). Quantification of GFP fluorescence lifetime in the cytoplasm (cyto) and nucleus (nuc) (e) of transfected cells shown in (d). (c) Cytoplasmic lysates of CD4+ T cells were fractionated after sucrose gradient centrifugation and distribution of Roquin, Regnase-1 and Rpl7a proteins in the individual fractions analyzed via immunoblots, as indicated. Above, representative absorbance profile obtained during fractionation of gradients with indication of localization of 40 S and 60 S ribosomal subunits, 80 S monosomes and polysomes. (f, g) SDS-PAGE of competitive in vitro GST-pulldown experiments using GST-regnase-1D141N and SUMO-roquin-1aa2-440 in combination with the indicated untagged Roquin-1aa2-440 double or single mutants. Purified proteins before pulldown (IN), supernatants of wash steps (W) as well as eluted proteins (E) were loaded. Asterisks mark the migration of degradation products of GST-regnase-1. (h) Quantification of eluted mutant Roquin-1aa2-440 relative to SUMO-roquin-1aa2-440 wild-type protein of in vitro GST-pulldown experiments depicted in (g). (b, d, f, g) Depicted are representative data of n = 3 independent experiments or (a, c) of n = 2 independent experiments. (e) Data are presented as mean +/− SEM or (h) mean +/− SD and (h) statistical significance was calculated using t tests.
Extended Data Fig. 8 ∣
Extended Data Fig. 8 ∣. Phenotypes of mice with mutations impairing Roquin-1 interaction with Regnase-1.
Contour plots of flow cytometry analysis of CD4+ T cells (a), TFH cells (b) and GC B cells (c) from spleens of 9-14 weeks old WT, Rc3h1M199R/fl;Cd4-Cre, Rc3h1M199R/fl;Vav-Cre and Rc3h1M199R/M199R mice. Contour plots are representative of WT, Rc3h1M199R/M199R: n = 6, Rc3h1M199R/fl; Cd4-Cre, Rc3h1M199R/fl; Vav-Cre: n = 5 (a), or WT, Rc3h1M199R/M199R: n = 8, Rc3h1M199R/fl; Cd4-Cre: n = 6, Rc3h1M199R/fl; Vav-Cre: n = 7 (b, c) analyzed mice in at least 3 independent experiments.
Extended Data Fig. 9 ∣
Extended Data Fig. 9 ∣. Exemplary gating strategy.
Cells were pregated on lymphocytes (FSC-A/SSC-A), single cells (SSC-H/SSC-W and FSC-H/FSC-W) and live cells (Fixable blue -) prior to gating on cell populations of interest.
Fig. 1 ∣
Fig. 1 ∣. Roquin-1/2 and Regnase-1 maintain quiescence of T cells.
a–d, Flow cytometry analysis of CD4+ (a), CD8+ (b) subpopulations (WT, n = 9; DKOT and KOT, n = 6; TKOT, n = 5 mice analyzed in at least three independent experiments) and Treg cells (c,d) (WT, n = 15; DKOT, n = 9; KOT, n = 6; TKOT, n = 10 mice analyzed in at least three independent experiments) from spleens of 6–8-week-old WT, DKOT, KOT and TKOT mice. CM, central memory; EM, effector memory; WT, wild type. e, CD45.2+CD3+ T cells from WT, iDKO, iKO and iTKO mice were adoptively transferred into WT CD45.1+ mice. Mice were treated with tamoxifen by oral gavage to induce deletion of floxed alleles. f,g, Frequency (f) and proliferation (g) of CD45.2+, CD4+ and CD45.2+, CD8+ T cells were analyzed by flow cytometry on day 8 after transfer (n = 6 biological replicates). h,i, CD4+ T cells from WT, iDKO, iKO and iTKO mice were treated with 4′-OH-tamoxifen in vitro to induce deletion of floxed alleles. T cells were kept under type 1 helper T cell conditions and expanded with IL-2-containing medium for 2 d. IL-2 was withdrawn overnight followed by restimulation with anti-CD3/28 before glycolytic (h) and mitochondrial stress testing (i) (n = 3 independent experiments). 2-DG, 2-deoxyglucose; Rot, rotenone; AA, antimycin. Data are presented as mean ± s.e.m., analyzed by one-way analysis of variance (ANOVA) with Bonferroni (d) or Dunnett’s (f,g) post hoc test.
Fig. 2 ∣
Fig. 2 ∣. Roquin-1/2 and Regnase-1 control TFH differentiation and humoral autoimmunity.
a,b, Flow cytometry analysis of TFH (a) and GC B cell (b) subpopulations from spleens of 6–8-week-old WT, DKOT, KOT and TKOT mice (WT, n = 14; DKOT, n = 8; KOT, n = 4; TKOT, n = 12 analyzed mice in at least three independent experiments). c, Naive CD45.2+CD4+ T cells from WT, iDKO, iKO and iTKO mice were adoptively transferred into congenic WT CD45.1 mice. Mice were treated with tamoxifen by oral gavage to induce deletion of floxed alleles. d,e, Adoptively transferred T cells were analyzed by flow cytometry for markers of TFH cell differentiation on day 8 after transfer (n = 6 biological replicates). f–h, Frequencies of adoptively transferred WT, iDKO, iKO and iTKO CD45.2+CD4+ T cells (f), frequencies of recipient GC B cells (g) as well as levels of ANAs in the sera of recipient mice (h) were determined on day 49 after transfer (WT, n = 6; iDKO, n = 5; iKO, n = 4; iTKO, n = 6). i, ANAs in the serum of 6–8-week-old WT, DKOT, KOT and TKOT mice (WT, n = 7; DKOT, KOT and TKOT, n = 5 analyzed mice in three independent experiments). All data are presented as mean ± s.e.m. Statistical significance was calculated by one-way ANOVA with Bonferroni post hoc test (a,b) or Dunnett’s post hoc test (e–i).
Fig. 3 ∣
Fig. 3 ∣. Inactivation of Roquin-1/2 or Regnase-1 in CD8+ T cells enhances cytotoxicity.
a–d, Flow cytometry analysis of splenic WT, DKOT, KOT and TKOT CD8+ T cells for KLRG1 and CD62L expression (a), frequencies of SLEC CD8+ T cells (WT, n = 11; iDKO, n = 10; iKO, n = 6; iTKO, n = 5 individual mice in three independent experiments) (b) and percentage of cells with TCF-1 downregulation (WT, n = 9; iDKO, n = 10; iKO, n = 6; iTKO, n = 6 individual mice in three independent experiments) (c,d). e,f, Quantification of intracellular cytokine staining of IFN-γ, TNF (WT, n = 9; iDKO, n = 9; iKO, n = 11; iTKO, n = 5 individual mice in three independent experiments) (e) and IL-2 (WT, n = 6; iDKO, n = 7; iKO, n = 8; iTKO, n = 5 individual mice in three independent experiments) (f) in CD8+ T cells after PMA/ionomycin stimulation for 4 h. NS, not significant. g, Quantification of granzyme B-positive CD8+ T cells (WT, n = 7; iDKO, n = 11; iKO, n = 8; iTKO, n = 9 individual mice in four independent experiments) in spleens from WT, DKOT, KOT and TKOT mice. h, Chromium-release assay of P815 cells cultivated in effector to target ratios as indicated 4 h after adding splenic CD8+ T cells isolated from WT, DKOT, KOT and TKOT mice (n = 2 individual mice in one experiment). i, Schematic representation of the experimental set-up of the B16-OVA tumor model. j, B16-OVA tumor growth without transfer (PBS control n = 5) or after transfer of either WT (n = 5), DKOT or KOT OT-I T cells (n = 6 individual mice in one experiment). Data are presented as mean ± s.e.m. Statistical significance was calculated by one-way ANOVA with Dunnett’s post hoc test.
Fig. 4 ∣
Fig. 4 ∣. Functional definition of Roquin-1 interaction with Regnase-1.
a,b, WT, iDKO, iKO and iTKO CD4+ T cells were deleted in vivo by tamoxifen gavage, activated in vitro with anti-CD3/28 under TH1 cell conditions (days 0–2) and cultivated in medium containing IL-2 (days 3–5). For each day, expression of Roquin-1/Roquin-2, Regnase-1 and GAPDH (a) or ICOS (b) was analyzed by immunoblot or flow cytometry, respectively. Asterisks mark MALT1 cleavage fragments of Roquin-1 and Regnase-1 (a). MFI, mean fluorescence intensity. c,d CD4+ T cells of indicated genotypes were retrovirally transduced with GFP, GFP–roquin-1, GFP–regnase-1invis, GFP–regnase-2, GFP–regnase-3, GFP–regnase-4 (c) or with GFP, GFP–roquin-1aa1-510 and ROQ mutants introduced into GFP–roquin-1aa1-510 (d). Histograms of ICOS and Regnase-1 expression in GFP+ cells with indication of the respective geometric MFI (gMFI) values (c) or fold suppression of Regnase-1 expression in GFP+ cells transduced with the indicated construct relative to cells transduced with GFP only calculated using gMFI (d). e, Structure of the Roquin-1 ROQ domain with a bound RNA stem loop marked in green, amino acid M199 marked in blue, amino acids essential for Roquin-1 and Regnase-1 functional interaction marked in orange and tested nonessential amino acids in yellow. f,g, WT (f) or iDKO (g) CD4+ T cells were retrovirally transduced with GFP, GFP–roquin-1 or the indicated GFP–roquin-1 mutants. Histograms of ICOS, Regnase-1 and Ox40 expression in GFP+ cells with indication of the respective gMFI. Data are representative of n = 3 independent experiments (a–c,f,g) and are presented as mean ± s.e.m. of n = 3 independent experiments (d).
Fig. 5 ∣
Fig. 5 ∣. Molecular determinants of Roquin-1 interactions with Regnase-1.
a–c, HeLa cells were co-transfected with BFP–Rck, GFP–regnase-1 (GFP–reg-1) together with mCherry–roquin-1 (mCherry–roq-1), mCherry–roquin-1aa1-510 or mCherry (a,c) or with GFP–regnase-1 alone (b). Protein localization (a,b), FRET efficiency (GFP–regnase-1 in combination with mCherry 0.67%, mCherry–roq-1 6.6% or mCherry–roq-1aa1-510 3.91%) and lifetime of GFP fluorescence (c) was analyzed via fluorescence lifetime microscopy. d, HEK293T cells were transfected with HaloTag–regnase-1 in combination with the indicated NanoLuc–roquin-1aa1-510 expression plasmids and NanoBret ratio (mBRET) was calculated after measuring NanoLuc and HaloTag signals via NanoBret assay. e, SPR signals after addition of GST–regnase-1aa1-452;D141N to Biacore-chip-immobilized Roquin-1aa2-440. RU, resonance units. f, Competitive in vitro GST-pulldown experiment using GST–regnase-1D141N and wild-type SUMO–roquin-1aa2-440 in combination with the indicated Roquin-1aa2-440 double mutants (untagged). Quantification of eluted Roquin-1aa2-440 mutant relative to SUMO–roquin-1aa2-440 wild-type protein of SDS–PAGE depicted in Extended Data Fig. 7f. g, EMSA using a Zc3h12a 3′-UTR RNA fragment (nt194–212), Roquin-1aa2-440 (320 nM) in combination with increasing levels of GST–regnase-1aa1-452; D141N. Presumably due to inclusion of unlabeled competitor RNA, recognition of the Zc3h12a mRNA stem loop by Regnase-1 could not be detected. Representative data of n = 3 independent experiments (a,b,e,g). Data are presented as mean ± s.e.m. of n = 3 independent experiments (c,d) or mean ± s.d. of n = 3 independent experiments (f). Statistical significance was calculated using one-way ANOVA with Bonferroni post hoc test (c,d) or Student’s t-tests (f).
Fig. 6 ∣
Fig. 6 ∣. Inhibition of Roquin-1 interaction with Regnase-1 breaks T cell quiescence.
a–h, CD4+ and CD8+ T cells from mice with L209Y and M199R mutations (10–12 weeks old) or from mice with E212K mutations (8 weeks old) in Roquin-1 were characterized. CD4+ effector/memory populations (a,b), CD4+ T cell proliferation (c,d), ability of CD4+ T cells to produce IFN-γ and IL-17 after PMA/ionomycin stimulation ex vivo (e,f) or CD8+ effector/memory populations (g,h) were compared. i–k, Frequencies of CD4+ effector/memory T cell populations (i), TFH cells (j) and GC B cells (k) from spleens of 9–14-week-old WT, Rc3h1M199R/fl;Cd4-Cre, Rc3h1M199R/fl;Vav-Cre and Rc3h1M199R/M199R (sanroque) mice were determined by flow cytometry. Contour plots are representative of n = 4 biological replicates analyzed in at least two independent experiments (a,c,e,g) or n = 2 biological replicates in two independent experiments (b,d,e,h). Data are presented as mean ± s.e.m. of WT, Rc3h1M199R/M199R, n = 6; Rc3h1M199R/fl, Cd4-Cre, Rc3h1M199R/fl, Vav-Cre, n = 5 (i) or WT, Rc3h1M199R/M199R, n = 8; Rc3h1M199R/fl, Cd4-Cre, n = 6; Rc3h1M199R/fl, Vav-Cre, n = 7 (j,k) analyzed mice in at least three independent experiments. Statistical significance was calculated by one-way ANOVA with Bonferroni post hoc test (j,k).
Fig. 7 ∣
Fig. 7 ∣. Combined heterozygosity of Roquin-1E212K/M199R shows a synthetic phenotype.
a–d,f–h, T and B cells from 10–12-week-old mice with the M199R mutation in Roquin-1 on one allele and L209Y, E212K or M199R mutations on the other allele were characterized. Frequencies of CD4+ T cell populations (a,b), TFH cells (c,d), immunofluorescence of GL7 (blue) and IgD (yellow) in spleen sections (e), frequencies of GC B cells (f,g) and levels of ANAs in sera determined by ELISA (h). Contour plots or immunofluorescence microscopy images are representative of at least three individual mice analyzed in at least two independent experiments (a,c,e,f). WT, n = 26; M199R/M199R, n = 6; M199R/L209Y, n = 3; M199R/E212K, n = 3; L209Y/L209Y, n = 14; E212K/E212K, n = 2; M199R/+, n = 3; L209Y/+, n = 2; E212K/+, n = 1 (b,d,g,h). Data are shown as mean ± s.e.m. Statistical significance was determined using one-tailed Student’s t-tests. Representative images of n = 3 analyzed mice per genotype (e).
Fig. 8 ∣
Fig. 8 ∣. Disrupting Roquin-1 interaction with Regnase-1 improves effector function of tumor-specific T cells.
a,c, Analysis of tumor growth of B16-OVA after transfer of OT-I T cells as described in Fig. 3i and with the indicated genotypes (n = 5 individual mice in one experiment, respectively). b, Flow cytometry analysis of activation markers CD44 and CD62L on OT-I T cells before transfer. d, Frequencies of OT-I T cells relative to all + cells are displayed for tumor and spleen at day 21 after tumor cell transfer. e–i, Flow cytometry analysis of KLRG-1, CD44, CD101, PD-1 and TOX on OT-I T cells in the tumor on day 21 after tumor cell transfer. Data are representative of WT, n = 4; M199R/M199R, n = 5; M199R/E212K, n = 5 individual mice analyzed in one experiment (d). Data are representative of WT, n = 3; M199R/M199R, n = 3; M199R/E212K, n = 2 or 4 each individual mice analyzed in one experiment (e). Data are representative of WT, n = 7; M199R/M199R, n = 7; M199R/E212K, n = 2 individual mice in three independent experiments (g). Data are representative of WT, n = 5 and M199R/M199R, n = 4 individual mice in two independent experiments (h). Data are presented as mean ± s.e.m. Statistical significance was calculated by one-way ANOVA with Bonferroni post hoc test (d,e,g) or unpaired one-tailed Student’s t-test (i).

Similar articles

Cited by

References

    1. Pratama A et al. Roquin-2 shares functions with its paralog Roquin-1 in the repression of mRNAs controlling T follicular helper cells and systemic inflammation. Immunity 38, 669–680 (2013). - PubMed
    1. Tavernier SJ et al. A human immune dysregulation syndrome characterized by severe hyperinflammation with a homozygous nonsense Roquin-1 mutation. Nat. Commun 10, 4779 (2019). - PMC - PubMed
    1. Vogel KU et al. Roquin paralogs 1 and 2 redundantly repress the Icos and Ox40 costimulator mRNAs and control follicular helper T cell differentiation. Immunity 38, 655–668 (2013). - PubMed
    1. Matsushita K et al. Zc3h12a is an RNase essential for controlling immune responses by regulating mRNA decay. Nature 458, 1185–1190 (2009). - PubMed
    1. Uehata T et al. Malt1-induced cleavage of regnase-1 in CD4+ helper T cells regulates immune activation. Cell 153, 1036–1049 (2013). - PubMed

Publication types

MeSH terms