. 2021 Dec;22(12):1551-1562.
doi: 10.1038/s41590-021-01065-2. Epub 2021 Nov 22.

Mitochondrial aspartate regulates TNF biogenesis and autoimmune tissue inflammation

Affiliations

Mitochondrial aspartate regulates TNF biogenesis and autoimmune tissue inflammation

Bowen Wu et al. Nat Immunol. 2021 Dec.

Abstract

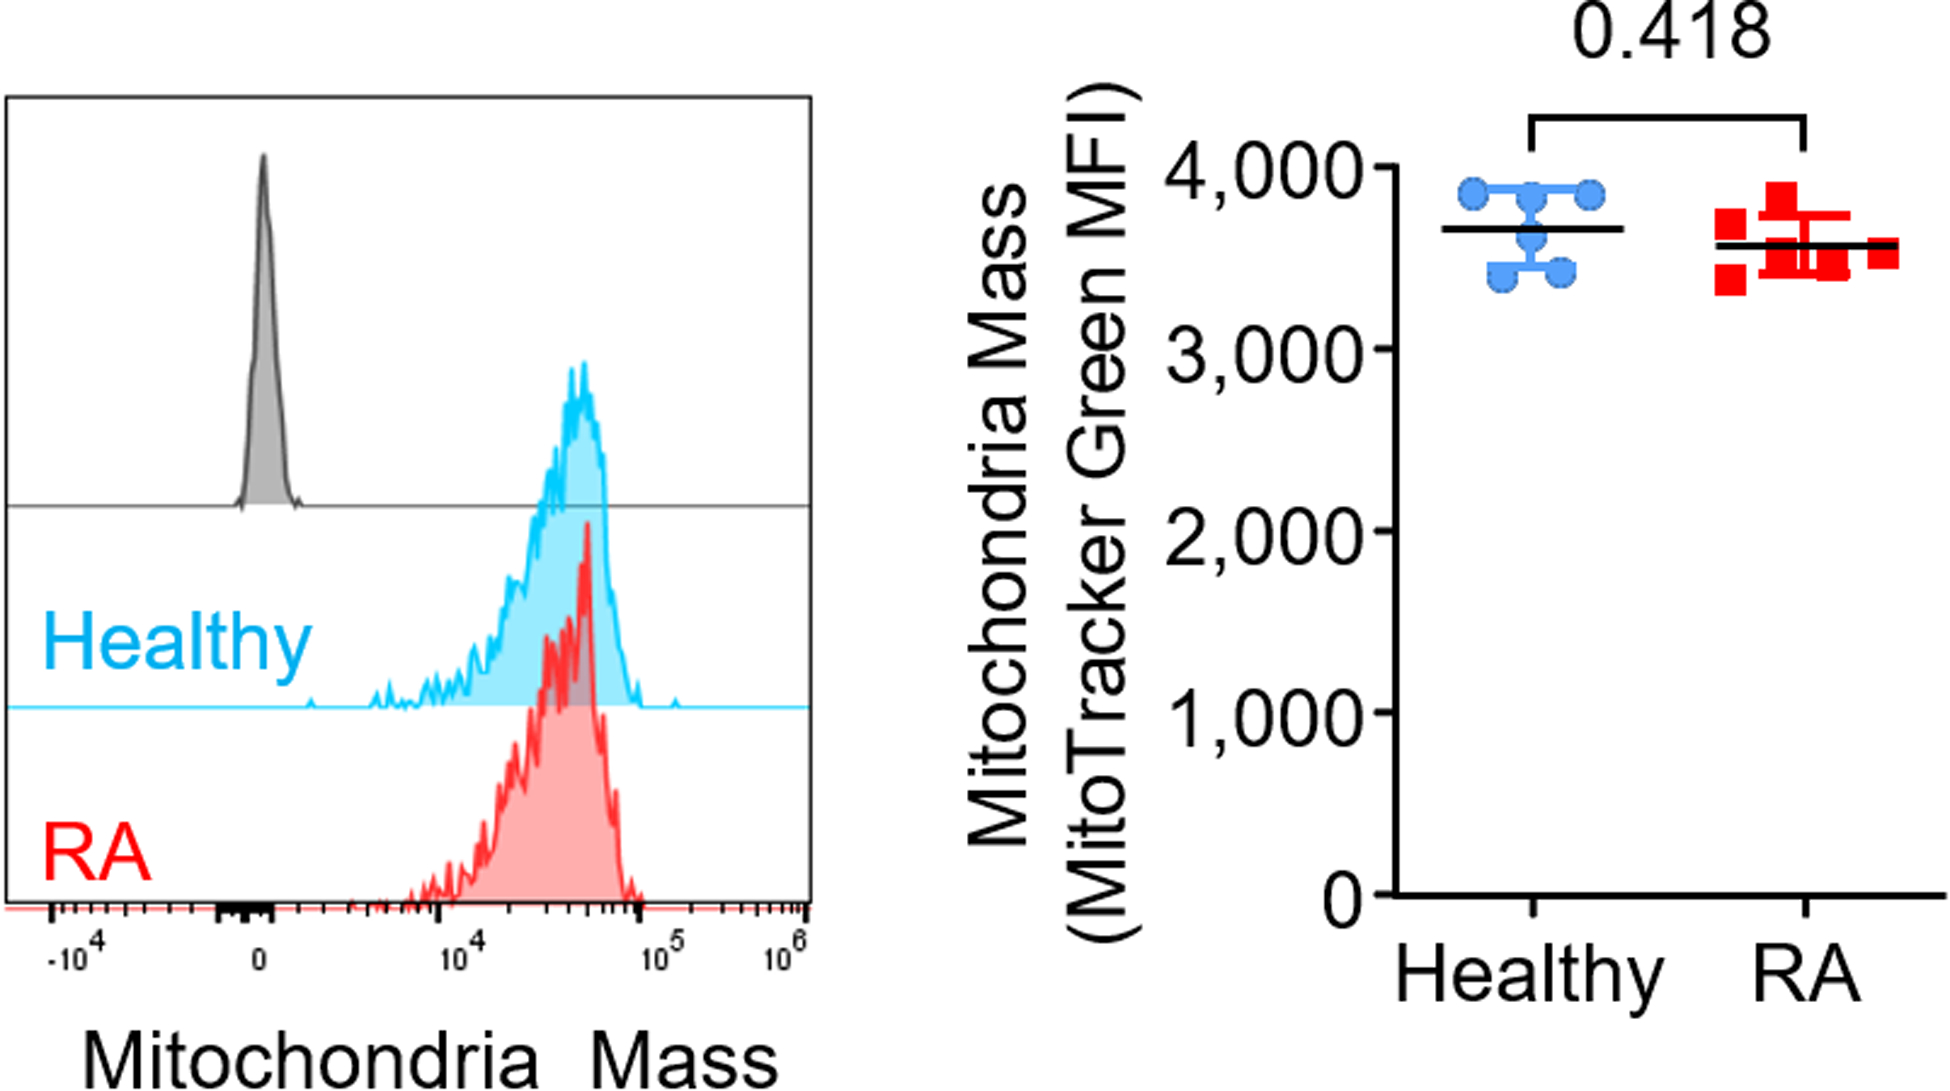
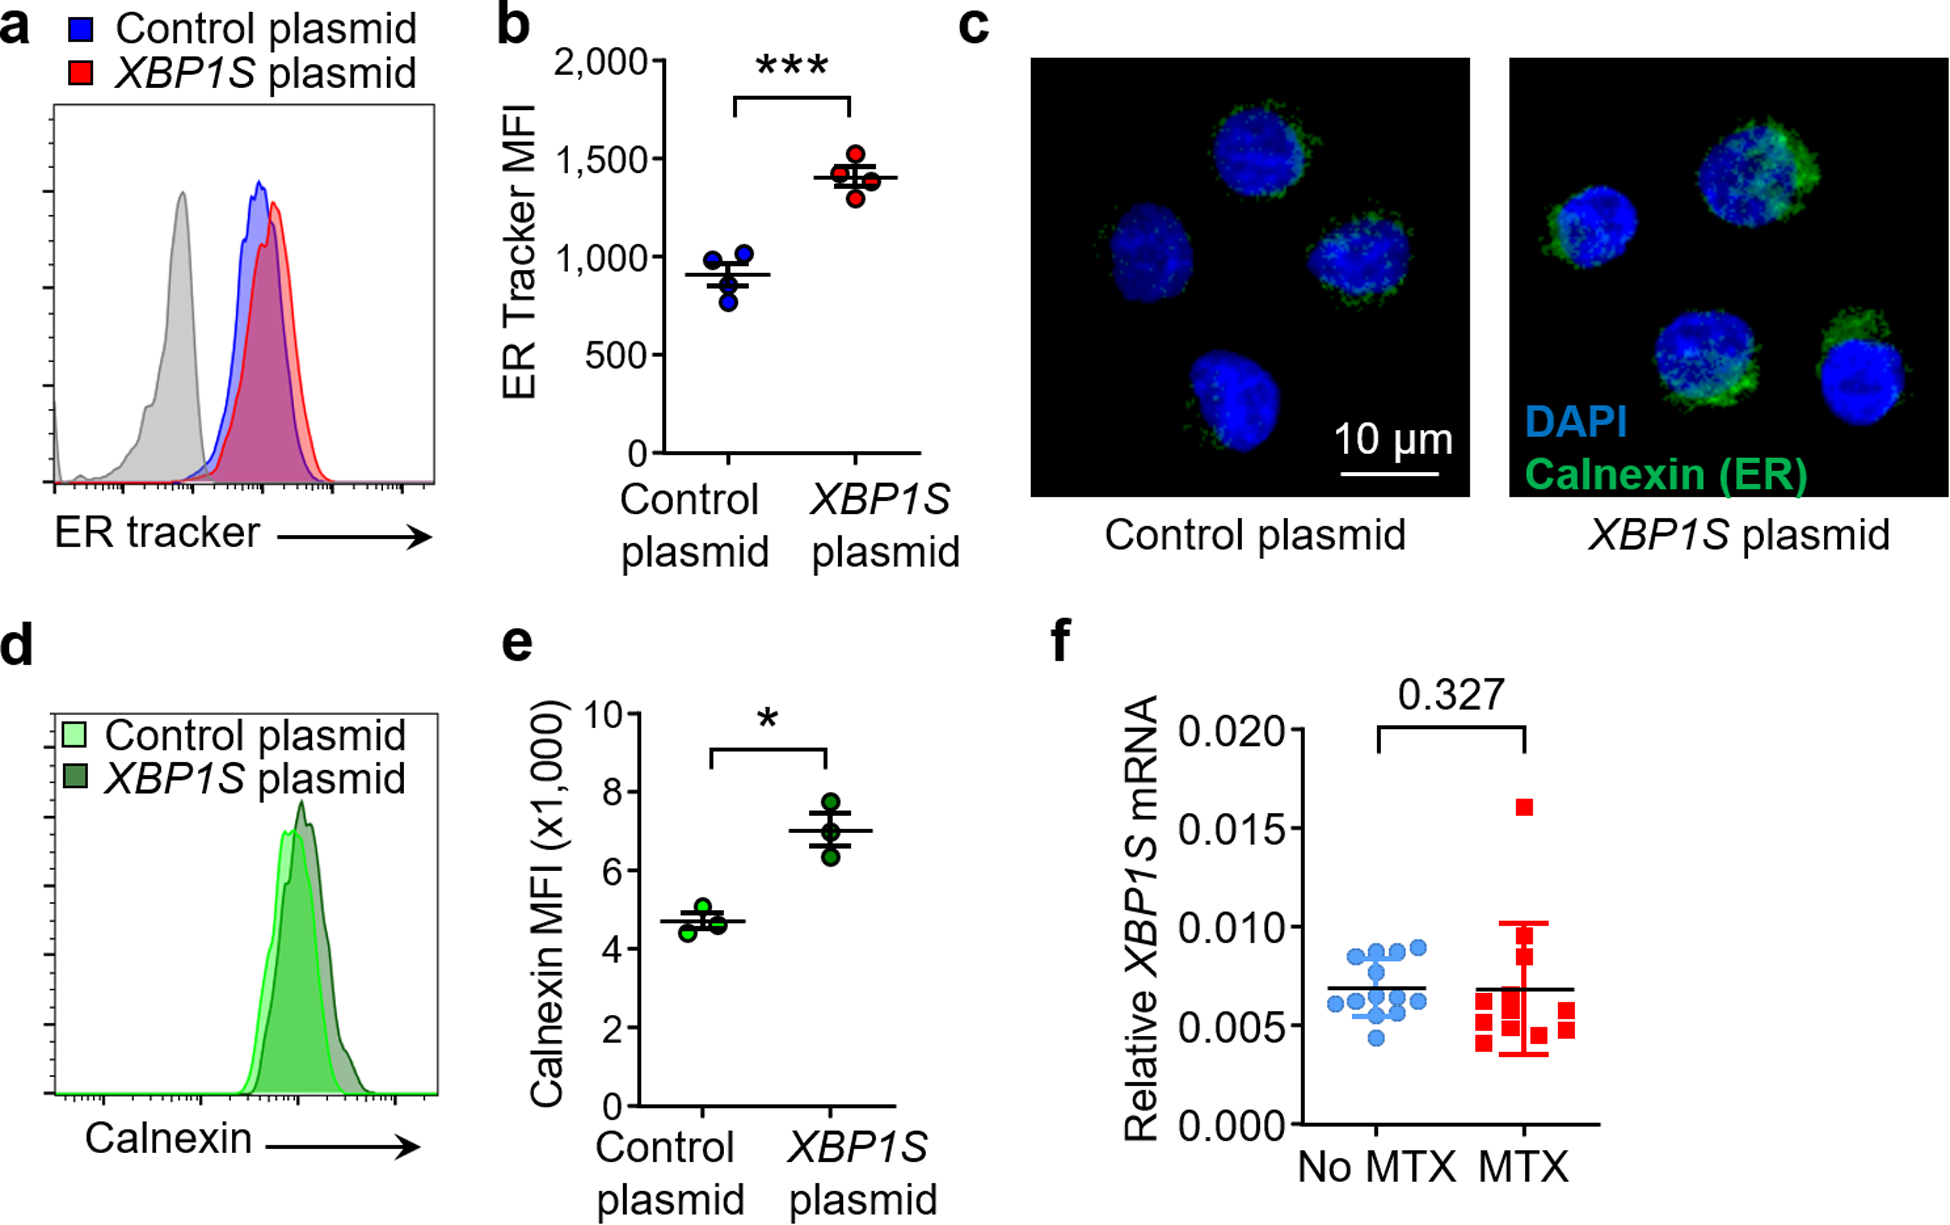
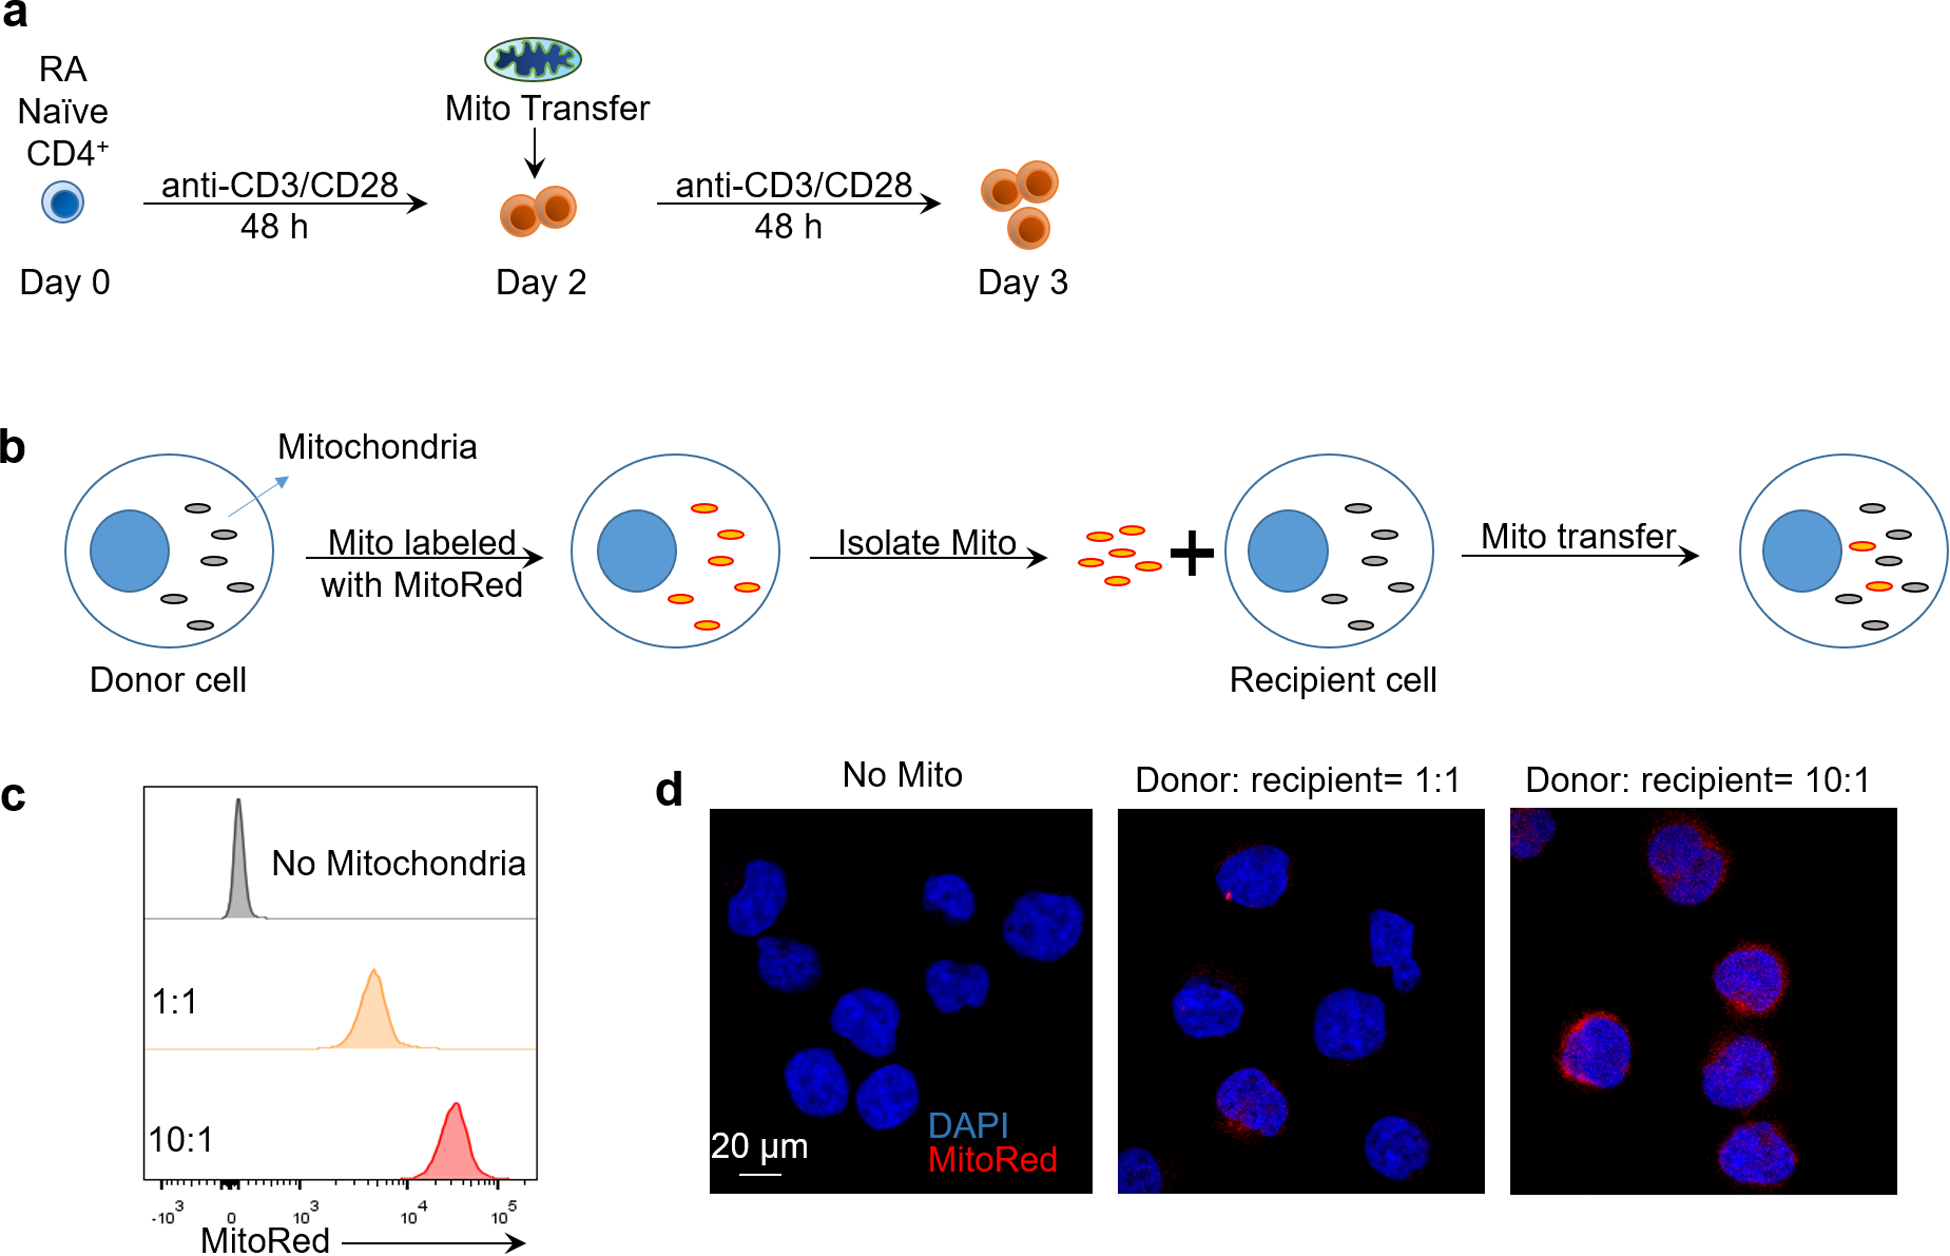
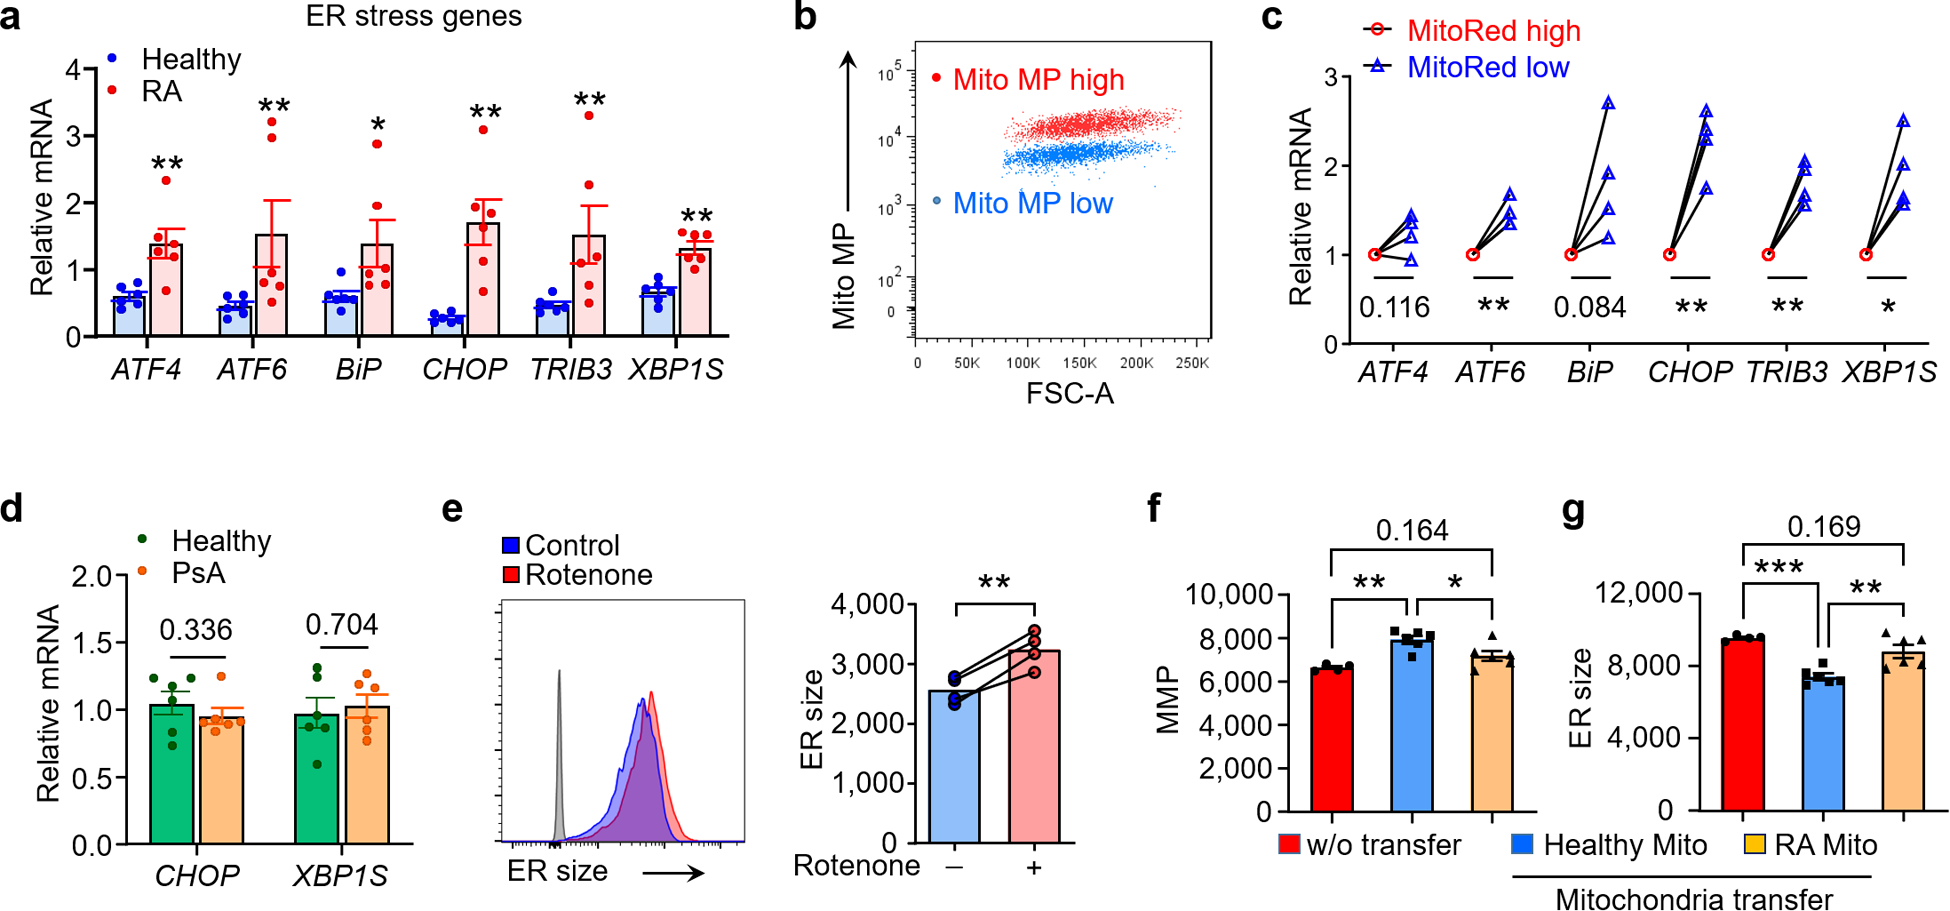
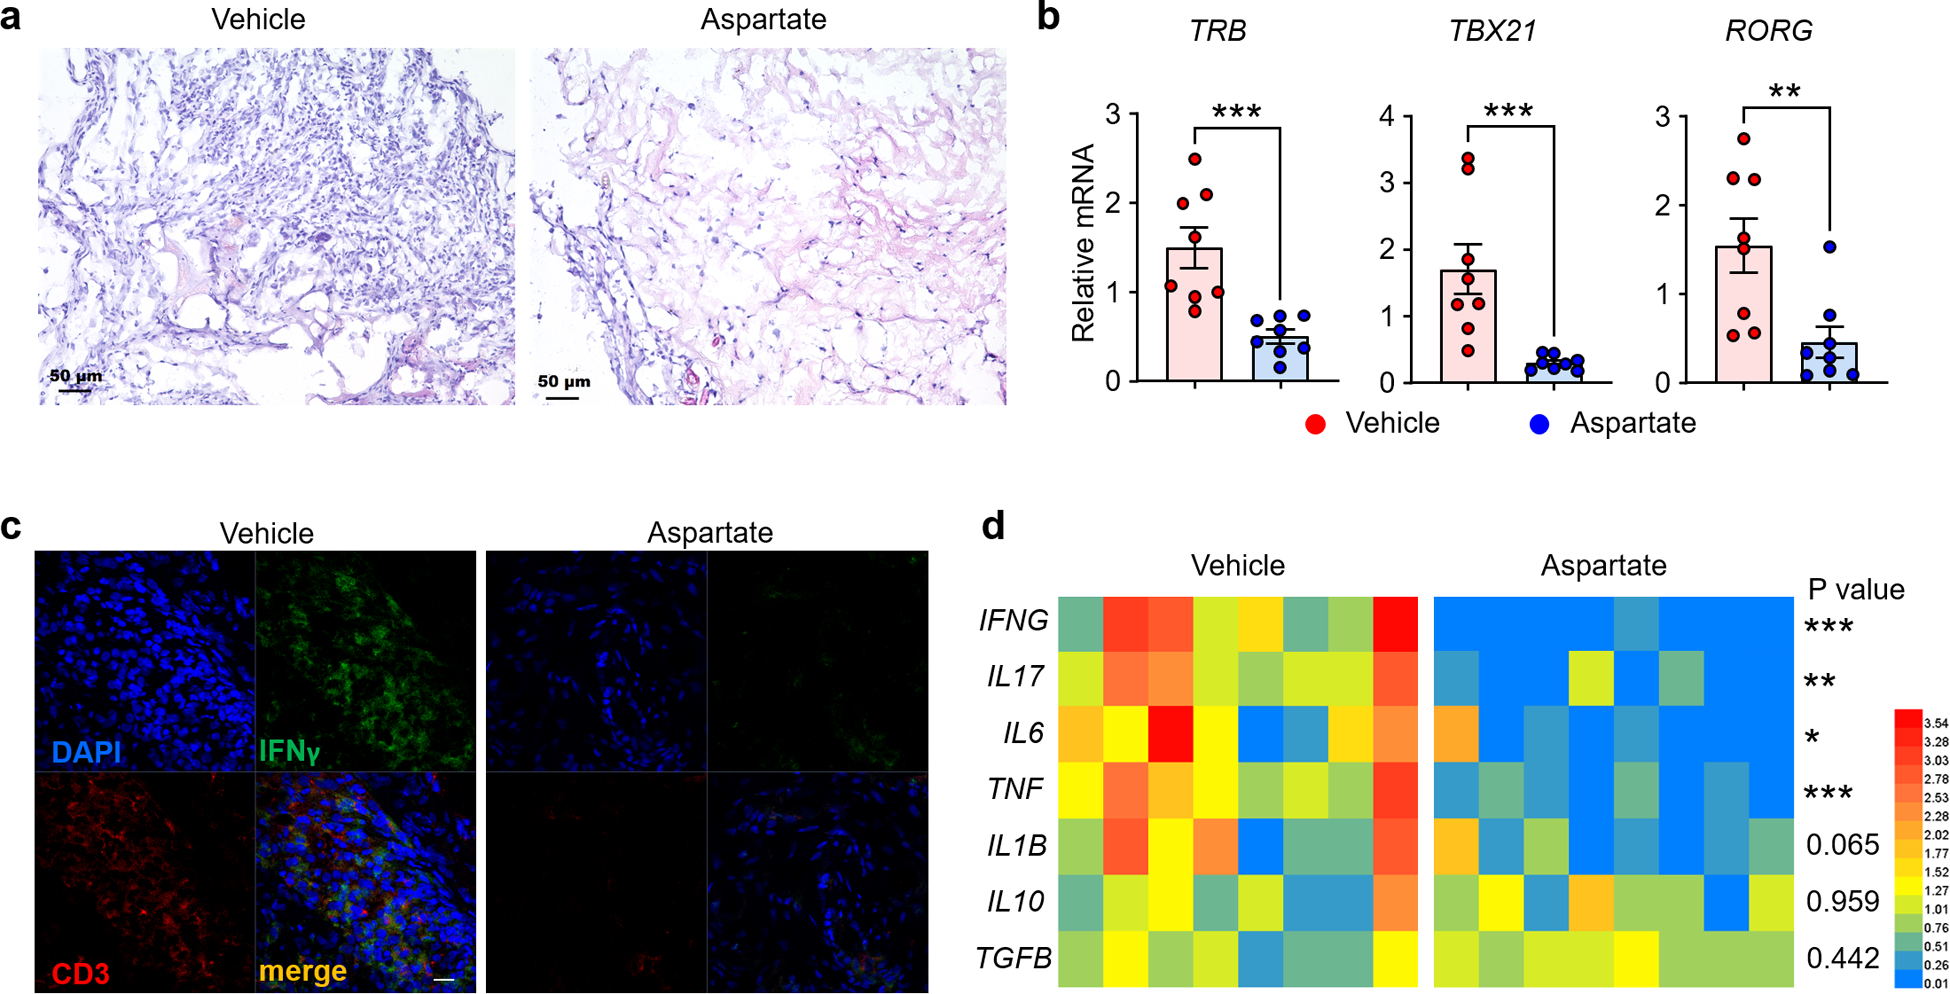
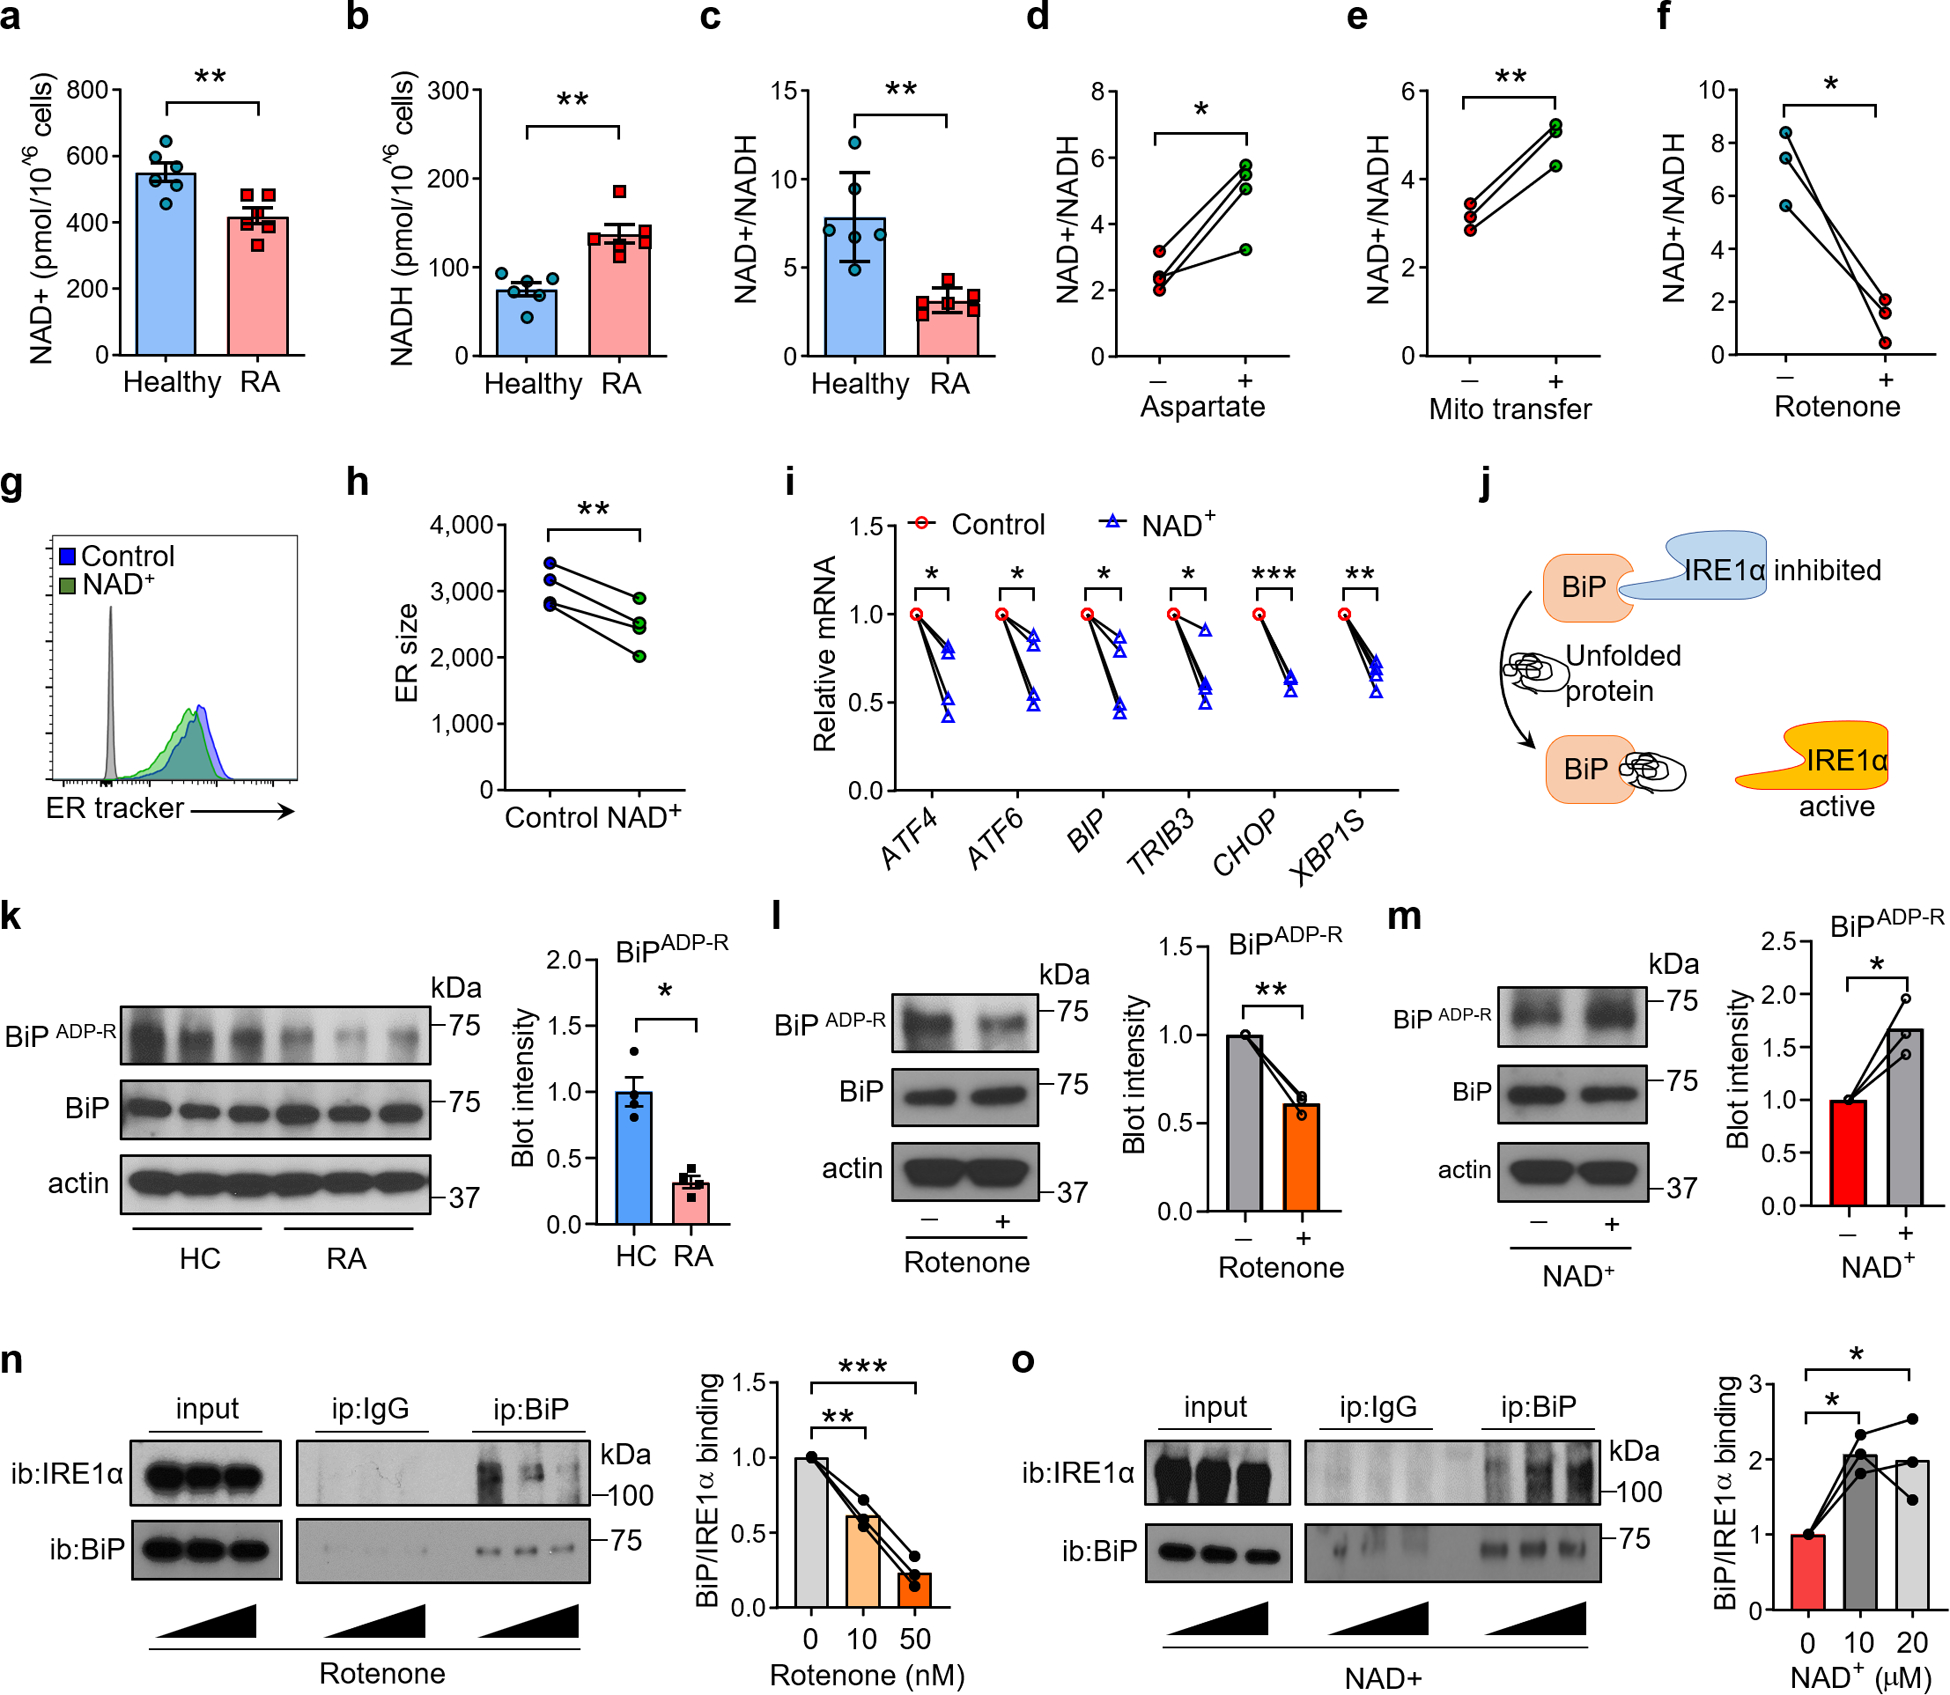
Misdirected immunity gives rise to the autoimmune tissue inflammation of rheumatoid arthritis, in which excess production of the cytokine tumor necrosis factor (TNF) is a central pathogenic event. Mechanisms underlying the breakdown of self-tolerance are unclear, but T cells in the arthritic joint have a distinctive metabolic signature of ATPlo acetyl-CoAhi proinflammatory effector cells. Here we show that a deficiency in the production of mitochondrial aspartate is an important abnormality in these autoimmune T cells. Shortage of mitochondrial aspartate disrupted the regeneration of the metabolic cofactor nicotinamide adenine dinucleotide, causing ADP deribosylation of the endoplasmic reticulum (ER) sensor GRP78/BiP. As a result, ribosome-rich ER membranes expanded, promoting co-translational translocation and enhanced biogenesis of transmembrane TNF. ERrich T cells were the predominant TNF producers in the arthritic joint. Transfer of intact mitochondria into T cells, as well as supplementation of exogenous aspartate, rescued the mitochondria-instructed expansion of ER membranes and suppressed TNF release and rheumatoid tissue inflammation.


Conflict of interest statement

Declaration of Interests

The authors have declared that no conflict of interest exists.

Figures

Extended Figure 1.
Extended Figure 1.
CD4+CD45RA+ T cells were stimulated for 72 h. Flow cytometric quantification of mitochondria mass (MitoTrack Green MFI); n = 6 healthy and 6 RA. Data are mean ± SEM. Two-tailed unpaired Mann-Whitney-Wilcoxon rank test.
Extended Figure 2.
Extended Figure 2.
CD4+CD45RA+ T cells were stimulated for 72 h. ER biomass was determined with ER tracker and mitochondrial function was assessed with the mitochondrial membrane potential. Gate #1: small cellular size. Gate #2: medium cellular size. Gate #3: large cellular size.
Extended Figure 3.
Extended Figure 3.
Naive CD4+ T cells were stimulated and transfected with control or XBP1S overexpression plasmid before the ER size was determined. (a, b) Flow cytometry for ER Tracker staining; n=4. (c) Confocal microscopy imaging of the ER protein calnexin. Scale bar, 10 μm, n=3 independent experiments. (d, e) Flow cytometry for calnexin expression; n=3. (f) XBP1S expression in T cells from patients treated with or w/o Methotrexate (MTX) (MTX: n=13; w/o MTX: n=12). All data are mean ± SEM. Two-tailed paired t test (b, e). Unpaired Mann-Whitney-Wilcoxon rank test (f). *P < 0.05, ***P < 0.001.
Extended Figure 4.
Extended Figure 4.
Healthy naive CD4+ T cells were stimulated for 72 h in the presence of the mitochondrial respiration inhibitors Piericidin A (10 pM), Antimycin A (10 nM) or Oligomycin (1 nM). ER size was determined by flow cytometry measuring ER tracker (n=4). Data are mean ± SEM. One-way ANOVA and post-ANOVA pair-wise two-group comparisons conducted with Tukey’s method. **P < 0.01.
Extended Figure 5.
Extended Figure 5.
(a) Experimental scheme for mitochondria transfer into RA T cells. (b) Experimental scheme for mitochondria transfer in Jurkat T cells. Mitochondria were labeled with MitoTrackerRed and isolated, then transferred into recipient cells. (c) Flow cytometric analysis of MitoTracker Red intensity after mitochondria transfer. Ratio indicates donor cell number/recipient cell number. (d) Representative confocal imaging of exogenous mitochondria transferred into Jurkat T cells, n=3 independent experiments, scale bar, 20 μm.
Extended Figure 6.
Extended Figure 6.
Peripheral blood CD4+CD45RA+ T cells from RA patients and age-matched healthy individuals were isolated and stimulated for 72 h. mRNA levels of GOT1 and GOT2 were determined by qPCR. n = 4 in each group. All data are mean ± SEM. Two-tailed unpaired Mann-Whitney-Wilcoxon rank test.
Extended Figure 7.
Extended Figure 7.
ADP-ribosylation of BiP in healthy CD4+ T cells treated with or w/o Piercidin A (10 pM) for 24 h. n = 2.
Extended Figure 8.
Extended Figure 8.
(a) Naïve CD4+ T cells were purified from peripheral blood mononuclear cells and stimulated with anti-CD3/CD28 for 72 h. The rough ER was isolated by calcium precipitation and the isolate was immunoblotted for the ER protein calnexin, the ribosomal protein L17 and the cytoplasmic protein a-actin. (b) Healthy CD4+ T cells were activated with PMA/Ionomycin for 2 h before isolation of the rough ER and immunoblotting of the ER protein calnexin, the ribosomal protein S7 and the cytosolic protein β-actin.
Extended Figure 9.
Extended Figure 9.
Naïve CD4+ T cells were purified from PBMCs and stimulated with anti-CD3/CD28 beads for 72 h in the presence of the indicated molecules. ER size quantified by MFI of ER tracker staining and TNF production measured by intracellular staining of TNF after PMA/ION stimulation for 2 h in the presence of the secretion inhibitor BFA. (a) Fold change of ER size after Tunicamycin treatment compared to the control group, n=6. (b) Fold change of TNF production after Tunicamycin treatment compared to the control group, n=4. (c) ER size change after Aspartate (1 mM) or Asparagine (1 mM) treatment, n=6. (d) TNF production after aspartate and asparagine treatment, n=3. (e) ER size change after pyruvate (1 mM) or α-KB (1 mM) treatment, n=6. (f) TNF production after pyruvate or α-KB treatment, n=4. All data are mean ± SEM, one-way ANOVA and post-ANOVA pair-wise two-group comparisons conducted with Tukey’s method. *P < 0.05, **P < 0.01, ***P < 0.001.
Extended Figure 10.
Extended Figure 10.
Mitochondria were isolated from healthy T cells and transferred into RA CD4+ T cells prior to their adoptive transfer into synovium-NSG chimeras. Explanted synovial grafts were analyzed by immunohistochemical staining and tissue transcriptomics (RT-PCR). 8 tissues in each group. (a) H&E staining of synovial tissue sections. Scale bar; 50 μm. (b) Immunofluorescence staining for CD3+ T cells in synovial infiltrates. Representative images. Scale bar; 10 μm. (c) Gene expression profiling (RT-PCR) of TRB, TBET, RORG and other key inflammatory markers (n=8). All data are mean ± SEM. Two-tailed unpaired Mann-Whitney-Wilcoxon rank test. *P < 0.05, **P < 0.01, ***P < 0.001.
Fig. 1.
Fig. 1.. Mitochondrial insufficiency and ER expansion in rheumatoid arthritis.
Naïve CD4+CD45RA+ T cells from patients with RA or psoriatic arthritis (PsA) and age-matched healthy individuals were stimulated for 72 h. (a-c) Reduced mitochondrial fitness in RA T cells. (a) Basal mitochondrial oxygen consumption rates (OCR) measured by Seahorse Analyzer. n=6 each. (b, c) Mitochondrial membrane potential measured by flow cytometry (MitoTracker Red). n=7 each. (d) Correlation of ER size (ER Tracker MFI) and mitochondrial membrane potential in healthy T cells by Linear regression (n=10). (e) Representative confocal microscopy imaging of the ER enzyme protein disulfide isomerase (PDI) and mitochondrial membrane potential (MitoTracker Red) from 3 independent experiments. Green arrow marks a cell with abundant ER, red arrow marks a cell with high mitochondrial activity. Scale bar, 10 μm. (f) Correlation of ER size (ER Tracker intensity) and mitochondrial membrane potential in cells gated based on cell size. Linear regression with confidence interval shown in gray around the regression line. (g-l) Expanded ER size in RA T cells. (g) Flow cytometric quantification of ER size (ER Tracker MFI) in RA and healthy control T cells; n = 8 each. (h, i) Confocal microscopy imaging of the ER chaperon protein calnexin in RA and healthy T cells. Scale bar, 10 μm. Single cell calnexin intensity quantification (n=50 T cells from 5 healthy and 5 RA samples). (j) Flow cytometric quantification of ER size in T cells from PsA patients and healthy donors; n = 8 each. (k) Intracellular phosphatidylcholine concentrations in healthy and RA T cells (Healthy: n=6; RA: n =8). (l) Representative transmission electron microscope image of healthy and RA T cells from 30 cells from 3 healthy and 3 RA samples. White arrows indicate ER. Scale bar,1 μm. All data are mean ± SEM. Two-tailed unpaired Mann-Whitney-Wilcoxon rank test (a, c, g-k). *P < 0.05, **P < 0.01, ***P < 0.001.
Fig. 2.
Fig. 2.. Mitochondrial insufficiency promotes ER expansion.
(a) ER stress gene expression (qPCR) in healthy and RA T cells (Healthy: n=6; RA: n =6). (b, c) Separation of two CD4+ T cell subpopulations based on mitochondrial membrane potential and qPCR analysis of ER stress genes in Mito MPhi and Mito MPlo T cells, n=4. (d) Comparison of CHOP, XBP1S mRNA level in healthy and PsA T cells, n=6. (e) Mitochondrial stress expands ER size. Healthy naïve T cells were activated for 72 h with or w/o the complex I inhibitor Rotenone (10nM). Histogram of ER Tracker staining and collective MFI, n=4. (f, g) Mitochondrial transfer corrects ER size. CD4+CD45RA+ T cells from RA patients were stimulated with anti-CD3/CD28 for 48 h. mitochondria isolated from healthy or RA CD4+ T cells were transferred into RA T cells (donor cell number/recipient cell number=10:1). Mitochondrial membrane potential (f) and ER size (g) in RA T cells after mitochondria transfer, n = 6. All data are mean ± SEM. Two-tailed unpaired Mann-Whitney-Wilcoxon rank test (a, d). Two-tailed paired t test (c, e). One-way ANOVA and post-ANOVA pair-wise two-group comparisons conducted with Tukey’s method (f, g). *P < 0.05, **P < 0.01, ***P < 0.001.
Fig. 3.
Fig. 3.. Mitochondria-derived aspartate controls ER size.
Naïve CD4+CD45RA+ T cells from patients with rheumatoid arthritis (RA), and age-matched healthy individuals were stimulated for 72 h. (a) Mitochondrial intermediates determine ER size. RA T cells were supplemented with the indicated mitochondrial intermediates (all 1 mM) and ER size was quantified flow cytometrically, n=6. (b) Scheme for the malate/aspartate shuttle. (c, d) RA T cells are aspartate/oxaloacetate deficient. Intracellular aspartate (Healthy: n=8; RA: n =8) (c) and oxaloacetate (Healthy: n=6; RA: n=6) (d) concentrations in T cells. (e, f) Aspartate inhibits ER stress signals and phosphatidylcholine synthesis. RA T cells were treated with aspartate for 3 days. ER stress gene expression (n=5) (e) and Phosphatidylcholine content (n=4) (f) were measured. (g, h) Aspartate concentrations depend on intact mitochondrial function. Intracellular aspartate concentrations were measured after treatment of healthy T cells with the complex I inhibitor Rotenone (10nM; n=3) or after the transfer of healthy mitochondria into RA T cells (n=3). (i-k) Glutamic-Oxaloacetic Transaminase 2 (GOT2) regulates ER size. GOT2 was knocked down by si-RNA in healthy T cells. (i) Intracellular aspartate levels, n=5; (j) ER size quantified by flow cytometric analysis (ER Tracker MFI), n=4; (k) ER stress genes quantified by qPCR, n=4. All data are mean ± SEM. One-way ANOVA and post-ANOVA pair-wise two-group comparisons conducted with Tukey’s method (a, j), P-values from comparison with control group. Two-tailed paired t test (e-i, k). Two-tailed unpaired Mann-Whitney-Wilcoxon rank test (c, d). *P < 0.05, **P < 0.01, ***P < 0.001.
Fig. 4.
Fig. 4.. Aspartate is anti-inflammatory.
Synovitis was induced in chimeric mice engrafted with human synovial tissue and immuno-reconstituted with RA PBMC. Chimeras were treated with vehicle or aspartate i.p. 5 mg/kg. (a) Representative H&E staining of explanted synovial tissue, n=8 (b) Tissue transcriptomic analysis (qPCR) of synovial explants. Shown are data for T cell receptor (TRB) transcripts and the lineage-determining transcription factors TBX21 and RORC (n=8). (c) Representative image of co-immunofluorescence staining for IFN-γ-producing CD3+ T cells in the synovial tissue, n=8; scale bar,10 μm. (d) Tissue transcriptomic analysis of key inflammatory cytokines. 8 tissues in each study arm. All data are mean±SEM. Two-tailed unpaired Mann-Whitney-Wilcoxon rank test. *P < 0.05, **P < 0.01, ***P < 0.001.
Fig. 5.
Fig. 5.. Aspartate is required for NAD regeneration and ADP-ribosylation of BiP.
Naïve CD4+CD45RA+ T cells from patients with rheumatoid arthritis (RA), and age-matched healthy individuals were stimulated for 72 h. (a-c) NAD+ deficiency in RA T cells. Quantification of intracellular NAD+, NADH and the NAD/NADH ratio in healthy and RA T cells, n=6. (d-f) Aspartate and intact mitochondria regenerate NAD+. (d) NAD+/NADH ratios in RA T cells treated with or w/o aspartate, n=4. (e) NAD+/NADH ratios in RA T cells with or w/o mitochondrial transfer, n=3. (f) NAD+/NADH ratios in healthy T cells treated with or w/o the complex I inhibitor Rotenone (10 nM), n=3. (g-i) NAD+ controls ER size and ER stress. RA T cells were treated with or w/o NAD. ER size was determined flow cytometrically (ER Tracker MFI). (g, h) Representative histograms. ER size measurements from 4 experiments. (i) ER stress gene expression profiling (qPCR) in RA T cells treated with or w/o NAD+, n=4. (j-o) NAD-dependent ribosylation of BiP prevents ER expansion and stabilizes Ire-1a binding. (j) Scheme of IRE1-α activity controlled by BiP in the ER lumen. (k) ADP-ribosylation of BiP in healthy and RA T cells, n=3. (l) ADP-ribosylation of BiP in healthy CD4+ T cells treated with or w/o Rotenone (10 nM) for 24 h. n=3. (m) ADP-ribosylation of BiP in RA CD4+ T cells treated with or w/o NAD (10 μM) for 24 h. n=3. (n) BiP- IRE-1α binding in healthy CD4+ T cells treated with 0, 10, 50 nM rotenone for 24 h. n=3. (o) BiP- IRE-1α binding in activated RA CD4+ T cells treated with 0, 10, 20 μM NAD for 24 h. n=3. All data are mean ± SEM. Two-tailed unpaired Mann-Whitney-Wilcoxon rank test (a-c, k). Two-tailed paired t test (d-i). One-way ANOVA and post-ANOVA pair-wise two-group comparisons conducted with Tukey’s method (n, o). *P < 0.05, **P < 0.01, ***P < 0.001.
Fig. 6.
Fig. 6.. Expansion of the rough ER increases co-translational translocation in RA T cells.
Naïve CD4+CD45RA+ T cells from RA patients and age-matched controls were stimulated for 72 h. (a-e) Enrichment of rough ER in RA T cells. (a, b) Immunoblot analysis of the ER chaperon protein calnexin and the ribosomal proteins L-17 and S-7 in CD4+ T cells from 5 healthy individuals and 6 RA patients. (c, d) Rough ER was isolated from healthy and RA T cells 2 h after restimulation. (c) Calnexin, ribosomal S7 and β-actin were quantified by immunoblotting. (d) Quantification of blot intensity for rough ER in each group, n=5 healthy and 4 RA. (e) TNF is the predominant cytokine expressed by activated naïve CD4+ T cells. Transcripts for T cell effector cytokines in activated naïve CD4+ T cells quantified by qPCR, n=3. (f) Healthy and RA T cells express similar level of TNF mRNA. TNF mRNA concentrations in healthy and RA T cells before (n=8 healthy and 8 RA) and after (n=5 healthy and 7 RA) PMA/ION stimulation (qPCR). (g) T cell stimulation induces enrichment of ER-bound mRNA for secretory proteins. Fold change of ER-bound mRNA for secretory proteins and intracellular proteins after PMA/ION stimulation, n=3. (h) Enrichment for ER-bound TNF mRNA in RA T cells. Rough ER was isolated from healthy and RA T cells 2 h after stimulation. mRNA associated with rough ER was quantified by qPCR. n=6. All data are mean ± SEM. Two-tailed unpaired Mann-Whitney-Wilcoxon rank test (b, d, f, h). *P < 0.05, **P < 0.01.
Fig. 7.
Fig. 7.. ERrich RA T cells are TNF-superproducers.
Naïve CD4+CD45RA+ T cells from RA patients and age-matched controls were stimulated for 72 h. (a) Representative confocal image of the ER chaperone protein Calnexin and TNF in healthy and RA T cells, n=3 independent experiments; scale bar,10 μm. (b) Flow cytometric measurement of intracellular TNF in CD4+ T cells from RA patients and healthy individuals before and after PMA/ION stimulation (Healthy: n=5; RA: n =5). (c) TNF secreted into the extracellular space by unstimulated (Healthy: n=4; RA: n =6) and stimulated (Healthy: n=4; RA: n =5) RA and control CD4+ T cells. (d-i) Mitochondrial function and aspartate control TNF production. (d, e) Electron transfer was inhibited in healthy T cells with Rotenone (10 nM) or Piercidin A (10 pM). TNF was measured by flow cytometry, n=4 in each series. (f) GOT2 knockdown in healthy T cells, combined with or without aspartate rescue. TNF was measured by flow cytometry, n=4. (g) TNF production in RA T cells treated with or w/o aspartate, n=3. (h) TNF production in RA T cells reconstituted with or w/o healthy mitochondria, n=3. (i) TNF production in RA T cells treated with or w/o NAD+, n=4. (j) Scheme showing the aspartate-NAD-BiP pathway controlling TNF secretion. All data are mean ± SEM. Two-tailed unpaired Mann-Whitney-Wilcoxon rank test (b, c). Two-tailed paired t test (d-i). *P < 0.05, **P < 0.01, ***P < 0.001.
Fig. 8.
Fig. 8.. TNF-producing CD4+ T cells function as key arthritogenic effector cells.
(a, e) Cellular composition of leucocyte-rich and leukocyte-poor tissues collected from patients with rheumatoid synovitis. (b-d, f-h) TNF is a product of tissue T cells. Flow cytometric analysis of intracellular TNF in T cells, B cells and macrophages after stimulation with LPS/PMA/ION/BFA for 4h. (b, f) Histogram of TNF staining. (c, g) Frequencies of TNF-producing cell populations. (d, h) MFI of TNF staining in different cell populations. (i-k) Spontaneous TNF production in T cells and macrophages residing in the synovium. Freshly harvested synovial tissue from RA patients was incubated with or w/o the secretion inhibitor BFA for 4 h, before cells were dissociated from the tissue and intracellular TNF was detected by flow cytometry. TNF+ CD45+ CD68+ macrophages (i) and TNF+ CD45+ CD3+ T cells (j) in synovial tissue before and after BFA treatment. (k) Fold change in the frequency of TNF+ macrophage and TNF+ T cells after BFA treatment. n=3 tissues. (l-n) TNF-producing CD4+ T cells are an absolute requirement for rheumatoid synovitis. Rheumatoid synovitis was induced in human synovial tissues engrafted into NSG mice. CD4+ T cells from RA patients were transfected with control or TNF siRNA and adoptively transferred into the chimeric mice. Synovial grafts were explanted two weeks later. (l) H&E staining of explanted synovial tissues. Scale bar; 50 μm. (m) Immuno-fluorescence staining of CD3+ T cells in synovial infiltrates. Scale bar; 10 μm. (n) Synovial tissue transcriptome for TRB, TBET, RORG and other key inflammatory markers (n=8). All data are mean ± SEM. Two-tailed paired t test (k). Two-tailed unpaired Mann-Whitney-Wilcoxon rank test (n). *P < 0.05, **P < 0.01, ***P < 0.001.

Comment in

Similar articles

Cited by

References

    1. Deane KD, Norris JM & Holers VM Preclinical rheumatoid arthritis: identification, evaluation, and future directions for investigation. Rheum Dis Clin North Am 36, 213–241, doi:10.1016/j.rdc.2010.02.001 (2010). - DOI - PMC - PubMed
    1. Feldmann M, Brennan FM & Maini RN Role of cytokines in rheumatoid arthritis. Annu Rev Immunol 14, 397–440, doi:10.1146/annurev.immunol.14.1.397 (1996). - DOI - PubMed
    1. Maini RN & Taylor PC Anti-cytokine therapy for rheumatoid arthritis. Annu Rev Med 51, 207–229, doi:10.1146/annurev.med.51.1.207 (2000). - DOI - PubMed
    1. Zhang F et al. Defining inflammatory cell states in rheumatoid arthritis joint synovial tissues by integrating single-cell transcriptomics and mass cytometry. Nat Immunol 20, 928–942, doi:10.1038/s41590-019-0378-1 (2019). - DOI - PMC - PubMed
    1. Rubbert-Roth A et al. Failure of anti-TNF treatment in patients with rheumatoid arthritis: The pros and cons of the early use of alternative biological agents. Autoimmun Rev 18, 102398, doi:10.1016/j.autrev.2019.102398 (2019). - DOI - PubMed

References for Methods

    1. Yang Z et al. Restoring oxidant signaling suppresses proarthritogenic T cell effector functions in rheumatoid arthritis. Sci Transl Med 8, 331ra338, doi:10.1126/scitranslmed.aad7151 (2016). - DOI - PMC - PubMed
    1. Wen Z et al. N-myristoyltransferase deficiency impairs activation of kinase AMPK and promotes synovial tissue inflammation. Nat Immunol 20, 313–325, doi:10.1038/s41590-018-0296-7 (2019). - DOI - PMC - PubMed
    1. Li Y et al. Deficient Activity of the Nuclease MRE11A Induces T Cell Aging and Promotes Arthritogenic Effector Functions in Patients with Rheumatoid Arthritis. Immunity 45, 903–916, doi:10.1016/j.immuni.2016.09.013 (2016). - DOI - PMC - PubMed

Publication types

MeSH terms