Review
. 2021 Nov 22;188(12):424.
doi: 10.1007/s00604-021-05066-8.

Recent developments in the chiroptical properties of chiral plasmonic gold nanostructures: bioanalytical applications

Affiliations
Review

Recent developments in the chiroptical properties of chiral plasmonic gold nanostructures: bioanalytical applications

Nebu John et al. Mikrochim Acta. .

Abstract

The presence of excess L-amino acid in the Murchison meteorite, circular polarization effect in the genesis of stars and existence of chirality in interstellar molecules contribute to the origin of life on earth. Chiral-sensitive techniques have been employed to untangle the secret of the symmetries of the universe, designing of effective secure drugs and investigation of chiral biomolecules. The relationship between light and chiral molecules was employed to probe and explore such molecules using spectroscopy techniques. The mutual interaction between electromagnetic spectrum and chirality of matter give rise to distinct optical response, which advances vital information contents in chiroptical spectroscopy. Chiral plasmonic gold nanoparticle exhibits distinctive circular dichroism peaks in broad wavelength range thereby crossing the limits of its characterization. The emergence of strong optical activity of gold nanosystem is related to its high polarizability, resulting in plasmonic and excitonic effects on incident photons. Inspired by the development of advanced chiral plasmonic nanomaterials and exploring its properties, this review gives an overview of various chiral gold nanostructures and the mechanism behind its chiroptical properties. Finally, we highlight the application of different chiral gold nanomaterials in the field of catalysis and medical applications with special emphasis to biosensing and biodetection.

Keywords: Chirality; Chiroptical properties; Circular dichroism; Gold nanostructures; Plasmonic nanoparticle; Surface plasmon resonance.


Conflict of interest statement

The authors declare no competing interests.

Figures
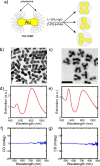
Fig. 1
Fig. 1
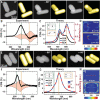
Structural and spectral characteristics of Au NDs and Au ND dimers. a Cartoon depiction of the dimer formation scheme through polymer capture, resulting in parallel (top), twisted (middle) and twisted with planar displacement (bottom) dimers. b, c TEM images of the Au NDs before and after dimerization, respectively. Scale bars are 100 nm. d, e Ensemble UV–Vis extinction spectra of the Au ND and dimer samples, respectively. The Au NDs show maxima at 521 and 812 nm. The maxima for Au ND dimers are at 534 and 816 nm. f, g Ensemble CD spectra of the Au ND and dimer samples, respectively. No peaks are observed in either case. “Reprinted with permission from Ref. 17. Copyright (2016) American Chemical Society”
Fig. 2
Fig. 2
Vis–NIR region. a CD and b UV–Vis absorbance spectra of five SA-guided GNR assemblies; the cryo-TEM (left), 3D reconstruction (middle) and schematic images (right) of the nanoassemblies guided by HSA (c) and BSA (d). The GNR, CTAB and SA concentrations, pH value and ionic strength of each individual assembly system are all set to 5.0 nM, 2.0 mM and 3.0 mM; 7.4; and 10.0 mM, respectively. Reproduced from Ref. 23 with permission from the Royal Society of Chemistry”
Fig. 3
Fig. 3
Representative TEM images of the assemblies for different hybridization times; the assembled times were a 5 and b 30 min and c 1, d 3, e 6 and f 12 h. “Reprinted with permission from Ref. 26. Copyright (2013) American Chemical Society”
Fig. 4
Fig. 4
a Schematic diagram of embedding sergeants in the interface region of Au NR core and Au shell (upper panel). A chiral SS dimer is used to demonstrate the formation of chiral plasmonic assemblies (lower panel). The surfactant layer (soldiers) on the nanorod surface is omitted for clarity. b Representative TEM images of Au NR cores and AuNR@Cys2@Au0.05 core–shell nanostructures. c SEM and TEM images of AuNR@Cys@Au SS oligomers. d A HRTEM image showing rod side facet link mode in a rod trimer. AA/Au3 + molar ratio = 1.6. “ Reproduced from Ref. 37 with permission from the Royal Society of Chemistry”
Fig. 5
Fig. 5
Chiral plasmonic transmitter. a Side view and front view of DNA origami-nanoparticle assemblies in a nanorod-nanosphere = nanorod (NR-NS-NR) arrangement and b a nanorod-void-nanorod (NR- -NR) arrangement. The nanorods and the nanosphere are mounted on a DNA origami structure (blue cylinders represent DNA helices) via thiolated DNA strands that are anchored to the origami structure. c Transmission electron micrograph of assemblies in the NR-NS-NR arrangement and d in the NR- -NR arrangement. Scale bars: 100 nm.CD spectra of the four Au NP tetrahedrons. e Experimental data. f Calculated results. (i) 20-nm Au NPs with interparticle distance of 15 nm (red curve in e and f), (ii) 20-nm Au NPs with interparticle distance of 10 nm (green curve in e and f), (iii) 20-nm Au NPs with interparticle distance of 5 nm (blue curve in e and f), (iv) 13-nm Au NPs with interparticle distance of 10 nm (magenta curve in e and f). a, b, c and d Reprinted with permission from ref. 39. Copyright (2021) Springer Nature”. e and f “Reprinted with permission from Ref. 40. Copyright (2014) American Chemical Society”
Fig. 6
Fig. 6
a CD spectra of the original GNRs and the assemblies induced by PIPEMA192 under different pH values. The numbers in the label correspond to the pH value in the solution. b Representative TEM image of the assembled nanostructures at pH 13.4. c Top: tilt angle TEM images of a representative assembled structure, bottom: the corresponding 3D model structures. The numbers in the label correspond to the title angle. d CD spectra of the GNR assemblies induced by PIPEMA with different molecular weights. “Reprinted with permission from Ref. 46. Copyright (2019) American Chemical Society”
Fig. 7
Fig. 7
TEM image of chiral arrangement of Au NPs in a porous PBdEO film prepared using D-TA with projection a perpendicular to the cylinder axis and b parallel to the cylinder axis. The doping amount of TA in the parent BCP film is 16 wt %. c 3D tomography of chiral arrangement of Au NPs in a porous PBdEO film using D-TA. d TEM image of chiral arrangement of Au NPs in a porous PBdEO film prepared using L-TA with projection perpendicular to the cylinder axis. “Reprinted with permission from Ref. 47. Copyright (2017) American Chemical Society”
Fig. 8
Fig. 8
CDS-active Au NR dimer-BSA complexes with chiral and achiral configurations. A and E HAADF-STEM tilt-series images of a chiral dimer (A) and an achiral dimer (E) and the corresponding geometric models extracted from the tomographic reconstructions. B and F Experimental single-particle CDS spectra of the chiral dimer (B) from (A) and the achiral dimer (F) from (E). The experimental spectra are shown with a pink envelope that represents the experimental error. C and G Simulated scattering spectra of the chiral dimer (C) and achiral dimer (G) for incident LCP and RCP light and the corresponding CDS spectra. The insets in (C) show the charge plots calculated at 720 and 805 nm. The insets in (G) show the charge plots calculated at 618 and 670 nm. The charge plots in C and G share the same scale bar. The dashed lines in C and D refer to the plasmon modes at 720 (green) and 805 nm (orange). The dashed lines in F and G refer to the plasmon modes at 618 (green) and 670 nm (orange). D and H Cross-sectional views of calculated near-field enhancements (lE/E0 l2) for the chiral dimer (D) at 720 and 805 nm and the achiral dimer (H) at 618 and 670 nm. These results demonstrate that although the dimer in (E) to (H) is not chiral on the basis of its geometry, CDS is observed and must originate from chiral BSA molecules located in inter-NR hotspots. a.u., arbitrary units; E, electric field; k, incident wave vector. “ Reproduced with permission from Ref. 48. Copy right 2019, The American Association for the Advancement of Science”
Fig. 9
Fig. 9
Opposite handedness of chiral nanoparticles depending on the cysteine enantiomer. a Circular dichroism (CD) spectrum of nanoparticles synthesized using L-cysteine (L-Cys, black) and D-cysteine (D-Cys, red). SEM images of resultant chiral nanoparticles obtained using L-Cys (b) and D-Cys (c). Schematic models and magnified SEM images are shown in the inset. Auxiliary lines indicating oppositely bent edges at an angle of + ϕ for L-Cys and − ϕ for D-Cys are illustrated in the SEM images. Scale bar, 100 nm. Reproduced with permission from Ref. 51. Copyright © 2020, Springer Nature
Fig. 10
Fig. 10
Formation schematic of enhanced chiral near-fields with uniform optical chirality in the gap of a coupled point dipole dimer (a) and Au spherical nanoparticle (10-nm diameter) dimer (b). a Analytically calculated chiral near-field distributions of (i) one dipole, (ii) two dipoles with a large gap d of 0.06λ, and (iii–iv) two dipoles with a small gap d of 0.04λ. Black arrows show the dipole momentum. Signs of “ + ” and “– “ in the scale bar indicate the field is left- and right-handed, respectively, which applies to all figures in the following. b Numerically calculated chiral near-field distributions of (i) one sphere, (ii) two spheres with a large gap d of 10 nm and (iii–iv) two dipoles with a small gap d of 2 nm. c Corresponding electric field distribution of the case (b)-iii. The right coordinates give incident polarization and direction. d Schematic of the directions of incident fields and scattered fields by a dipole dimer. Reproduced with permission from Ref. 64. Copyright © 2015, Springer Nature
Fig. 11
Fig. 11
a CD and b UV–Vis spectra of the GNR@CMS NPs templated by three types of different chiral surfactants: C16-L-Phe (black); C16-D-Phe (red); C16-DL-Phe (blue). “Reprinted with permission from Ref. 67. Copyright (2013) American Chemical Society”
Fig. 12
Fig. 12
Secondary structure analysis of PEPAuM,11 and PEPAuM‑ox,11. a CD measurements indicate that both PEPAu M,11 and PEPAu M‑ox,11 exhibit predominantly PPII secondary conformations in solution. b Structural similarity between PEPAu M,11 (blue) and PEPAu M‑ox,11 (red) sequences gathered via theoretical cross-peptide analysis. “Reprinted with permission from Ref. 70. Copyright (2019) American Chemical Society”
Scheme 1
Scheme 1
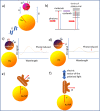
Schematic representation showing the mechanism of origin of CD effect. a The direction of magnetic vector and electric vector. b The coulomb interaction between energy states of dye molecule and the Au NPs. c and d The change in photo-induced CD signal with variation in the direction of electric vector of molecule. e Non-parallel interaction of chiral molecule (molecular plane) with the electric dipole of Au NPs and f the parallel interaction of chiral molecule (molecular plane) with the electric vector of Au NPs
Fig. 13
Fig. 13
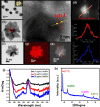
a and b BF-TEM images of Au NFs and a single Au NF, respectively, and c HRTEM image of a part of Au NF. d STEM-HAADF image. e EDX line profile. f Unfiltered image of a single Au NF. g EFTEM image of that Au NF. h Relative thickness map. i Line profile over the red rectangular box indicated in h. j CD spectra of chiral Au NFs. k Wide-angle XRD profile of Au NFs. “Reprinted with permission from Ref. 79. Copyright (2015) American Chemical Society”
Fig. 14
Fig. 14
Schematic illustration of a PCR-assembled HDs and b sequential post-assembly deposition of Ag and Au shell(s). “Reprinted with permission from Ref. 86. Copyright (2014) American Chemical Society”
Fig. 15
Fig. 15
Schematic illustration for the assembly of NP hetero dimers and their use for biological analysis. A, B The NP dimer was assembled from Au NPs and Ag NPs, which were functionalized with complementary biomacromolecules (A). For the detection of small peptides, exemplified by MCLR, the competitive immunorecognition assay was chosen to demonstrate its applicability to biological analysis. It results in a decrease of the CD amplitude (B). For detection of the fairly large proteins, exemplified by PSA, we used sandwich immunoassay mode. C Schematics of the NP dimers bridged by immunocomplexes used in competitive and sandwich immunoassays. “Reprinted with permission from Ref. 87. Copyright (2013) American Chemical Society”
Fig. 16
Fig. 16
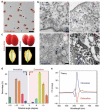
Chiral geometry of NP dimers. a TEM image of NP dimers in cell culture media; scale bar, 100 nm. b Bio-TEM images of NP dimers in the HeLa cells; scale bars, 100 nm. c TEM tomography images (bottom) of NP dimers both outside and inside cells with schematics of dimers’ geometry (top). d Statistical analysis of the dihedral angles θ for NP dimers inside and outside the cell as determined from cryo-TEM tomography images. The error bars correspond to the standard error of the mean (n = 3). The sign of the dihedral angle in these nanoscale structures was chosen in accord with the IUPAC convention. e Simulated CD spectra of NP dimers intra- and extracellular localization of NP dimers based on geometries from d. Reproduced with permission from Ref. 97. Copyright © 2017, Springer Nature”

Similar articles

Cited by

References

    1. Banzer P, Woniak P, Mick U, et al (2016) Chiral optical response of planar and symmetric nanotrimers enabled by heteromaterial selection. Nat Commun7:13117.10.1038/ncomms13117 - PMC - PubMed
    1. Wu W, Hu W, Qian G, et al (2019) Mechanical design and multifunctional applications of chiral mechanical metamaterials: a review. Mater Des 180:107950.10.1016/j.matdes.2019.107950
    1. Cheng X, Miao T, Qian Y, et al (2020) Supramolecular chirality in azobenzene-containing polymer system: traditional postpolymerization self-assembly versus in situ supramolecular self-assembly strategy. International J Mol Sci 21:6186.10.3390/ijms21176186 - PMC - PubMed
    1. Inaki M, Liu J, Matsuno K (2016) Cell chirality: its origin and roles in left–right asymmetric development. Philosophical Trans R Soc B: Biol Sci 371:1710.10.1098/rstb.2015.0403 - PMC - PubMed
    1. Chen Y, Ma W (2020) The origin of biological homochirality along with the origin of life. PLOS Comput Biol 16:e1007592.10.1371/journal.pcbi.1007592 - PMC - PubMed

MeSH terms

LinkOut - more resources