. 2022 Feb 1;43(2):733-749.
doi: 10.1002/hbm.25682. Epub 2021 Nov 23.

Microbiota links to neural dynamics supporting threat processing

Affiliations

Microbiota links to neural dynamics supporting threat processing

Caitlin V Hall et al. Hum Brain Mapp. .

Abstract

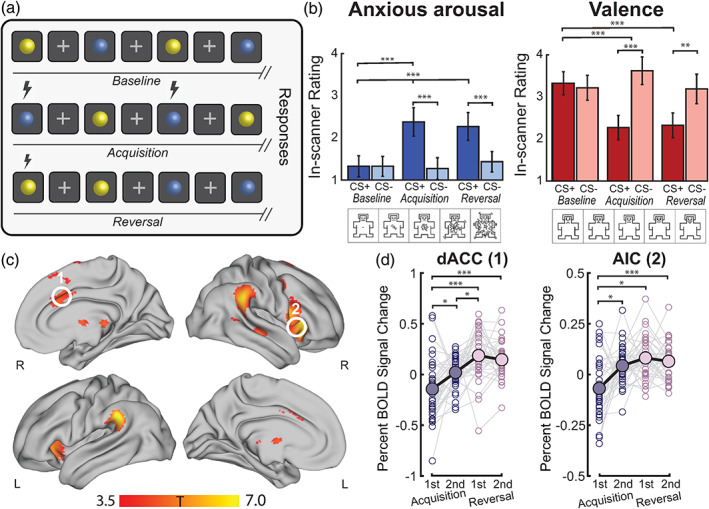
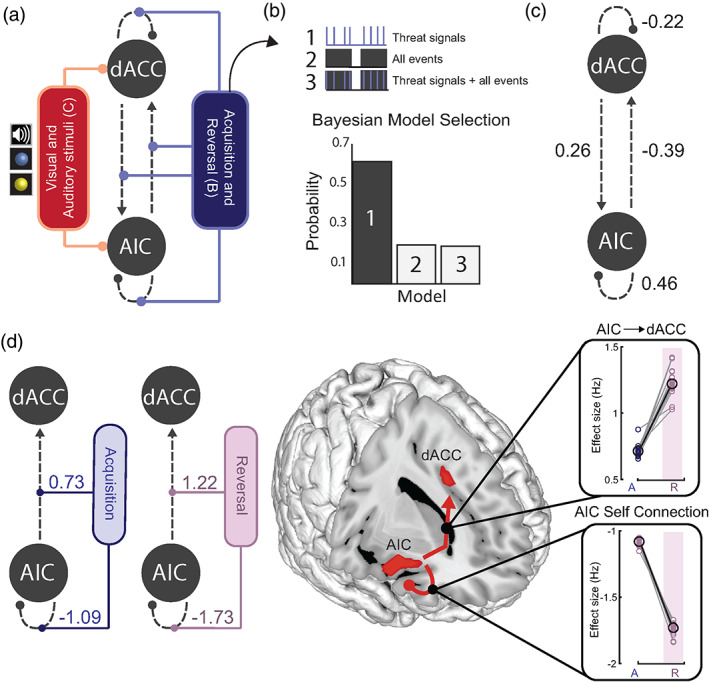
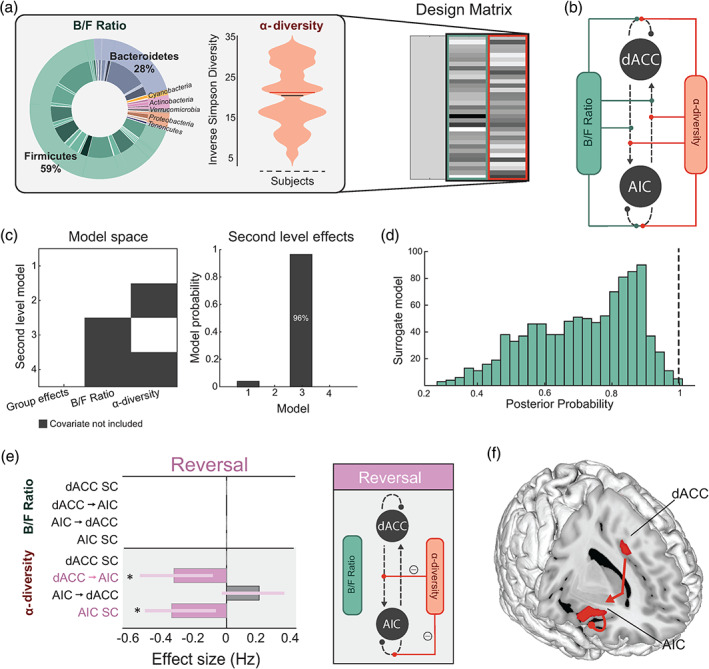
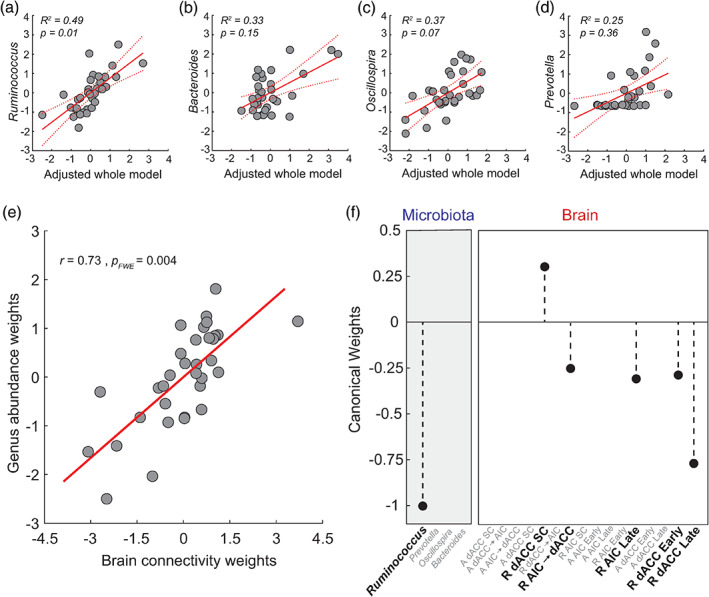
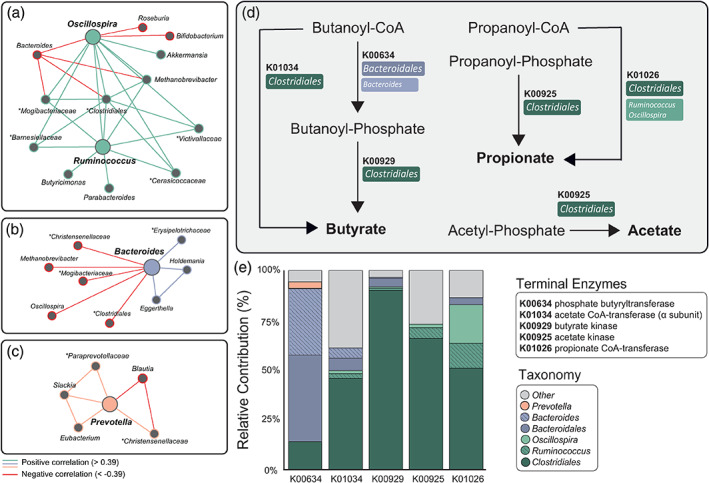
There is growing recognition that the composition of the gut microbiota influences behaviour, including responses to threat. The cognitive-interoceptive appraisal of threat-related stimuli relies on dynamic neural computations between the anterior insular (AIC) and the dorsal anterior cingulate (dACC) cortices. If, to what extent, and how microbial consortia influence the activity of this cortical threat processing circuitry is unclear. We addressed this question by combining a threat processing task, neuroimaging, 16S rRNA profiling and computational modelling in healthy participants. Results showed interactions between high-level ecological indices with threat-related AIC-dACC neural dynamics. At finer taxonomic resolutions, the abundance of Ruminococcus was differentially linked to connectivity between, and activity within the AIC and dACC during threat updating. Functional inference analysis provides a strong rationale to motivate future investigations of microbiota-derived metabolites in the observed relationship with threat-related brain processes.

Keywords: anterior insula; dorsal anterior cingulate; gut-brain axis; microbiota; neuroimaging; threat processing.


Conflict of interest statement

The authors declare no conflict of interest.

Figures

FIGURE 1
FIGURE 1
Behavioural results and neural correlates of threat acquisition and reversal. (a) Design of the threat processing paradigm implemented in the MRI scanner. The fMRI task lasted for 17 min and had three phases: baseline (top row), acquisition (middle row), and reversal (bottom row). Blue and yellow spheres were used as the conditioned stimuli (CS). Between each CS presentation, a white fixation cross appeared which served as a fixed interstimulus interval (ISI). The unconditioned stimulus (US, lightning bolt) was an aversive auditory burst. During acquisition, the US co‐terminated with one of the CS (forming a threat, CS+) and not with the other (forming a safety, CS−). During reversal, the pairing of the US and CS was switched. Immediately after each phase (in‐scanner, as a continuation of the task phase), participants were asked to rate the spheres in terms of subjective bodily anxiety sensations and affective valence on a five‐point Likert scale (Self‐Assessment Manikins, SAM; Bradley and Lang, 1994). (b) Behavioural results for subjective in‐scanner ratings of the threat and safety signals during baseline, acquisition and reversal for bodily anxiety sensations (left) and affective valence (right). The ratings confirmed the differential aversiveness of the threat relative to the safety signal, and the acquisition/reversal compared to the baseline stimulus (where no US was present). For post‐hoc t tests (Bonferroni‐corrected), **denotes p FWE < 0.001 and ***denotes p FWE < 0.0001. (c) The contrast overall (combining acquisition and reversal task phases) threat (CS+) > safety (CS−) was associated with significant (p FWE < 0.05 at cluster level, high threshold of p uncorrected < 0.001) group level activation in cortical and subcortical brain regions, including the mid dACC (white circle ‘1’) and right AIC (white circle ‘2’; details in Table S1). (d) The difference in mean percent BOLD signal change responses between threat and safety signals were assessed in the dACC and AIC during acquisition (first and second half) and reversal (first and second half). Solid dots and black lines represent the group‐level mean percent BOLD signal change responses. For post hoc paired t tests (Bonferroni‐corrected), *denotes p FWE < 0.05, and ***denotes p FWE < 0.0001
FIGURE 2
FIGURE 2
Neural dynamics supporting threat learning and updating. (a) Specification of the DCM model space in terms of: (i) task‐independent effective connectivity (grey, dashed lines) (A‐matrix); (ii) modulatory connections (B‐matrix) (blue), including threat signals in both acquisition and reversal task phases; and (iii) direct inputs to the system (C‐matrix) comprising visual (all CS events) and auditory (US) stimuli (red). (b) Three models were estimated for each subject (see text for details). The difference between models arises from the specification of contextual modulators (threat signals, all trials, or both). Bayesian Model Selection showed that the exclusive modulation by threat signals (Model 1) best explained the fMRI data (as accessed by the highest exceedance probability). (c) Results from Bayesian Model Reduction (BMR) on second level Parametric Empirical Bayes analysis of trial‐independent (fixed) connections across individuals. Results showed a positive modulation from the dACC to the AIC, a negative modulation from the AIC to the dACC, and local effects within both regions. (d) BMR results showed a significant modulatory effect of threat signals on patterns of effective connectivity during acquisition and reversal (left). Results highlight very consistent modulatory effects of task phase (from acquisition to reversal) on AIC → dACC (top, right) and AIC self‐connections (bottom, right)
FIGURE 3
FIGURE 3
Effects of high‐level microbial properties on threat learning and updating. (a) Inlet (left) shows the mean proportions of B/F, and the violin plot (middle) shows the distribution of α‐diversity (Inverse Simpson diversity) scores in our samples (n = 38). These two microbiota features constituted our two regressors in the Parametric Empirical Bayes model (design matrix columns two and three, right). The first column models the group mean. (b) Specification of the model space showing all possible modulatory connections where the microbiota features can interact within the AIC‐dACC network. (c) Model space (left) showing possible second level models (including a null model), where both covariates (Model 1), one covariate (Models 2 and 3), or no covariates (Model 4, null) contribute to the model evidence. The winning second level model (right) included the second covariate (Model 3), at a posterior probability (Pp) of 0.96. (d) Distribution of Pp results from surrogate testing. Dashed black line indicates the Pp (0.96) of the winning model for the original (nonpermuted) data. (e) Results from Bayesian Model Reduction (BMR) showing the effect sizes (expressed in Hz) of modulatory connections associated with α‐diversity during threat reversal. Significant parameters are those with a Pp > 0.95, indicated with an asterisk. The length of the bars corresponds to the expected probability (Ep) and the error bars are 90% Bayesian confidence intervals. SC represents self‐connections. (f) Anatomical representation showing the significant modulatory connections associated with α‐diversity during the threat reversal phase
FIGURE 4
FIGURE 4
Associations between the driving genera and threat‐related brain processes. Principal components analysis (PCA) was used to reduce the dimensionality of brain variables, which resulted in seven PCs representing connectivity strengths during threat learning (task acquisition phase), threat reversal (task reversal phase), and percent BOLD signal change responses at the AIC and dACC. Results from four independent multiple regressions showed that brain responses predicted the relative abundance of Ruminococcus (a). While there were individual regression weights that were significant for (b) Bacteroides and (c) Oscillospira, the overall regression model was not significant. Variance in (d) Prevotella was not related to any specific set of brain measures. 95% confidence intervals are represented by the dashed red lines. (e) Multivariate analysis (sparse CCA, sCCA) showed a single significant mode of population covariation linking threat processing measures of brain activity and effective connectivity with Ruminococcus abundance. (f) Bold text shows microbiome and brain weights (coefficients) contributing to the sCCA. Features in grey text represent zero‐contributing features to the sCCA, as imposed by the l1‐norm penalty term. Brain variables prefixed with an ‘A' refer to those occurring in the task acquisition phase, ‘R' refers to brain variables in the task reversal phase, and ‘SC’ refers to modulatory self‐connections
FIGURE 5
FIGURE 5
Link between microbiota genera associated to threat‐related brain processes and functional pathways supporting the production of short‐chain fatty acids. Co‐occurrence and co‐exclusion relationships between the driving genera (large nodes) including (a) Ruminococcus/Oscillospira, (b) Bacteroides, and (c) Prevotella. Unclassified genera are described at a broader taxonomic rank above genus level (i.e. family or order) and are marked by asterisks. Graphs are visualised as a force‐directed layout using Gephi (Version 0.9.2), using the force atlas template (Bastian et al., 2009). (d) Metabolic pathways (derived from the Kyoto Encyclopaedia of Genes and Genomes pathways) representing final enzymatic conversions (terminal enzymes) involved in butyrate, propionate, and acetate production. The major contributor(s) to each gene‐encoding enzyme have been identified in coloured boxes. (e) Decomposition of core/major genera and orders contributing to SCFA pathways. Dark tones represent contributions from a higher taxonomic rank: order. Hatched and lighter tones represent contributions from driving genera

References

    1. Aatsinki, A.‐K. , Lahti, L. , Uusitupa, H.‐M. , Munukka, E. , Keskitalo, A. , Nolvi, S. , … Karlsson, L. (2019). Gut microbiota composition is associated with temperament traits in infants. Brain, Behavior, and Immunity, 80, 849–858. - PubMed
    1. Allman, J. M. , Tetreault, N. A. , Hakeem, A. Y. , Manaye, K. F. , Semendeferi, K. , Erwin, J. M. , … Hof, P. R. (2010). The von Economo neurons in frontoinsular and anterior cingulate cortex in great apes and humans. Brain Structure and Function, 214, 495–517. - PubMed
    1. Arumugam, M. , Raes, J. , Pelletier, E. , Le Paslier, D. , Yamada, T. , Mende, D. R. , … Meta, H. I. T. C. (2011). Enterotypes of the human gut microbiome. Nature, 473, 174–180. - PMC - PubMed
    1. Azzalini, D. , Rebollo, I. , & Tallon‐Baudry, C. (2019). Visceral signals shape brain dynamics and cognition. Trends in Cognitive Sciences, 23, 488–509. - PubMed
    1. Bastian, M. , Heymann, S. , Jacomy, M. , 2009. Gephi: An open source software for exploring and manipulating networks. Third International AAAI Conference on Weblogs and Social Media.

Publication types

Substances