. 2021 Dec;20(12):e13522.
doi: 10.1111/acel.13522. Epub 2021 Nov 22.

α-synuclein suppresses microglial autophagy and promotes neurodegeneration in a mouse model of Parkinson's disease

Affiliations

α-synuclein suppresses microglial autophagy and promotes neurodegeneration in a mouse model of Parkinson's disease

Hai-Yue Tu et al. Aging Cell. 2021 Dec.

Abstract

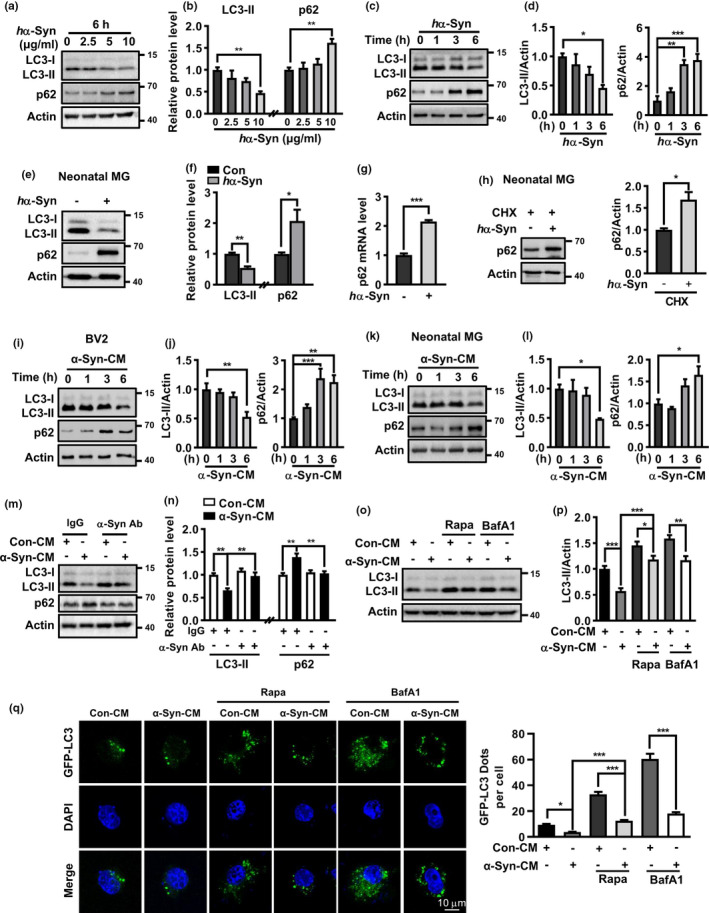
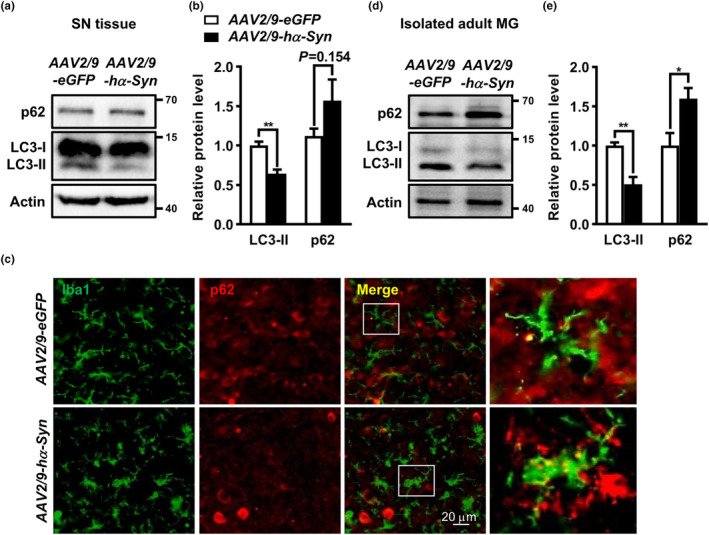
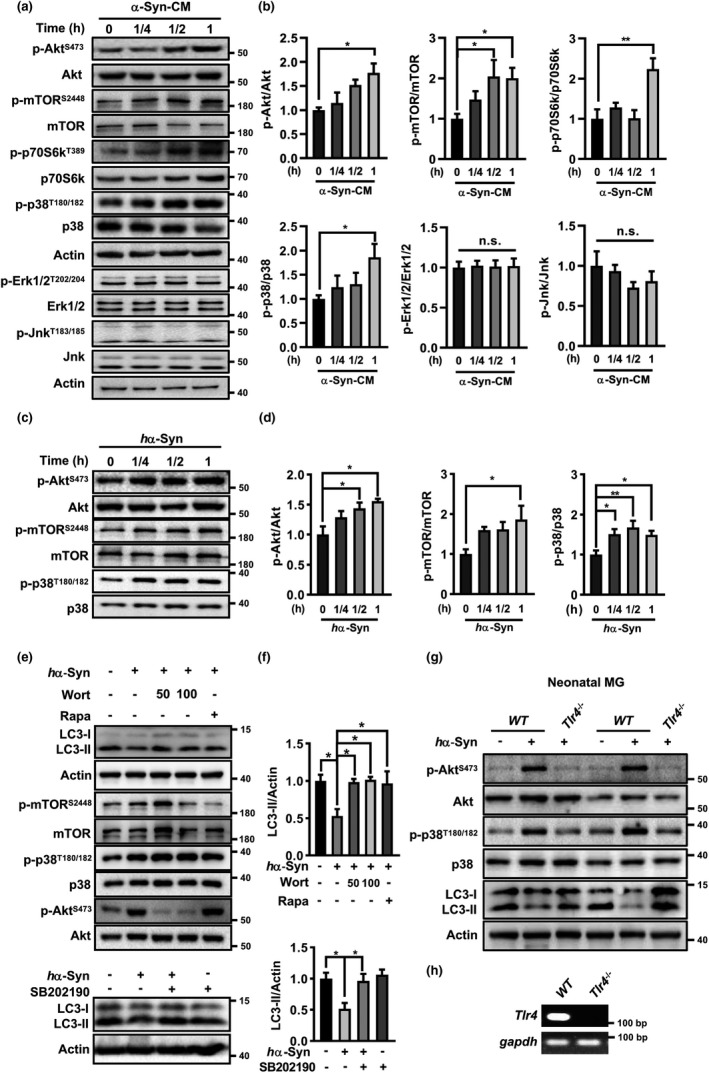
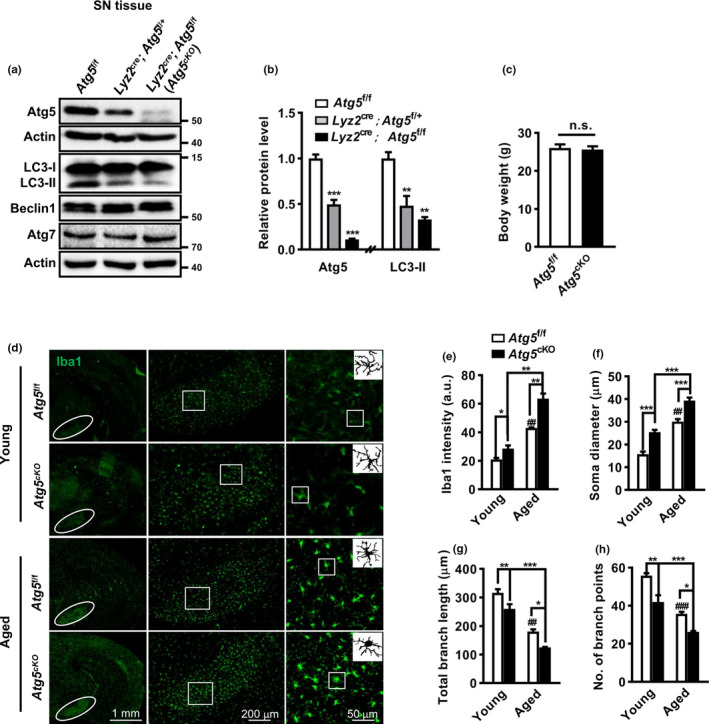
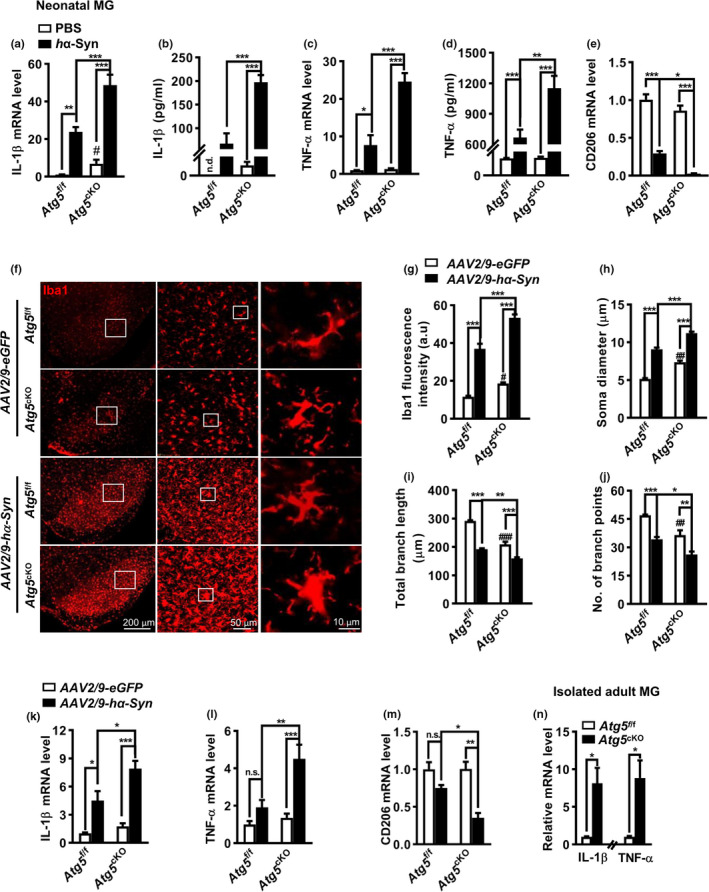
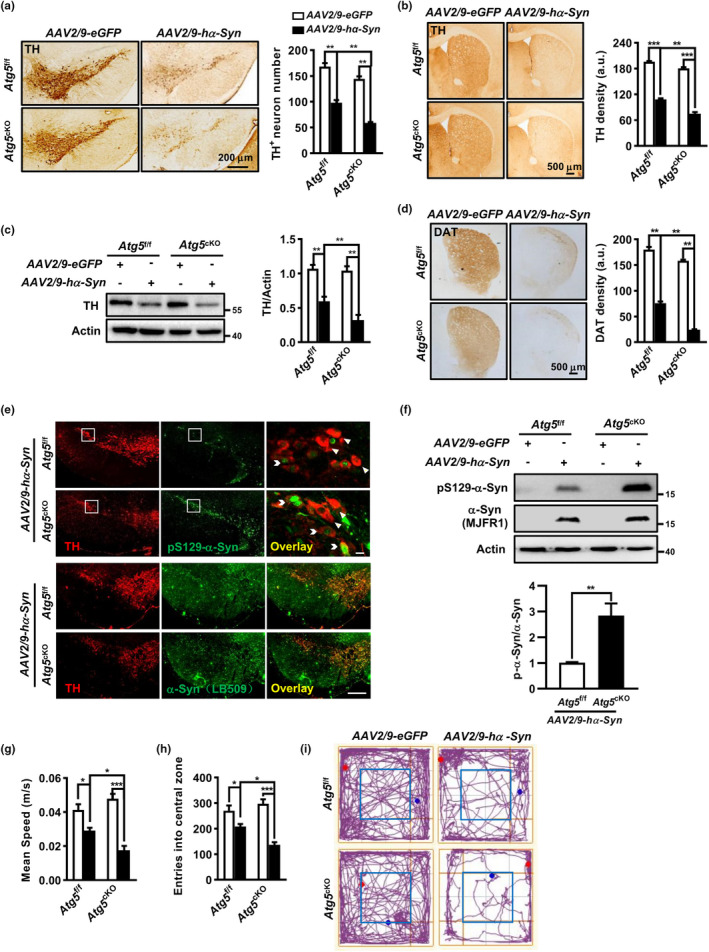
The cell-to-cell transfer of α-synuclein (α-Syn) greatly contributes to Parkinson's disease (PD) pathogenesis and underlies the spread of α-Syn pathology. During this process, extracellular α-Syn can activate microglia and neuroinflammation, which plays an important role in PD. However, the effect of extracellular α-Syn on microglia autophagy is poorly understood. In the present study, we reported that extracellular α-Syn inhibited the autophagy initiation, as indicated by LC3-II reduction and p62 protein elevation in BV2 and cultured primary microglia. The in vitro findings were verified in microglia-enriched population isolated from α-Syn-overexpressing mice induced by adeno-associated virus (AAV2/9)-encoded wildtype human α-Syn injection into the substantia nigra (SN). Mechanistically, α-Syn led to microglial autophagic impairment through activating toll-like receptor 4 (Tlr4) and its downstream p38 and Akt-mTOR signaling because Tlr4 knockout and inhibition of p38, Akt as well as mTOR prevented α-Syn-induced autophagy inhibition. Moreover, inhibition of Akt reversed the mTOR activation but failed to affect p38 phosphorylation triggered by α-Syn. Functionally, the in vivo evidence showed that lysozyme 2 Cre (Lyz2cre )-mediated depletion of autophagy-related gene 5 (Atg5) in microglia aggravated the neuroinflammation and dopaminergic neuron losses in the SN and exacerbated the locomotor deficit in α-Syn-overexpressing mice. Taken together, the results suggest that extracellular α-Syn, via Tlr4-dependent p38 and Akt-mTOR signaling cascades, disrupts microglial autophagy activity which synergistically contributes to neuroinflammation and PD development.

Keywords: Parkinson's disease; autophagy; microglia; neuroinflammation; α-synuclein.


Conflict of interest statement

We have no potential conflict of interest to be disclosed.

Figures

FIGURE 1
FIGURE 1
Human α‐Synuclein inhibited microglial autophagy. (a–d) Western blot and quantification of p62 protein and LC3‐II levels in hα‐Syn‐treated BV2 cells in dose‐ and time‐dependent manners. One‐way ANOVA with Dunnett's post hoc, n = 3–4. (e, f) p62 protein and LC3‐II levels in hα‐Syn (10 μg/ml, 6 h)‐treated primary microglia. Student t test, n = 3. (g) p62 mRNA level in hα‐Syn (10 μg/ml, 6 h)‐treated microglia. Student t test, n = 4. (h) p62 protein level in hα‐Syn (24 h)‐treated microglia in the presence of CHX. Student t test, n = 3. (i‐l) p62 and LC3‐II levels in hα‐Syn‐CM‐treated BV2 cells (i, j) and microglia (k, l). One‐way ANOVA with Dunnett's post hoc, n = 5. (m, n) Pre‐incubation with anti‐hα‐Syn but not IgG abolished the effect of α‐Syn‐CM on p62 protein and LC3‐II levels. Control group was treated with CM from normal PC12 cells (Con‐CM). One‐way ANOVA with Tukey's post hoc, n = 4–5. (o, p) Effect of Rapa (5 μM) or BafA1 (50 nM) on LC3‐II levels in α‐Syn‐CM‐treated BV2 cells. One‐way ANOVA with Tukey's post hoc, n = 6. (q) Imaging for GFP‐LC3 dots formation in GFP‐LC3‐transfected BV2 cells following various treatments for 6 h. Scale bar, 10 μm. At least 30 cells per group were counted. One‐way ANOVA with Tukey's post hoc, *p < 0.05, **p < 0.01, and ***p < 0.001
FIGURE 2
FIGURE 2
Alterations of autophagy‐related proteins in the midbrain of Syn‐overexpressing mice. (a, b) LC3‐II and p62 protein levels in the SN from C57BL/6 mice at 4 weeks following AAV2/9Syn or AAV2/9eGFP injection. Student t test, n = 5. (c) Midbrain sections from AAV2/9Syn‐ or AAV2/9eGFP‐injected mice were double stained with anti‐Iba1 and anti‐p62. White arrows indicate typical colocalization of Iba1 and p62 signal under confocal scanning. Scale bar, 20 μm. (d, e) p62 and LC3‐II protein levels in the microglia isolated from AAV2/9Syn‐ or AAV2/9eGFP‐injected mice at 4 weeks. Student t test, n = 3. *p < 0.05, **p < 0.01
FIGURE 3
FIGURE 3
Tlr4‐dependent p38 MAPK and Akt/mTOR signaling mediated the autophagy inhibition by hα‐Syn. (a–d) α‐Syn‐CM‐treated BV2 cells (a, b) and hα‐Syn‐treated microglia (c, d) for various periods. Control group was treated with Con‐CM. Western blot analysis for various kinases phosphorylations. One‐way ANOVA with Dunnett's post hoc, n = 3–5. *p < 0.05, **p < 0.01, n.s., not significant. (e–f) hα‐Syn‐treated microglia (6 h) in the absence or presence of inhibitors for p38 MAPK (SB202190, 1 μM), Akt (Wort, 50, 100 nM) or mTOR (Rapa, 5 μM). One‐way ANOVA with Tukey's post hoc, n = 3–5. *p < 0.05. (g) hα‐Syn failed to activate p38 and Akt and inhibit autophagy in Tlr4 −/− microglia from Tlr4 KO mice compared with normal microglia from wildtype (WT) C57BL/6 mice. (h) RT‐PCR verification of Tlr4 deficiency in microglia from Tlr4 KO mice
FIGURE 4
FIGURE 4
Age‐dependent changes of microglia phenotype in Atg5 f/f and Atg5 cKO mice. (a, b) Western blot for Atg5, LC3, Beclin1, and Atg7 in the SN of Atg5f/f, Lyz2 Cre/+; Atg5 f/+ and Lyz2 Cre/+; Atg5 f/f mice. Actin served as controls. One‐way ANOVA with Dunnett's post hoc, n = 3. (c) The body weight of Atg5 f/f (n = 11) and Atg5 cKO (n = 9) mice at 5 months old. Student t test, n.s., not significant. (d) Iba1 staining and images in the SN (right panel) of young (2 months old) and aged (12–15 months old) Atg5 f/f and Atg5 cKO mice. (e–h) Analyses of Iba1 intensity (e, young group n = 6, aged group n = 3), soma diameter (f), branch length (g), and endpoints number (h) of microglia in the SN. a.u., arbitrary unit. n = 4 brains with a total of 30–50 cells per group for analysis. Two‐way ANOVA with Tukey's post hoc, *p < 0.05, **p < 0.01, ***p < 0.001, ## p < 0.01, and ### p < 0.001 versus young Atg5 f/f mice
FIGURE 5
FIGURE 5
Autophagy regulated microglia‐mediated inflammation in vitro and in vivo. (a–e) Quantitative PCR of IL (a), TNFα (c) and CD206 (e) mRNA levels and ELISA results (b, d) in PBS (control) or hα‐Syn‐treated microglia (MG) from Atg5 f/f and Atg5 cKO pups, n = 4. (f) Iba1 staining in the SN from AAV2/9Syn‐ or AAV2/9eGFP‐injected Atg5 f/f and Atg5 cKO mice at 4 weeks. (g–j) Quantification of Iba1 intensity (g, n = 6), soma diameter (h), branch length (i), and endpoints number (j) of microglia in (f). n = 4 brains with a total of 40–50 cells per group for analysis. (k–m) IL, TNFα, and CD206 mRNA levels in the SN lysates of Atg5 f/f and Atg5 cKO mice at 4 weeks after AAV2/9Syn or AAV2/9eGFP injection, n = 3–5. Two‐way ANOVA with Tukey's post hoc, *p < 0.05, **p < 0.01, ***p < 0.001. # p < 0.05, ## p < 0.01, and ### p < 0.001 compared with AAV2/9eGFP‐injected Atg5 f/f control, n.s., not significant. (n) Quantitative PCR for TNFα (n=3) and IL (n=4) mRNA levels in the SN from Atg5 f/f and Atg5 cKO mice. Student t test, *p < 0.05
FIGURE 6
FIGURE 6
Microglia autophagy deficiency exacerbated DA neurodegeneration and locomotor deficits in Syn‐overexpressing mice. (a, b) Coronal SNpc (a) and striatum (b) sections at 8 weeks post injection and quantification for TH+ neuron number (n = 6 brains) and terminal density (n = 4 brains), respectively. (c) TH protein level in the SN. Two‐way ANOVA with Tukey's post hoc, n = 5. (d) Striatal sections and group data of DAT density (n = 4 brains). Two‐way ANOVA with Tukey's post hoc. (e, f) Total and phosphorylated (S129) hα‐Syn in the SN of AAV2/9Synor AAV2/9eGFP‐injected Atg5 f/f and Atg5 cKO mice at 8 weeks, assessed by immunostaining (e) and western blot (f). Scale bar, 200 μm and 10 μm. Student t test, n = 4. (g–i) Open field test for AAV2/9Syn (n = 8 for each genotype) or AAV2/9eGFP (n = 10 for each genotype) ‐injected mice. Mean speed of locomotion (g) and entries into the central zone (h) were quantified. (i) Representative trajectory pmap. Two‐way ANOVA with Tukey's post hoc, *p < 0.05, **p < 0.01, and ***p < 0.001

References

    1. Ahmed, I. , Liang, Y. , Schools, S. , Dawson, V. L. , Dawson, T. M. , & Savitt, J. M. (2012). Development and characterization of a new Parkinson's disease model resulting from impaired autophagy. Journal of Neuroscience, 32(46), 16503–16509. 10.1523/JNEUROSCI.0209-12.2012 - DOI - PMC - PubMed
    1. Bae, E. J. , Lee, H. J. , Rockenstein, E. , Ho, D. H. , Park, E. B. , Yang, N. Y. , Desplats, P. , Masliah, E. , & Lee, S. J. (2012). Antibody‐aided clearance of extracellular alpha‐synuclein prevents cell‐to‐cell aggregate transmission. Journal of Neuroscience, 32(39), 13454–13469. 10.1523/JNEUROSCI.1292-12.2012 - DOI - PMC - PubMed
    1. Bartels, T. , Choi, J. G. , & Selkoe, D. J. (2011). Alpha‐synuclein occurs physiologically as a helically folded tetramer that resists aggregation. Nature, 477(7362), 107–110. 10.1038/nature10324 - DOI - PMC - PubMed
    1. Beilina, A. , & Cookson, M. R. (2016). Genes associated with Parkinson's disease: Regulation of autophagy and beyond. Journal of Neurochemistry, 139(Suppl 1), 91–107. 10.1111/jnc.13266 - DOI - PMC - PubMed
    1. Cheng, J. , Liao, Y. , Dong, Y. , Hu, H. , Yang, N. , Kong, X. , Li, S. , Li, X. , Guo, J. , Qin, L. , Yu, J. , Ma, C. , Li, J. , Li, M. , Tang, B. , & Yuan, Z. (2020). Microglial autophagy defect causes Parkinson disease‐like symptoms by accelerating inflammasome activation in mice. Autophagy, 16(12), 2193–2205. 10.1080/15548627.2020.1719723 - DOI - PMC - PubMed

Publication types

Substances