. 2022 Mar;6(3):513-525.
doi: 10.1002/hep4.1825. Epub 2021 Nov 23.

Lipidomics and Redox Lipidomics Indicate Early Stage Alcohol-Induced Liver Damage

Affiliations

Lipidomics and Redox Lipidomics Indicate Early Stage Alcohol-Induced Liver Damage

Jeremy P Koelmel et al. Hepatol Commun. 2022 Mar.

Abstract

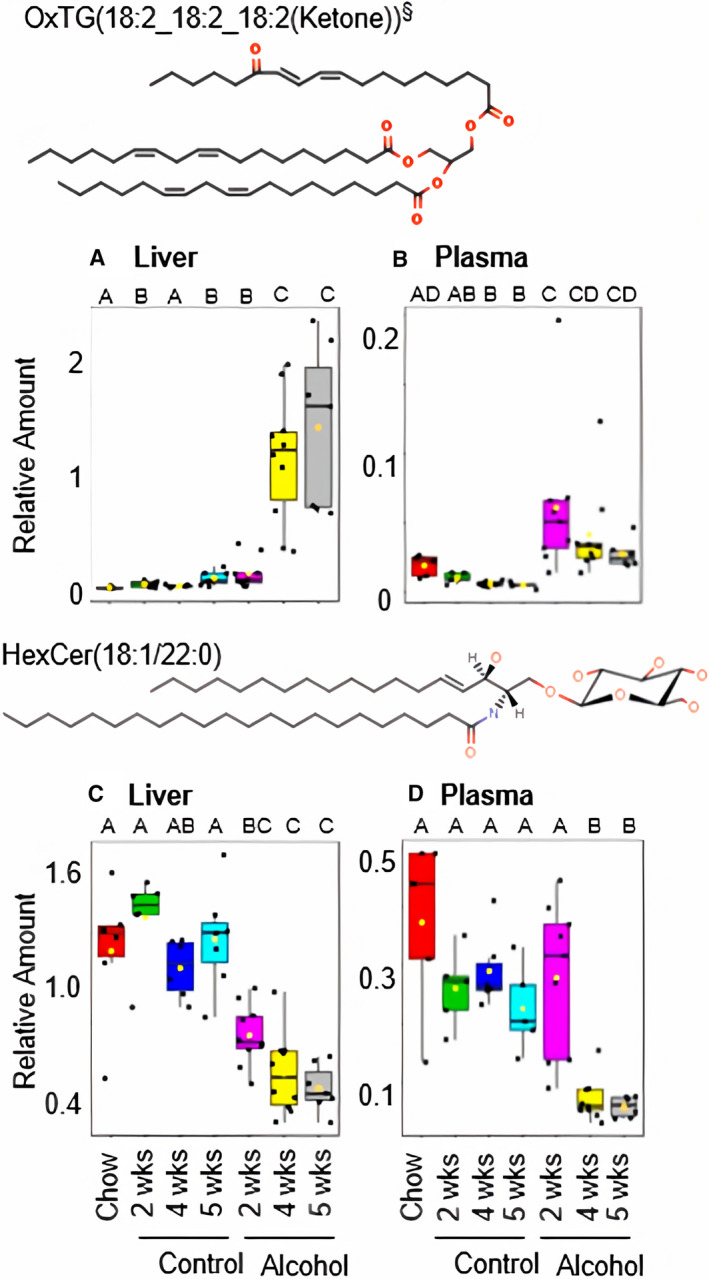
Alcoholic fatty liver disease (AFLD) is characterized by lipid accumulation and inflammation and can progress to cirrhosis and cancer in the liver. AFLD diagnosis currently relies on histological analysis of liver biopsies. Early detection permits interventions that would prevent progression to cirrhosis or later stages of the disease. Herein, we have conducted the first comprehensive time-course study of lipids using novel state-of-the art lipidomics methods in plasma and liver in the early stages of a mouse model of AFLD, i.e., Lieber-DeCarli diet model. In ethanol-treated mice, changes in liver tissue included up-regulation of triglycerides (TGs) and oxidized TGs and down-regulation of phosphatidylcholine, lysophosphatidylcholine, and 20-22-carbon-containing lipid-mediator precursors. An increase in oxidized TGs preceded histological signs of early AFLD, i.e., steatosis, with these changes observed in both the liver and plasma. The major lipid classes dysregulated by ethanol play important roles in hepatic inflammation, steatosis, and oxidative damage. Conclusion: Alcohol consumption alters the liver lipidome before overt histological markers of early AFLD. This introduces the exciting possibility that specific lipids may serve as earlier biomarkers of AFLD than those currently being used.


Figures

FIG. 1
FIG. 1
Scheme of treatment regime. Male C57BL/6J mice (10‐12 weeks old) were randomly divided into seven groups. The chow group was fed standard rodent chow. EtOH groups (GE1, GE2, GE3) and pair‐fed control groups (GC1, GC2, GC3) were fed a modified LD diet for up to 5 weeks. GE groups started with an LD diet containing 2% EtOH vol/vol with a weekly increase of 1% EtOH (vol/vol) until it reached 5% (vol/vol). GC groups received an LD diet (CON) in which the EtOH content was substituted by carbohydrates. On day 6‐7 (3 pm to 9 am) of week 2 (GE1 and GC1), week 4 (GE2 and GC2), or week 5 (GE3 and GC3), mice were placed singly in a metabolic cage with free access to the corresponding LD diet for 18 hours and then subjected to 4 hours fasting in regular housing cages before being euthanized. Abbreviations: CON, control; EtOH, ethanol.
FIG. 2
FIG. 2
Percentage of liver and plasma lipids per class significantly up‐regulated or down‐regulated across time and in comparison to controls. Alterations (increases or decreases) in classes of lipids in ethanol‐consuming mice are expressed as a categorical percentage change relative to levels (i) at previous treatment times (2, 4, or 5 weeks) or (ii) in control mice at the same treatment time. Line direction(s) represent the direction of differences between treatment times, whereas the position of colored squares (above or below the circle) indicates whether lipids are higher in ethanol‐fed mice or controls. Significantly up‐regulated and/or down‐regulated lipid species were determined by an FDR‐corrected ANOVA with Tukey post hoc test, with P < 0.05 and a fold change of 1.25 (or 0.8 if lipid levels in ethanol‐fed mice were lower than controls or previous time points). §Values in parentheses represent the number of species per class annotated by LipidMatch Flow for liver and plasma samples, respectively. Abbreviation: AcCar: acylcarnitine.
FIG. 3
FIG. 3
Boxplots of an OxTG and HexCer lipid molecule with significant changes across time and between ethanol‐fed and control mice. Minimum, first, second, and third quartile and maximum were used to generate boxplots; individual samples are also shown (dots). Relative amounts of OxTG(18:2_18:2_18:2[ketone]) in (A) liver and (B) plasma; (C) HexCer(d18:1/22:0) in liver and (D) plasma are shown (class‐based internal standard normalization applied). Both species show significant changes across time points and between alcohol‐fed and control (pair‐fed) mice. Significance was determined by an FDR (Benjamini‐Hochberg)‐corrected ANOVA with Tukey post‐hoc test (P < 0.05). Groupings with the same letters are not significantly different from one another, whereas those without the same letters are. §The peak representing OxTG(18:2_18:2_18:2[ketone]) also consisted of OxTG(16:0_18:2_20:4[ketone]) as a smaller fraction. Abbreviations: HexCer, hexosylceramide; wks, weeks.
FIG. 4
FIG. 4
Number of instances (frequency) of fatty acyl constituents in up‐regulated and down‐regulated lipids (y axis) in 5 weeks for alcohol‐fed mice versus controls colored by lipid class. Fatty acyl constituents are shown across the x axis. Lipids contain one or more fatty acyl constituent bound to a backbone and head group, and the up‐regulation or down‐regulation of lipids containing these fatty acids can be indicative of the release of these fatty acids for downstream signaling in certain pathways (e.g., inflammatory pathways). The instances (frequency) of fatty acyl constituents contained in lipids that were up‐regulated (i.e., higher in alcohol‐fed mice compared to pair‐fed controls) or down‐regulated (i.e., lower in alcohol‐fed mice compared to pair‐fed controls) are shown (A) for HexCer, Cer, and SM in liver; (B) for DG, PE, and PG in liver; (C) for HexCer, Cer, and SM in plasma; (D) for DG, PE, and PC in plasma samples. Significant changes (P < 0.05) between lipids in the alcohol fed‐group and the control group were determined by an FDR‐corrected (Benjamini‐Hochberg) ANOVA followed by Tukey post hoc test. For sphingolipids shown in (A), the fatty acyl chain on the sn2 position was used to calculate frequencies, whereas for DG, PG, PC, and PE, the longest carbon chain (or both if carbon chain lengths were equal) was used for the fatty acyl frequency calculations. On the plot, 0 refers to no significant lipids contained the corresponding fatty acyl constituent. Abbreviation: HexCer, hexosylceramide.
FIG. 5
FIG. 5
Lipid changes in mouse liver determined by LipidMatch Flow indicative of steatosis, oxidative damage, and inflammation in ethanol‐fed mice. PC is hydrolyzed by three phospholipase enzymes (D, C, and A2) at the plasma membrane. Phospholipase D results in the synthesis of phosphatidic acid and choline; phospholipase C results in DG and phosphatidylcholine head group, which is used in SM synthesis; and phospholipase A2 forms LPC and fatty acids. DG and LPC are involved in intracellular cellular signaling. DG can undergo acylation to form TG (leading to steatosis). TG undergoes further oxidation by ROS to form OxTG. C20 and C22 fatty acids are released from various sources, such as DGs, sphingolipids, and PEs. They can undergo oxidation, forming oxylipins and aldehydes. Oxylipins, such as eicosanoids, are then used in cellular signaling, such as in the inflammatory pathway. Aldehydes can cause cellular damage or undergo further reaction, such as carbonylation to form signaling molecules or dehydrogenation to form acetate.

References

    1. Ten Hove M, Pater L, Storm G, Weiskirchen S, Weiskirchen R, Lammers T, et al. The hepatic lipidome: from basic science to clinical translation. Adv Drug Deliv Rev 2020;159:180‐197. - PubMed
    1. Reddy JK, Rao MS. Lipid metabolism and liver inflammation. II. Fatty liver disease and fatty acid oxidation. Am J Physiol Gastrointest Liver Physiol 2006;290:G852‐G858. - PubMed
    1. World Health Organization . Global status report on alcohol and health 2018. https://www.who.int/publications‐detail‐redirect/9789241565639. Published September 27, 2018. Accessed May 2021.
    1. Tsochatzis EA, Bosch J, Burroughs AK. Liver cirrhosis. Lancet 2014;383:1749‐1761. - PubMed
    1. Grant BF, Chou SP, Saha TD, Pickering RP, Kerridge BT, Ruan WJ, et al. Prevalence of 12‐month alcohol use, high‐risk drinking, and DSM‐IV alcohol use disorder in the United States, 2001‐2002 to 2012‐2013: results from the National Epidemiologic Survey on Alcohol and Related Conditions. JAMA Psychiatry 2017;74:911‐923. - PMC - PubMed

Publication types