

MSD-Net: Multi-Scale Discriminative Network for COVID-19 Lung Infection Segmentation on CT
- PMID: 34812359
- PMCID: PMC8545278
- DOI: 10.1109/ACCESS.2020.3027738
MSD-Net: Multi-Scale Discriminative Network for COVID-19 Lung Infection Segmentation on CT
Abstract
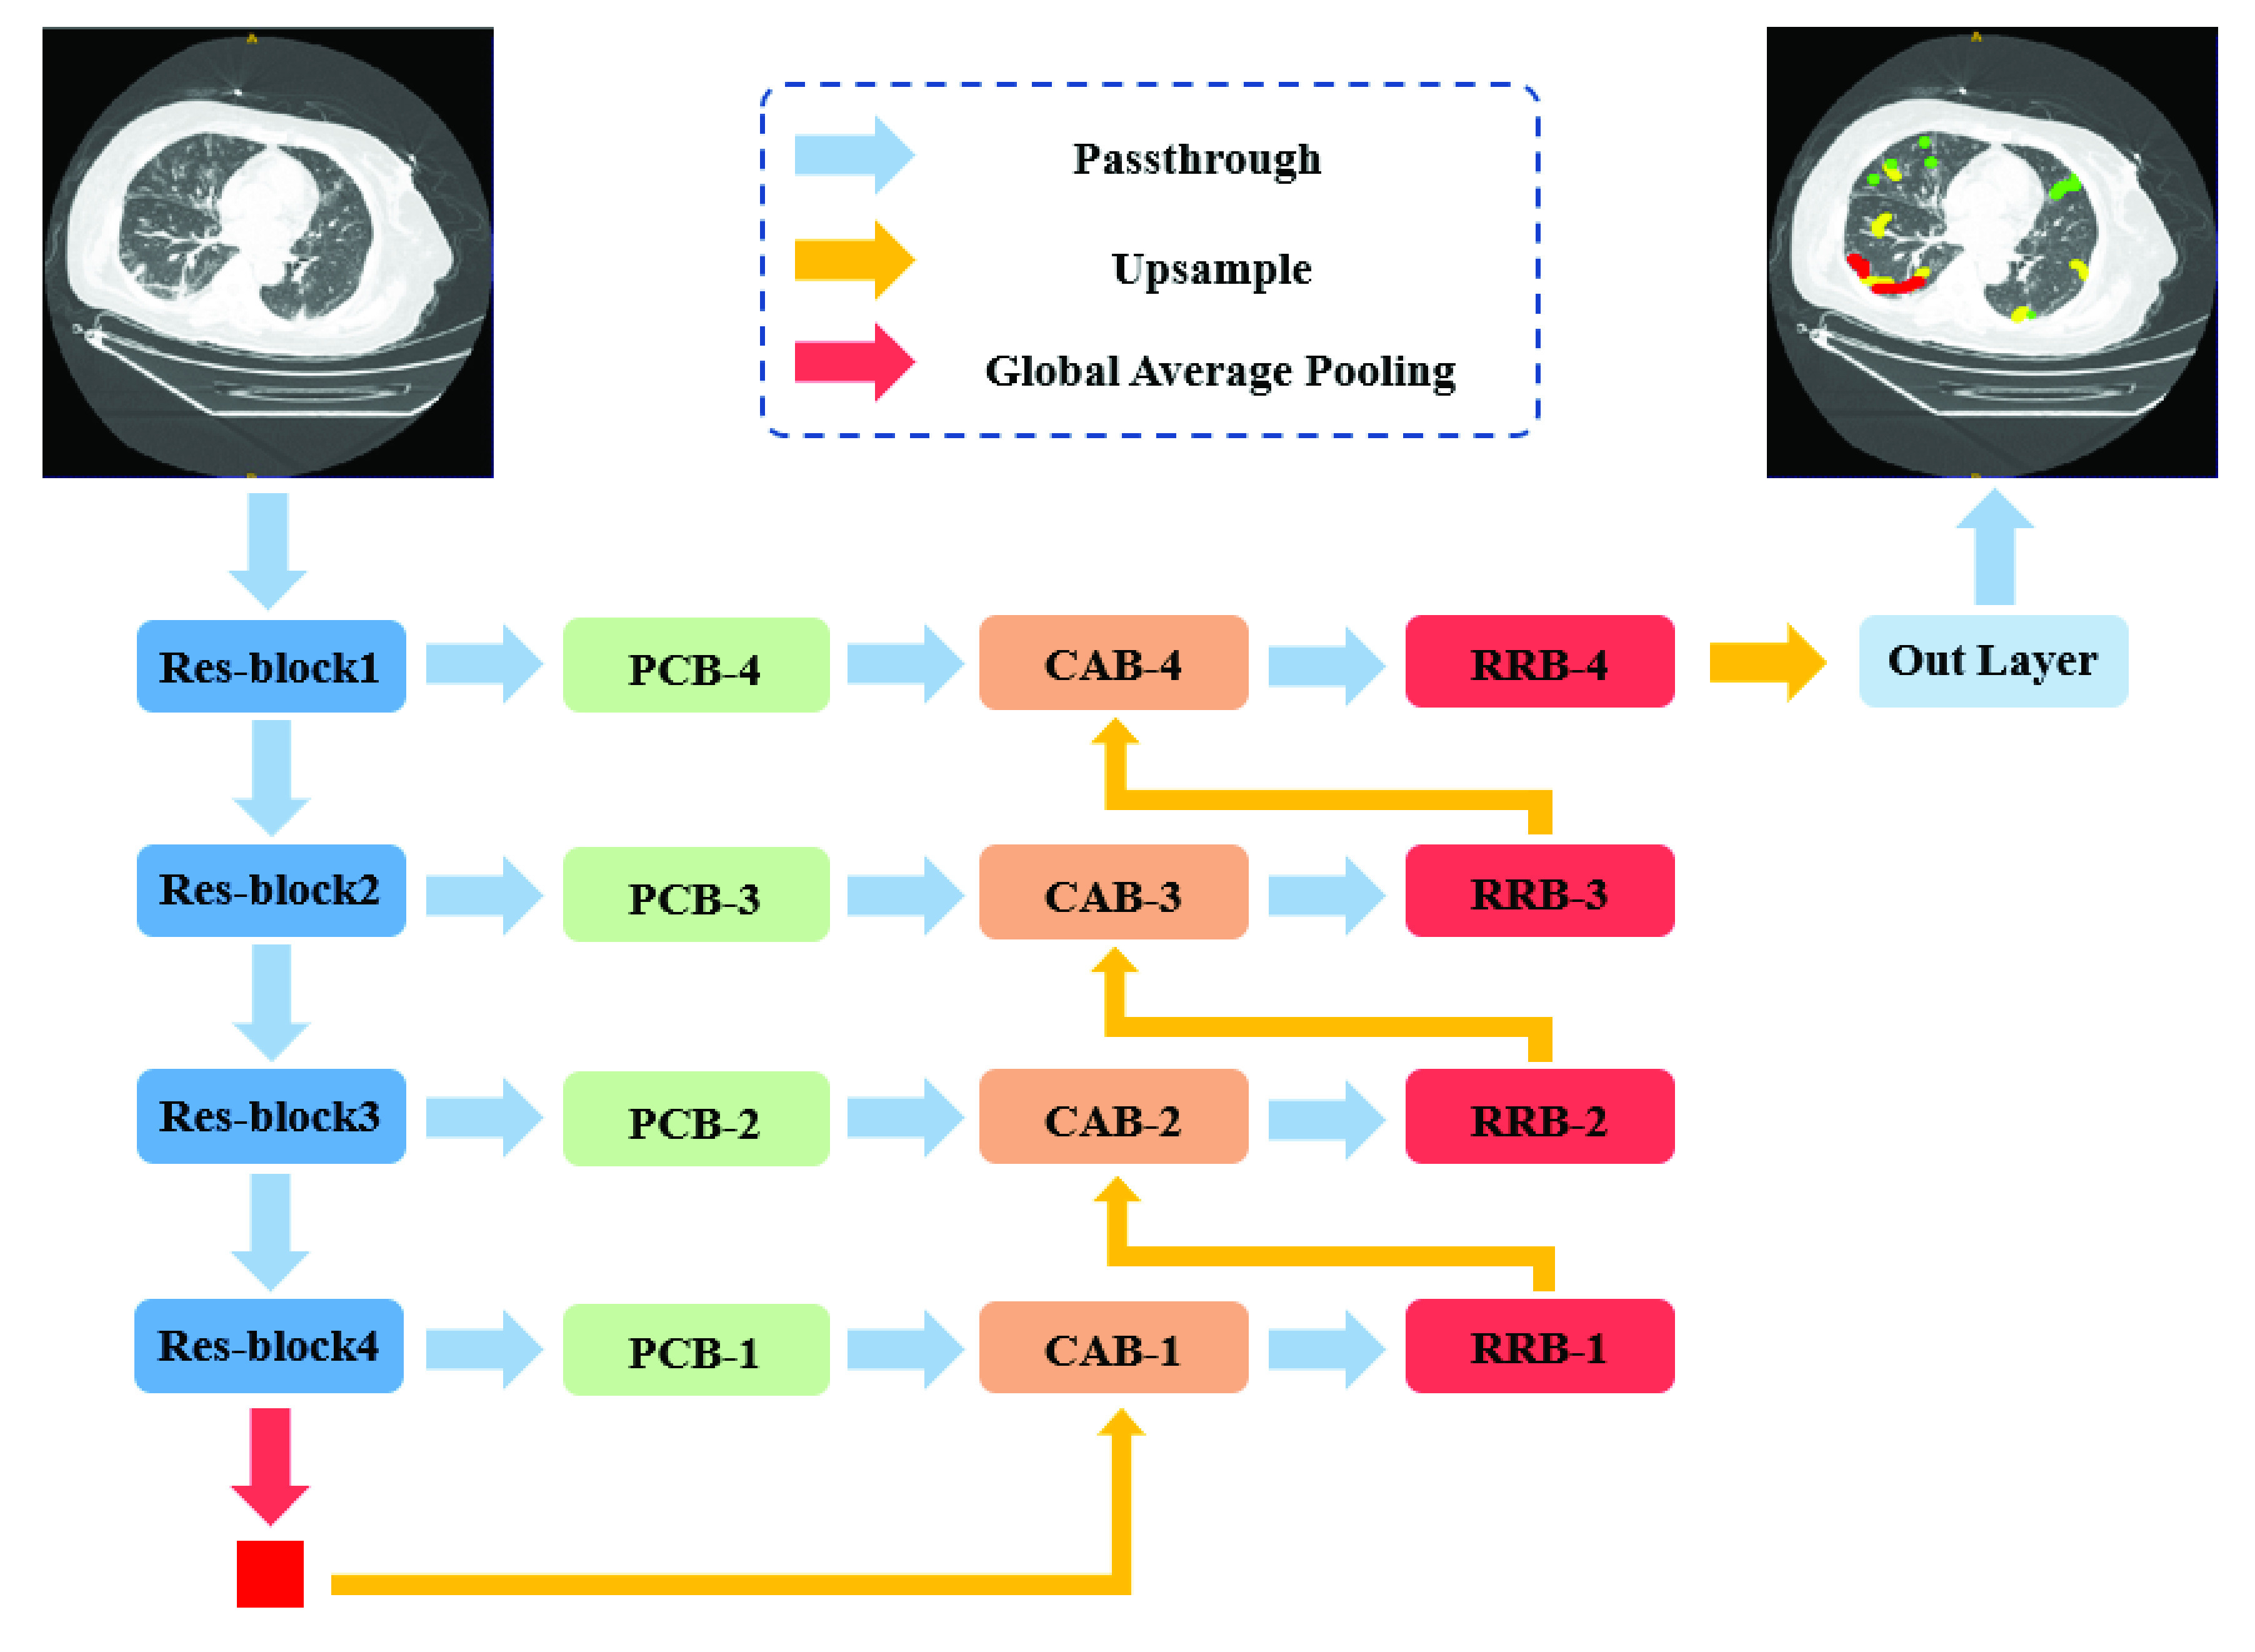
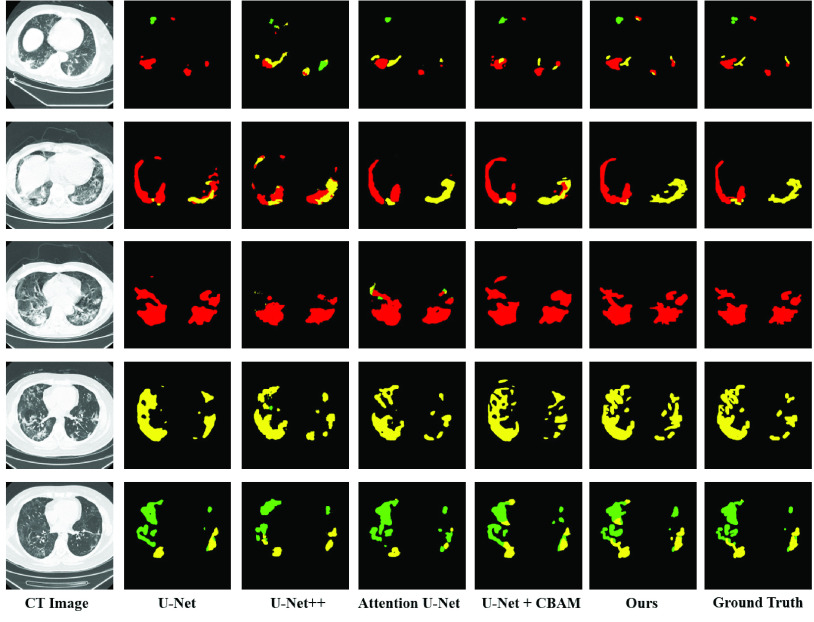
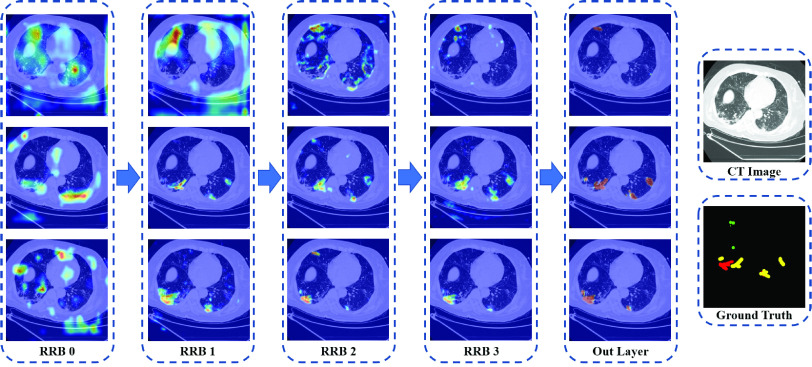
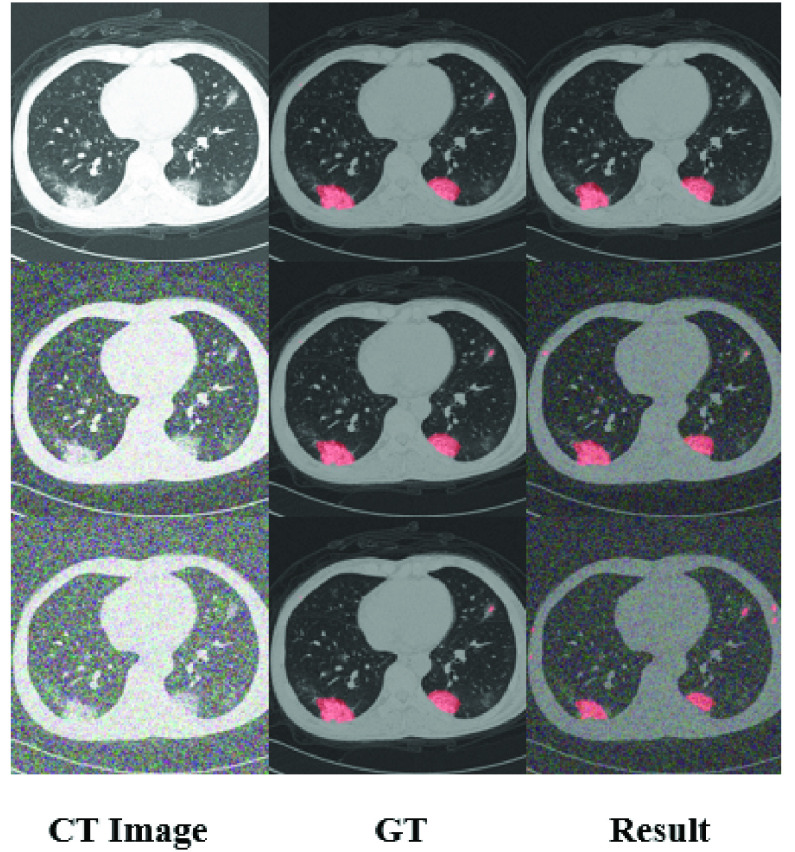
Since the first patient reported in December 2019, 2019 novel coronavirus disease (COVID-19) has become global pandemic with more than 10 million total confirmed cases and 500 thousand related deaths. Using deep learning methods to quickly identify COVID-19 and accurately segment the infected area can help control the outbreak and assist in treatment. Computed tomography (CT) as a fast and easy clinical method, it is suitable for assisting in diagnosis and treatment of COVID-19. According to clinical manifestations, COVID-19 lung infection areas can be divided into three categories: ground-glass opacities, interstitial infiltrates and consolidation. We proposed a multi-scale discriminative network (MSD-Net) for multi-class segmentation of COVID-19 lung infection on CT. In the MSD-Net, we proposed pyramid convolution block (PCB), channel attention block (CAB) and residual refinement block (RRB). The PCB can increase the receptive field by using different numbers and different sizes of kernels, which strengthened the ability to segment the infected areas of different sizes. The CAB was used to fusion the input of the two stages and focus features on the area to be segmented. The role of RRB was to refine the feature maps. Experimental results showed that the dice similarity coefficient (DSC) of the three infection categories were 0.7422,0.7384,0.8769 respectively. For sensitivity and specificity, the results of three infection categories were (0.8593, 0.9742), (0.8268,0.9869) and (0.8645,0.9889) respectively. The experimental results demonstrated that the network proposed in this paper can effectively segment the COVID-19 infection on CT images. It can be adopted for assisting in diagnosis and treatment of COVID-19.
Keywords: COVID-19; CT; MSD segmentation network; deep learning.
This work is licensed under a Creative Commons Attribution 4.0 License. For more information, see https://creativecommons.org/licenses/by/4.0/.
Figures


References
-
- World Health Organization. (2020). Who Director-General’s Opening Remarks at the Media Briefing on Covid-19-11 March 2020. [Online]. Available: https://www.who.int/dg/speeches/detail/who-director-generals-opening-rem...
LinkOut - more resources
Full Text Sources