

Explainable Machine Learning for Early Assessment of COVID-19 Risk Prediction in Emergency Departments
- PMID: 34812365
- PMCID: PMC8545262
- DOI: 10.1109/ACCESS.2020.3034032
Explainable Machine Learning for Early Assessment of COVID-19 Risk Prediction in Emergency Departments
Abstract
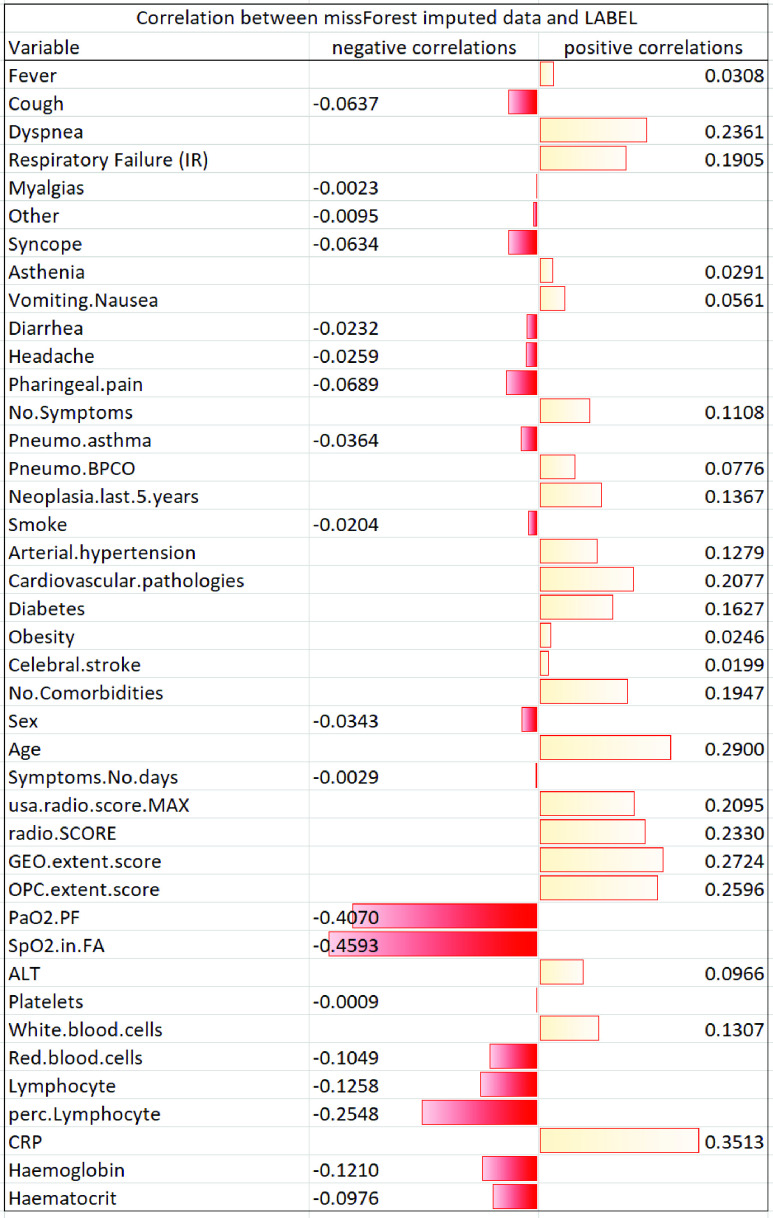
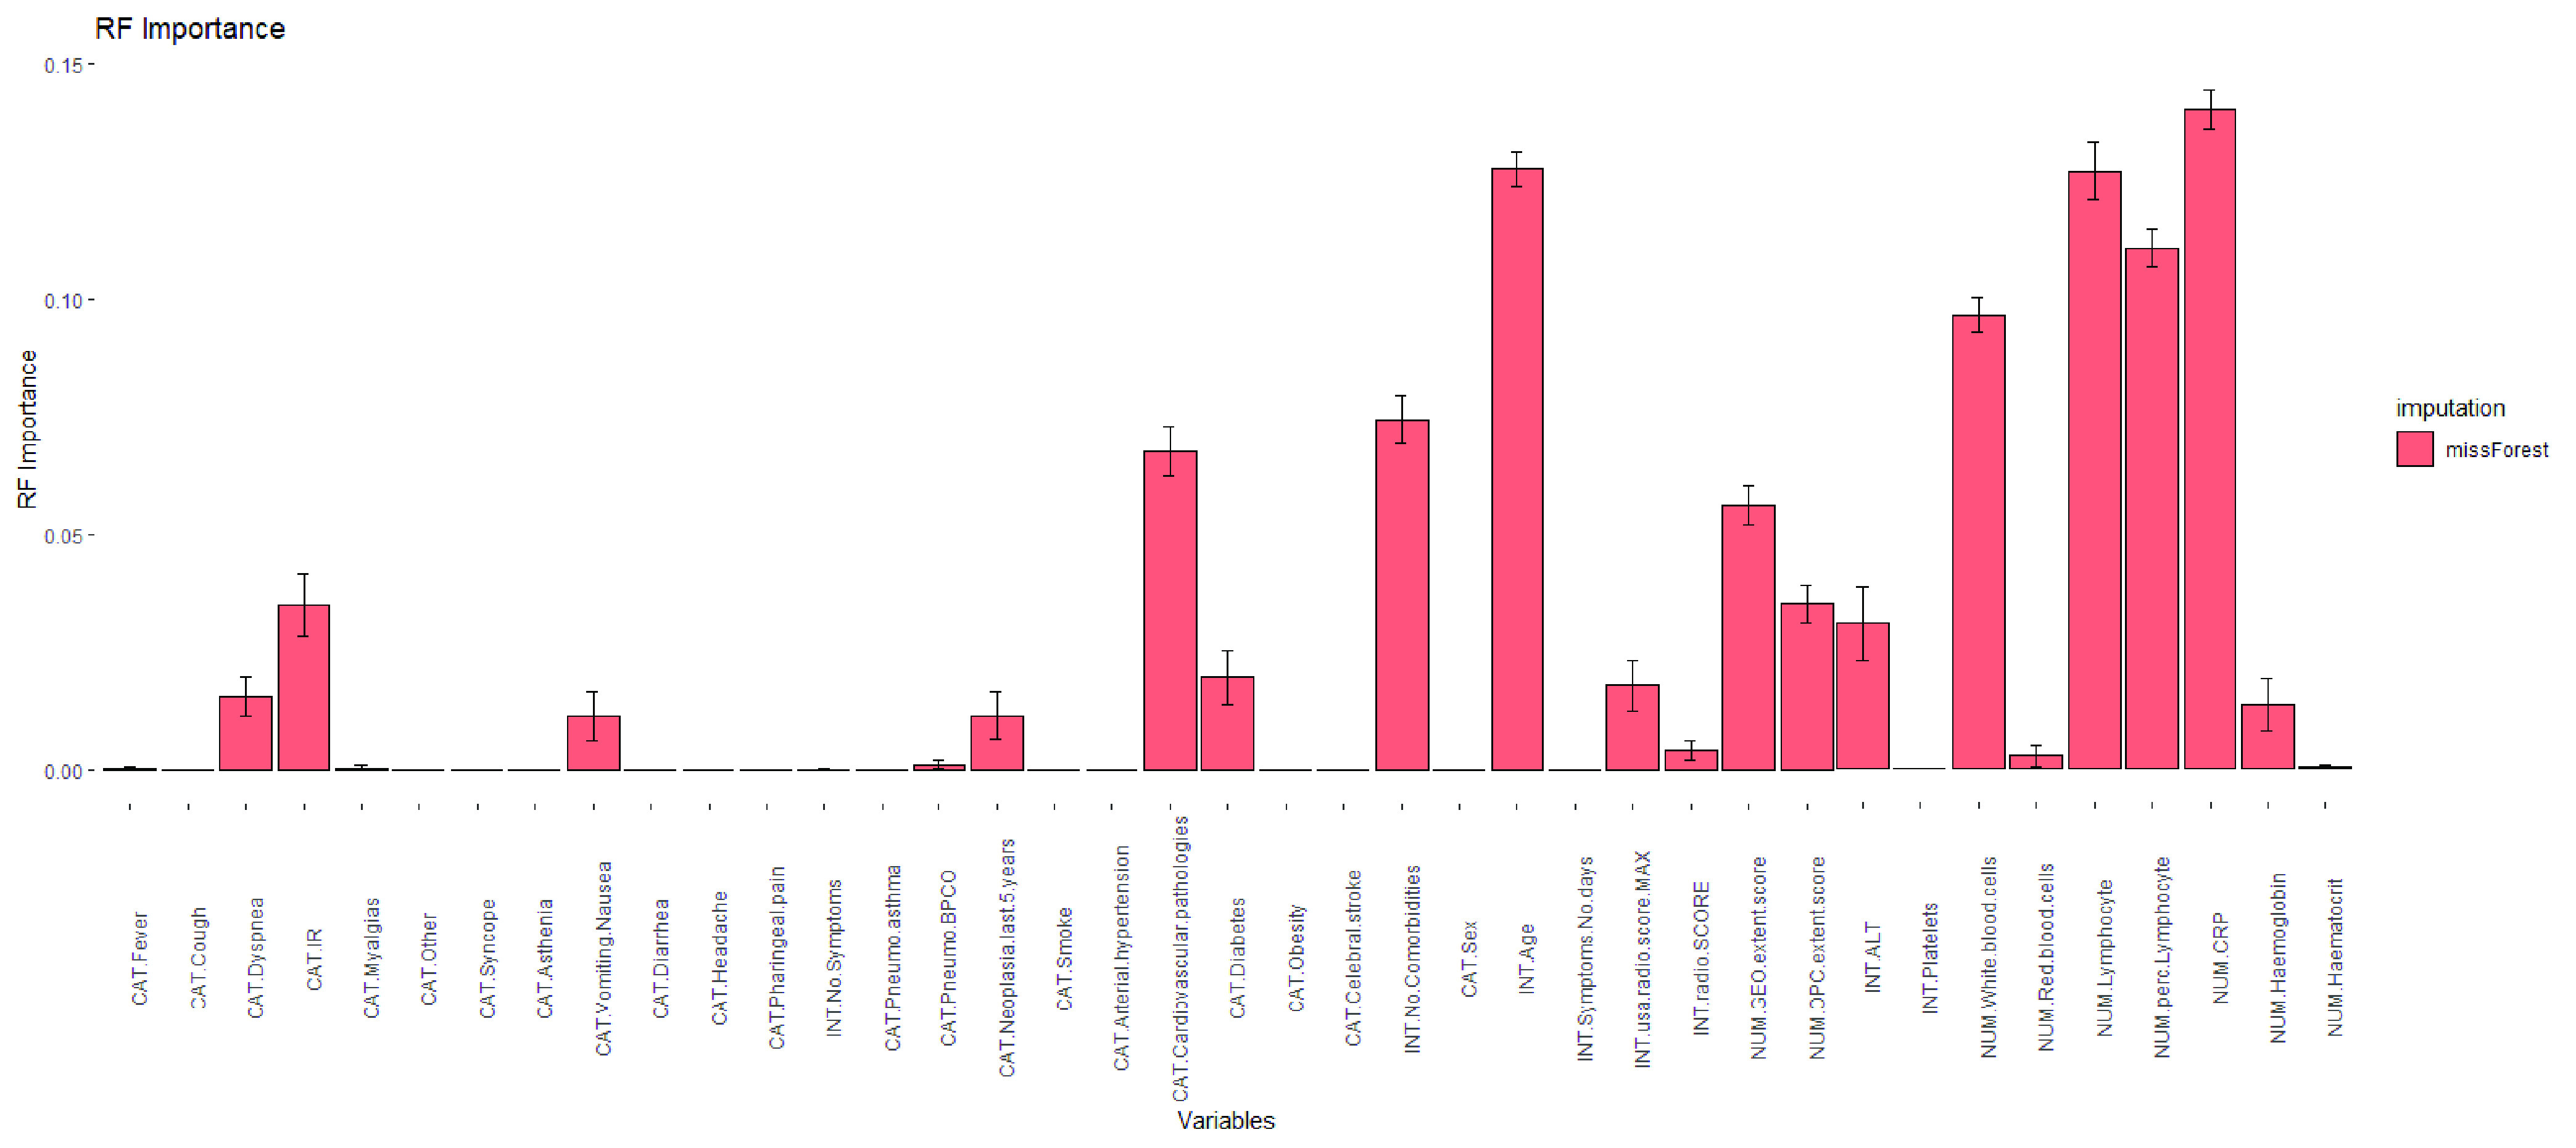
Between January and October of 2020, the severe acute respiratory syndrome coronavirus 2 (SARS-CoV-2) virus has infected more than 34 million persons in a worldwide pandemic leading to over one million deaths worldwide (data from the Johns Hopkins University). Since the virus begun to spread, emergency departments were busy with COVID-19 patients for whom a quick decision regarding in- or outpatient care was required. The virus can cause characteristic abnormalities in chest radiographs (CXR), but, due to the low sensitivity of CXR, additional variables and criteria are needed to accurately predict risk. Here, we describe a computerized system primarily aimed at extracting the most relevant radiological, clinical, and laboratory variables for improving patient risk prediction, and secondarily at presenting an explainable machine learning system, which may provide simple decision criteria to be used by clinicians as a support for assessing patient risk. To achieve robust and reliable variable selection, Boruta and Random Forest (RF) are combined in a 10-fold cross-validation scheme to produce a variable importance estimate not biased by the presence of surrogates. The most important variables are then selected to train a RF classifier, whose rules may be extracted, simplified, and pruned to finally build an associative tree, particularly appealing for its simplicity. Results show that the radiological score automatically computed through a neural network is highly correlated with the score computed by radiologists, and that laboratory variables, together with the number of comorbidities, aid risk prediction. The prediction performance of our approach was compared to that that of generalized linear models and shown to be effective and robust. The proposed machine learning-based computational system can be easily deployed and used in emergency departments for rapid and accurate risk prediction in COVID-19 patients.
Keywords: Associative tree; Boruta feature selection; COVID-19; clinical data analysis; generalized linear models; missing data imputation; random forest classifier; risk prediction.
This work is licensed under a Creative Commons Attribution 4.0 License. For more information, see https://creativecommons.org/licenses/by/4.0/.
Figures


References
-
- Gliozzo J., Perlasca P., Mesiti M., Casiraghi E., Vallacchi V., Vergani E., Frasca M., Grossi G., Petrini A., Re M., Paccanaro A., and Valentini G., “Network modeling of patients’ biomolecular profiles for clinical phenotype/outcome prediction,” Sci. Rep., vol. 10, no. 1, Dec. 2020, Art. no. 3612, doi: 10.1038/s41598-020-60235-8. - DOI - PMC - PubMed
-
- Barricelli B. R., Casiraghi E., Gliozzo J., Petrini A., and Valtolina S., “Human digital twin for fitness management,” IEEE Access, vol. 8, pp. 26637–26664, 2020.
-
- Fong S., Dey N., and Chaki J., Artificial Intelligence for Coronavirus Outbreak (Springer Briefs in Computational Intelligence). Singapore: Springer, 2020.
LinkOut - more resources
Full Text Sources
Miscellaneous