. 2020 Sep 29:1:275-281.
doi: 10.1109/OJEMB.2020.3026928. eCollection 2020.

COVID-19 Artificial Intelligence Diagnosis Using Only Cough Recordings

Affiliations

COVID-19 Artificial Intelligence Diagnosis Using Only Cough Recordings

Jordi Laguarta et al. IEEE Open J Eng Med Biol. .

Abstract

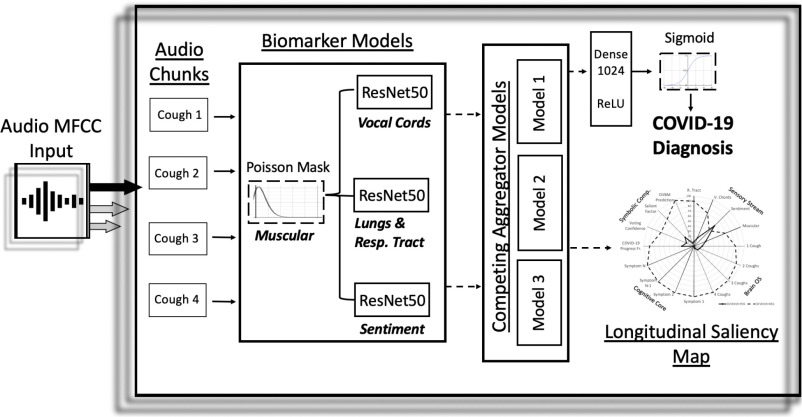
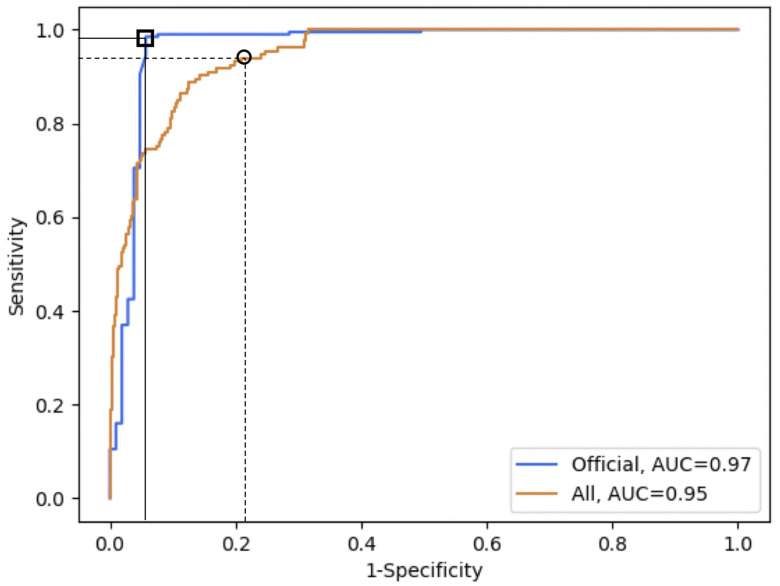
Goal: We hypothesized that COVID-19 subjects, especially including asymptomatics, could be accurately discriminated only from a forced-cough cell phone recording using Artificial Intelligence. To train our MIT Open Voice model we built a data collection pipeline of COVID-19 cough recordings through our website (opensigma.mit.edu) between April and May 2020 and created the largest audio COVID-19 cough balanced dataset reported to date with 5,320 subjects. Methods: We developed an AI speech processing framework that leverages acoustic biomarker feature extractors to pre-screen for COVID-19 from cough recordings, and provide a personalized patient saliency map to longitudinally monitor patients in real-time, non-invasively, and at essentially zero variable cost. Cough recordings are transformed with Mel Frequency Cepstral Coefficient and inputted into a Convolutional Neural Network (CNN) based architecture made up of one Poisson biomarker layer and 3 pre-trained ResNet50's in parallel, outputting a binary pre-screening diagnostic. Our CNN-based models have been trained on 4256 subjects and tested on the remaining 1064 subjects of our dataset. Transfer learning was used to learn biomarker features on larger datasets, previously successfully tested in our Lab on Alzheimer's, which significantly improves the COVID-19 discrimination accuracy of our architecture. Results: When validated with subjects diagnosed using an official test, the model achieves COVID-19 sensitivity of 98.5% with a specificity of 94.2% (AUC: 0.97). For asymptomatic subjects it achieves sensitivity of 100% with a specificity of 83.2%. Conclusions: AI techniques can produce a free, non-invasive, real-time, any-time, instantly distributable, large-scale COVID-19 asymptomatic screening tool to augment current approaches in containing the spread of COVID-19. Practical use cases could be for daily screening of students, workers, and public as schools, jobs, and transport reopen, or for pool testing to quickly alert of outbreaks in groups. General speech biomarkers may exist that cover several disease categories, as we demonstrated using the same ones for COVID-19 and Alzheimer's.

Keywords: AI diagnostics; COVID-19 screening; convolutional neural networks; deep learning; speech recognition.


Figures

Fig. 1.
Fig. 1.
Overview architecture of the COVID-19 discriminator with cough recordings as input, and COVID-19 diagnosis and longitudinal saliency map as output. A similar architecture was used for Alzheimer's .
Fig. 2.
Fig. 2.
The top orange line with a square shows the ROC curve for the set of subjects diagnosed with an official test with AUC (0.97), while the bottom blue curve with a circle shows the ROC curve for all subjects in the validation set. The square shows the chosen threshold with 98.5% sensitivity and 94.2% specificity on officially tested subjects, and the black circle shows the chosen threshold for high sensitivity (94.0%) on the whole validation set, although any point on the curve could be chosen depending on the use case.
Fig. 3.
Fig. 3.
A. The numbers on the x-axis describe the number of layers in the biomarker models fine-tuned to COVID-19. The fewer required to beat the baseline (which is the same architecture trained on COVID-19 discrimination without the pre-trained biomarker models) shows the relevance of each biomarker for COVID-19. “Complete: shows the final COVID-19 discriminator with all the biomarkers integrated. B. The white dotted part of the bar shows the performance gained when the Cough biomarker model is incorporated, while pre-trained denotes individually training the biomarker models for COVID-19 before integrating them into the multi-modal architecture on Fig. 1. C. shows the explainable saliency map derived from biomarker model predictions to longitudinally track patient progression and is analogous to the saliency map derived for Alzheimer's . OVBM denotes the final model diagnostic. The BrainOS section shows the model aggregated prediction for 1-4 coughs of a subject. The COVID-19 progress factor calculates based on the 1-4 cough predictions, a possible degree of severity from the quantity of acoustic information required for a confident diagnostic. The voting confidence and salient factor indicate, based on the composite predictions of individual biomarker models, the aggregate confidence and salient discrimination for each subject.
Fig. 4.
Fig. 4.
In cases where there are very few infected individuals, a group pre-screening tool can be derived from the COVID-19 OVBM model to accurately alert infected groups while avoiding false-positives as illustrated in the graph. With the current accuracy, shown in blue, a threshold of 3 positives in a group of 25 are required so that only 1% of groups of 25 with no cases are falsely labelled and therefore unnecessarily tested via expensive biological tests. In other words, in a campus with 2500 yet uninfected students, only 25 will have to be tested with biological methods until 3 people in a class of 25 catch the virus, in which case the screening will alert of the outbreak. The x-axis shows how the required number of positives in a group, 3 in this example, drops if the COVID-19 model accuracy improves. Each line shows percent of groups of 25 people falsely tagged with COVID-19 with a minimum number of COVID-19 positives in it. As a second example, assume a country like New Zealand, with very few COVID-19 cases, wanted to screen for new early outbreaks and to do so tested 50M inhabitants using a PCR or serology test with 99% specificity. The country would purchase 50M tests and obtain 500 000 false-positives. Meanwhile, assume a group test yielding a 99.9% test accuracy was used, i.e. requiring 5 positives instead of 3 in the example above. Of the, 2M groups of 25, only 2000 groups would be falsely tagged or 50 000 people. Hence, 0.1% of the cost and 0.1% of the false positives otherwise. The value of this group testing tool is that it enables organizations and countries to pre-screen its whole population daily, and rapidly locate incipiently infected groups, without the necessity of using an expensive PCR or serology test on each inhabitant.

Similar articles

Cited by

References

    1. Barro R. J., Ursua J. F., and Weng J., “The coronavirus and the great influenza pandemic: Lessons from the “spanish flu” for the coronavirus's potential effects on mortality and economic activity,” Nat. Bur. Econ. Res., Cambridge, MA, USA, Tech. Rep. w26866, 2020.
    1. “Why your coronavirus test could cost 23 – or 2,315,” Jun. 2020. [Online]. Available: https://www.advisory.com/dailybriefing/2020/06/17/covid-test-cost
    1. Tromberg B. J. et al. , “Rapid scaling up of covid-19 diagnostic testing in the United States—The NIH radx initiative,” New Engl. J. Med., vol. 383, no. 11, pp. 1071–1077, 2020. - PMC - PubMed
    1. La Marca A., Capuzzo M., Paglia T., Roli L., Trenti T., and Nelson S. M., “Testing for SARS-CoV-2 (COVID-19): A systematic review and clinical guide to molecular and serological in-vitro diagnostic assays,” Reprod. BioMed. Online, vol. 41, no. 4, pp. 483–499, Sep. 2020. - PMC - PubMed
    1. Salathe M. et al. , “Covid-19 epidemic in Switzerland: On the importance of testing, contact tracing and isolation,” Swiss Med. Weekly, vol. 150, no. 11-12, 2020, Paper w20225. - PubMed