. 2022 Jan;21(1):e12776.
doi: 10.1111/gbb.12776. Epub 2021 Nov 23.

Deficiency of the paternally inherited gene Magel2 alters the development of separation-induced vocalization and maternal behavior in mice

Affiliations

Deficiency of the paternally inherited gene Magel2 alters the development of separation-induced vocalization and maternal behavior in mice

Gabriela M Bosque Ortiz et al. Genes Brain Behav. 2022 Jan.

Abstract

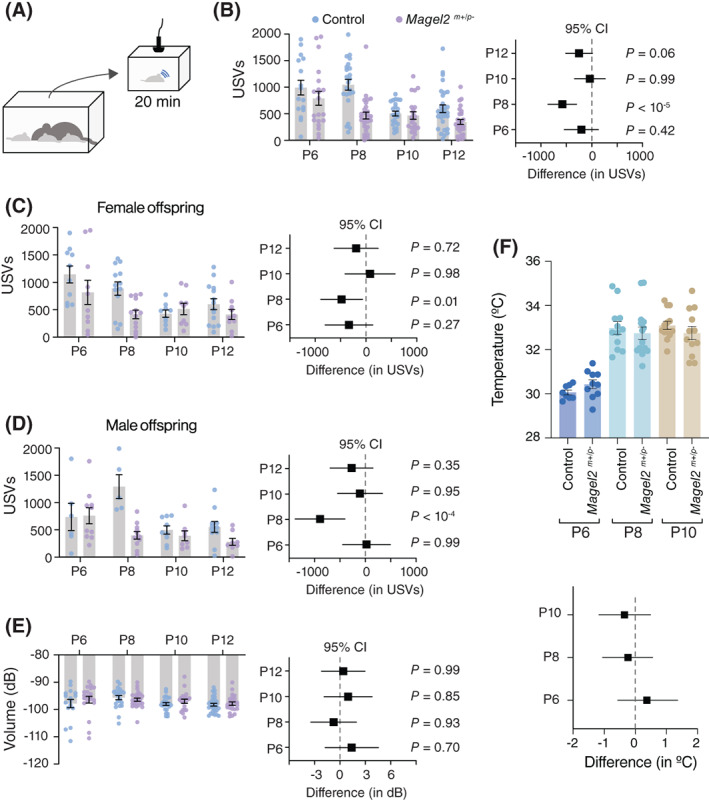
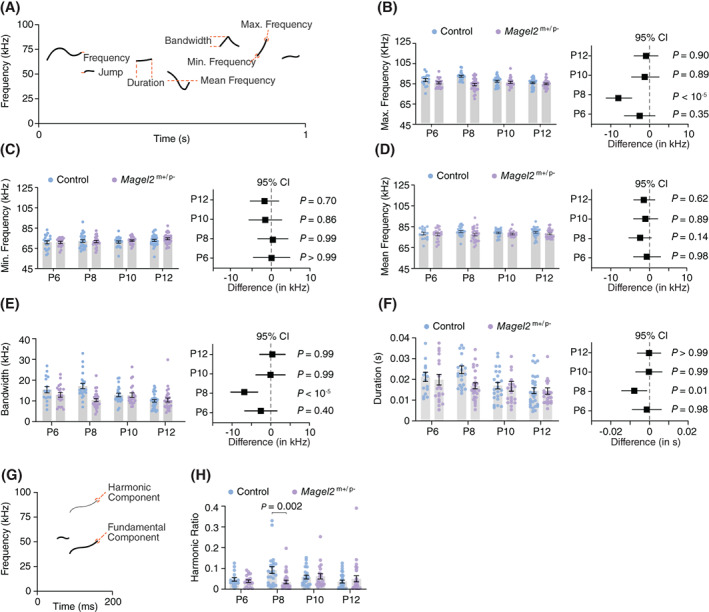
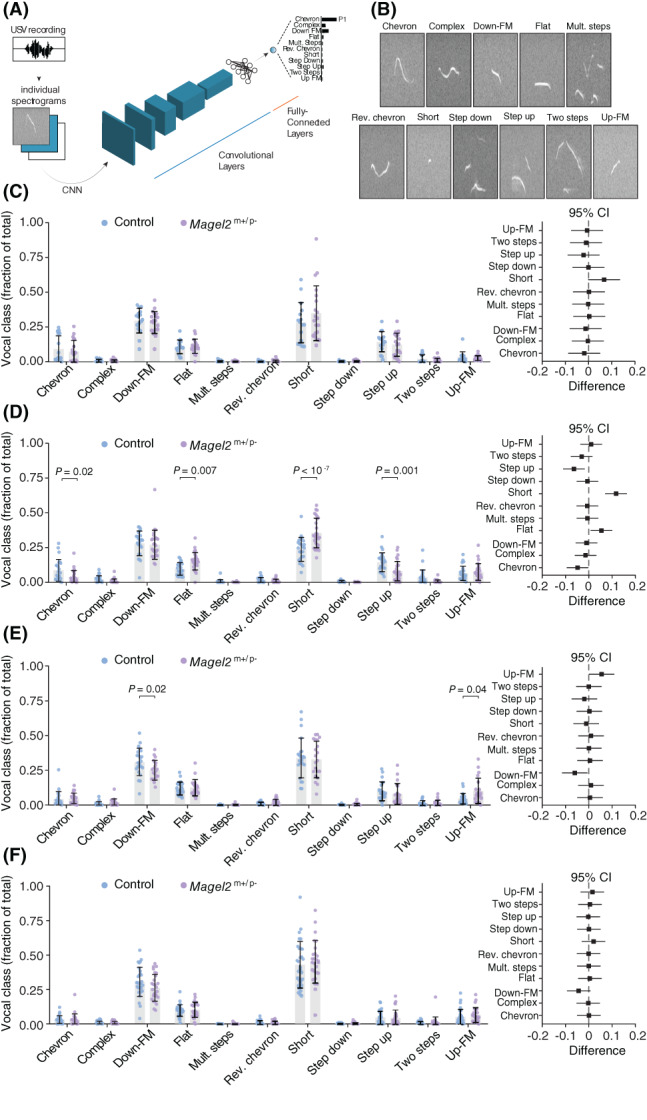
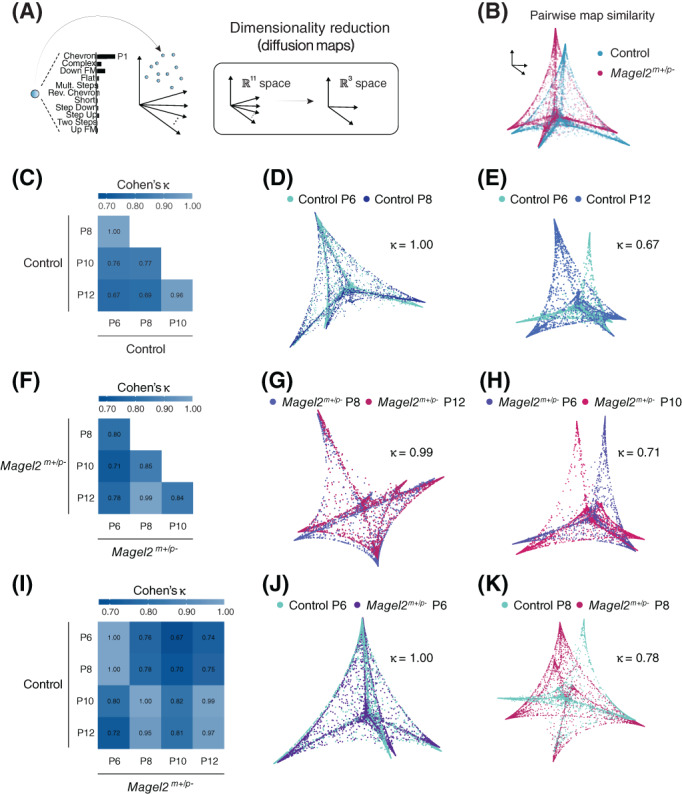
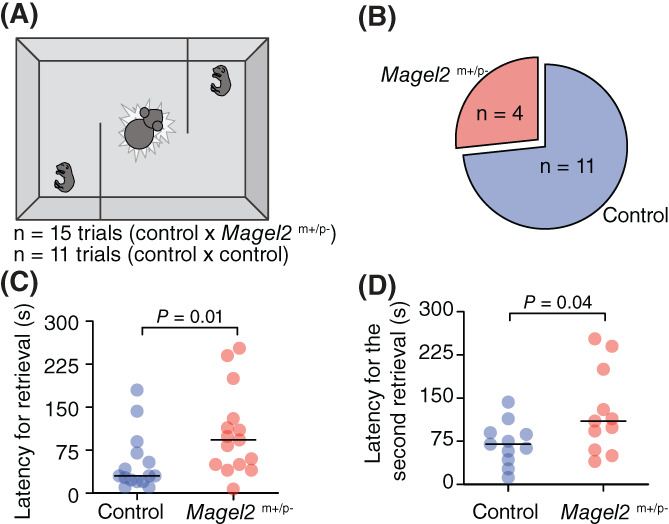
The behavior of offspring results from the combined expression of maternal and paternal genes. Genomic imprinting silences some genes in a parent-of-origin specific manner, a process that, among all animals, occurs only in mammals. How genomic imprinting affects the behavior of mammalian offspring, however, remains poorly understood. Here, we studied how the loss of the paternally inherited gene Magel2 in mouse pups affects the emission of separation-induced ultrasonic vocalizations (USV). Using quantitative analysis of more than 1000 USVs, we characterized the rate of vocalizations as well as their spectral features from postnatal days 6-12 (P6-P12), a critical phase of mouse development that covers the peak of vocal behavior in pups. Our analyses show that Magel2 deficient offspring emit separation-induced vocalizations at lower rates and with altered spectral features mainly at P8. We also show that dams display altered behavior towards their own Magel2 deficient offspring at this age. In a test to compare the retrieval of two pups, dams retrieve wildtype control pups first and faster than Magel2 deficient offspring. These results suggest that the loss of Magel2 impairs the expression of separation-induced vocalization in pups as well as maternal behavior at a specific age of postnatal development, both of which support the pups' growth and development.

Keywords: Prader Willi syndrome; autism spectrum disorders; behavior development; genomic imprinting; offspring-parent conflict.


Figures

FIGURE 1
FIGURE 1
Magel2 deficiency affects the emission of ultrasonic vocalizations in mice specifically at postnatal day eight (P8). (A) Schematic of the protocol used to record separation‐induced USVs in mice (from P6 to P12); pups are separated from the home nest in a new chamber equipped with an ultrasonic microphone and recorded for 20 min. (B) Total number of USVs emitted by control (blue) and Magel2 deficient (purple) littermates at P6, P8, P10, and P12; right panel denotes the 95% confidence intervals as a measure of effect size. (C) Similar to (B), but only considering female pups. (D) Similar to (B), but only considering male pups. (E) Average intensity of the USVs measured in decibels; right panel denotes the 95% confidence intervals as a measure of effect size. The sample sizes for control and Magel2 deficient pups are: P6, n = 16 and 20; P8, n = 23 and 28; P10, n = 23 and 20; and P12, n = 30 and 28, respectively. (F) Bar chart of body surface temperature at each age tested. Lower panel denotes the 95% confidence intervals as a measure of effect size. No statistical differences between groups were found (note that all confidence intervals cross zero). In (F), the sample sizes for control and Magel2 deficient pups are: P6, n = 8 and 10; P8, n = 12 and 15; and P10, n = 13 and 12; respectively. Bars represent mean value with error bars representing SEM and round symbols representing individual values. When plotting the effect sizes, squared symbols and black lines represent 95% confidence intervals calculated as the different between Magel2 deficient and control pups. p values are provided in the figures as calculated using Sidak's multiple comparison test
FIGURE 2
FIGURE 2
Magel2 deficient pups emit ultrasonic vocalizations of distinct spectro‐temporal features. (A) Illustration of a spectrogram with the spectro‐temporal features measured for each USV. (B) Maximum frequency of the USVs emitted by control and Magel2 deficient littermates at P6, P8, P10, and P12; right panel denotes the 95% confidence intervals as a measure of effect size. (C) Similar to (B) but plotting the minimum frequency of the USVs. (D) Similar to (B) but plotting the mean frequency of the USVs. (E) Similar to (B) but plotting the bandwidth of the USVs. (F) Similar to (B) but plotting the duration of the USVs. (G) Illustration of the spectrogram of a single USV with a harmonic component. (H) Ratio of harmonic across all USVs emitted by control and Magel2 deficient littermates. Bars represent mean value with error bars representing SEM and round symbols representing individual values. When plotting the effect sizes, squared symbols and black lines represent 95% confidence intervals calculated as the different between Magel2 deficient and control pups. In B‐F, p values are provided in the figures as calculated using Sidak's multiple comparison test post hoc analysis from two‐way ANOVA test. In H, P values are provided as calculated using Mann–Whitney test. The sample sizes for control and Magel2 deficient pups are: P6, n = 16 and 20; P8, n = 23 and 28; P10, n = 23 and 20; and P12, n = 30 and 28, respectively
FIGURE 3
FIGURE 3
Magel2 deficient pups emit ultrasonic vocalizations with discrete changes in the distribution of syllable types. (A) Illustration of the convolutional neural network used to classify each USV into one of 11 syllable types based on their morphology in spectrograms. (B) Spectrograms representing each of the 11 syllable types. (C) Distribution of syllable types in P6 pups—control in blue and Magel2 deficient in purple. Data are showed as fraction of the total number of USVs; right panel denotes the 95% confidence intervals as a measure of effect size. (D) Similar to (C), but for P8 pups. (E) Similar to (C), but for P10 pups. (F) Similar to (C), but for P12 pups. Bars represent mean value with error bars representing SEM and round symbols representing individual values. When plotting the effect sizes, squared symbols and black lines represent 95% confidence intervals calculated as the different between Magel2 deficient and control pups. p values are provided in the figures as calculated using Sidak's multiple comparison test as a post hoc analysis after two‐way ANOVA. The sample sizes for control and Magel2 deficient pups are: P6, n = 16 and 20; P8, n = 23 and 28; P10, n = 23 and 20; and P12, n = 30 and 28, respectively
FIGURE 4
FIGURE 4
Analysis of the vocal repertoire of pups across ages. (A) Illustration of the output of the convolutional neural network, with a distribution of 11 probabilities for vocal classification (one probability for each of the 11 syllable types, with the highest probability defining the syllable type). Using diffusion maps, a dimensionality reduction technique, these 11 dimensions are reduced to three dimensions in the Euclidian space. (B) Illustration of a pairwise comparison of the vocal repertoire of pups using diffusion maps and 3D alignment of the manifolds (see methods for more details). (D) Comparison of the pairwise distance matrix between control pups at different ages using Cohen's Kappa coefficient. (D–E) Examples of two pairwise comparisons with high and low alignment. (F–H) Similar to (D–E), but for Magel2 deficient pups. (I–K) Similar to (C–H), but comparing control and Magel2 deficient pups across ages. The sample sizes for control and Magel2 deficient pups are: P6, n = 16 and 20; P8, n = 23 and 28; P10, n = 23 and 20; and P12, n = 30 and 28, respectively
FIGURE 5
FIGURE 5
Maternal retrieval behavior is biased towards wildtype versus Magel2 deficient pups. (A) Diagram of maternal retrieval protocol with P8 pups on opposite ends of the apparatus and mother at nest in the middle compartment. (B) Pie chart showing the proportion of pups of each genotype that were retrieved first by the dam in the test (n = 15 trials testing control versus Magel2 deficient pup). (C) Latency for the dam to retrieve control and Magel2 deficient pups. (D) Latency for the dam to retrieve the second pup in the test (the total number of control pups is n = 11, which represents the seven pups retrieved second in the control versus control trials plus the four pups retrieved second in the control versus Magel2 deficient pup trials). Significant p values are shown in the graphs

References

    1. Barlow DP, Bartolomei MS. Genomic imprinting in mammals. Cold Spring Harb Perspect Biol. 2014;6(2):1‐17. - PMC - PubMed
    1. Perez JD, Rubinstein ND, Dulac C. New perspectives on genomic imprinting, an essential and multifaceted mode of epigenetic control in the developing and adult brain. Annu Rev Neurosci. 2016;39:347‐384. - PMC - PubMed
    1. Ferguson‐Smith AC. Genomic imprinting: the emergence of an epigenetic paradigm. Nat Rev Genet. 2011;12(8):565‐575. - PubMed
    1. Morison IM, Ramsay JP, Spencer HG. A census of mammalian imprinting. Trends Genet. 2005;21(8):457‐465. - PubMed
    1. Haig D. Coadaptation and conflict, misconception and muddle, in the evolution of genomic imprinting. Heredity (Edinb). 2014;113(2):96‐103. - PMC - PubMed

Publication types