. 2022 Apr;20(4):722-735.
doi: 10.1111/pbi.13751. Epub 2021 Dec 5.

The GhMYB36 transcription factor confers resistance to biotic and abiotic stress by enhancing PR1 gene expression in plants

Affiliations

The GhMYB36 transcription factor confers resistance to biotic and abiotic stress by enhancing PR1 gene expression in plants

Tingli Liu et al. Plant Biotechnol J. 2022 Apr.

Abstract

Drought and Verticillium wilt disease are two main factors that limit cotton production, which necessitates the identification of key molecular switch to simultaneously improve cotton resistance to Verticillium dahliae and tolerance to drought stress. R2R3-type MYB proteins could play such a role because of their conserved functions in plant development, growth, and metabolism regulation, however, till date a MYB gene conferring the desired resistance to both biotic and abiotic stresses has not been found in cotton. Here, we describe the identification of GhMYB36, a gene encoding a R2R3-type MYB protein in Gossypium hirsutum, which confers drought tolerance and Verticilium wilt resistance in both Arabidopsis and cotton. GhMYB36 was highly induced by PEG-simulated drought stress in G. hirsutum. GhMYB36-silenced cotton plants were more sensitive to both drought stress and Verticillium wilt. GhMYB36 overexpression in transgenic Arabidopsis and cotton plants gave rise to improved drought tolerance and Verticillium wilt resistance. Transient expression of fused GhMYB36-GFP in tobacco cells was able to localize GhMYB36 in the cell nucleus. In addition, RNA-seq analysis together with qRT-PCR validation in transgenic Arabidopsis overexpressing GhMYB36 revealed significantly enhanced PR1 expression. Luciferase interaction assays indicated that GhMYB36 are probably bound to the promoter of PR1 to activate its expression and the interaction, which was further verified by Yeast one hybrid assay. Taken together, our results suggest that GhMYB36 functions as a transcription factor that is involved in drought tolerance and Verticillium wilt resistance in Arabidopsis and cotton by enhancing PR1 expression.

Keywords: R2R3-type MYB proteins; drought tolerance; transcription factors; transgenic plants; transient expression.


Conflict of interest statement

No conflicts of interest declared.

Figures
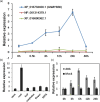
Figure 1
Figure 1
Expression patterns of GhMYB36. (a) Relative expression levels of GhMYB36 and its branch genes after its treatment with 18% PEG. (b) Relative expression levels of GhMYB36 gene in different tissues of cotton. Roots, stems, and true leaves of three‐week‐old cotton seedlings, 96 h cotyledons, flowers, and 5 days post anthesis fibers (5DPA) were harvested for qRT‐PCR analysis. (c) Relative expression levels of GhMYB36 gene treated with ABA. Three‐week‐old cotton seedlings were subjected to 100 μm ABA. Roots were harvested at the indicated time‐points for qRT‐PCR analysis. The cotton ubiquitin14 (UBQ14) gene was used as reference. Values were means ± SE of biological replicates (n = 3).
Figure 2
Figure 2
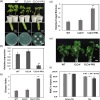
Downregulation of GhMYB36 decreases cotton drought tolerance in cotton. (a) Phenotypes of the cotton seedling treated with 18% PEG. WT, denotes the wild‐type cotton cultivar Ao 3503; EM, indicates the EM (CLCrVA)‐treated cotton; VIGS, CLCrVA‐GhMYB36‐treated cotton plants. Photos were taken at 48 h after the stress conditions achieved by the use of 18% PEG. (b) Leaf RWC of WT, EM, and VIGS cotton plants. Values are represented as means ± SE for six plants. Asterisks denote significantly lower values of GhMYB36‐silenced cotton plants compared with WT plants (Student's t‐test, **P < 0.01). Experiments were carried out three times. (c) Ion leakage rate in the leaves post 18% PEG treatment for 48 h. The values are expressed as the mean ± SE for the six plants. Asterisks denote significantly higher values of VIGS plants compared with WT plants (Student's t‐test, **P < 0.01). Experiments were carried out three times. (d) MDA content in cotton leaves post 18% PEG treatment for 48 h. The values are expressed as the means ± SE (n = 3) (Student's t‐test, **P < 0.01). (e) T‐AOC activities in cotton leaves post 18% PEG treated for 48 h. Values are expressed as the means ± SE (n = 3) (Student's t‐test, **P < 0.01).
Figure 3
Figure 3
Overexpressing GhMYB36 confers drought tolerance in Arabidopsis. (a) Comparison of phenotypes between transgenic lines (OE1, OE2, and OE7) and WT plants under mannitol treatment for 7 days. Bar = 1 cm. (b) Germination rate of transgenic seeds and Col‐0 seed under mannitol treatment for 7 days. Asterisks denote significantly higher values of transgenic plants OE1, OE2, and OE7 compared with WT plants (Student's t‐test, **P < 0.01). Experiments were carried out three times. (c) Performance of GhMYB36 transgenic Arabidopsis plants under drought stress. Seedlings were grown without water for 30 days. Bar = 2 cm. (d) Survival rate of Arabidopsis plants under drought stress. Each experiment comprised 20 plants. (Student's t‐test, **P < 0.01). (e) T‐AOC activities in transgenic Arabidopsis leaves post drought treated for 15 days. Values are expressed as the means ± SE (n = 3) (Student's t‐test, **P < 0.01).
Figure 4
Figure 4
Overexpressing GhMYB36 confers drought tolerance in cotton. (a) Performance of GhMYB36 transgenic cotton plants under drought stress. Seedlings were normally grown for 2 weeks and then without water for 15 days and rewatering for 2 days. Bar = 3 cm. (b) Survival rate of cotton plants under drought stress. Each experiment comprised 20 plants. (Student's t‐test, **P < 0.01). (c) Leaf RWC of WT and transgenic cotton plants under drought stress treated in (b). Values are represented as means ± SE for six plants. Asterisks denote significantly lower values of GhMYB36‐silenced cotton plants compared with WT plants (Student's t‐test, **P < 0.01). Experiments were carried out three times. (d) Water loss rate in the leaves of cotton. The FW of detached leaves of 3 weeks seedling was measured at the time intervals indicated. Water loss was calculated from the decrease in FW compared with time zero. The values were means of 12 biological replicates. Values with the same letter were not significantly different according to Duncan’s multiple range tests (P < 0.05). (e) Seedlings were normally grown for 2 weeks and then without water for 10 days to detect the T‐AOC activities in cotton leaves. Values are expressed as the means ± SE (n = 5) (Student's t‐test, **P < 0.01).
Figure 5
Figure 5
Transgenic overexpression of GhMYB36 confers V. dahliae resistance in Arabidopsis and cotton Arabidopsis and cotton engineered to express CaMV 35S‐driven GhMYB36. (a) Typical appearance of nontransgenic control (WT) and transgenic lines upon inoculation with V991 strain of V. dahliae at 21 days after inoculation. Bar = 3 cm. (b) Quantification of Verticillium wilt symptoms in Arabidopsis Col‐0 engineered to express CaMV 35S‐driven GhMYB36 at 21 d after inoculation. Bars represent quantification of symptom development as percentage of diseased rosette leaves with SD. Col‐0 (control) is set to 100%. (c) Fungal biomass determined by quantitative real‐time PCR (R.Q.) in Arabidopsis Col‐0 engineered to express CaMV 35S‐driven GhMYB36. Bars represent Verticillium ITS transcript levels relative to Arabidopsis Rubisco transcript levels (for equilibration) with SD in a sample of four pooled plants. Col‐0 (control) is set to 100%. Asterisks indicate significant differences when compared with Col‐0 (P < 0.05). (d) Typical appearance of nontransgenic control (WT) and transgenic lines upon inoculation with V991 strain of V. dahliae at 15 days after inoculation (Bar = 4 cm). Bottom panels were stem inspection (Bar = 0.3 cm) and the fungal recovery assay (Bar = 2 cm). (e) The disease indices of T4 transgenic cottons with infection by V. dahliae isolate V991. Results were presented as means ± SE from three replications with at least 10 plants per replication. (f) Fungal biomass determined by quantitative real‐time PCR (R.Q.) in cotton. Bars represent Verticillium ITS transcript levels relative to cotton UBQ14 transcript levels (for equilibration) with SD in a sample of four pooled plants. WT (control) is set to 1. Asterisks indicate significant differences when compared with Col‐0 (P < 0.05).
Figure 6
Figure 6
The GhMYB36 gene endowed Verticillium wilt resistance in cotton. (a) The phenotypes of Ao3503 under infection by V. dahliae isolate V991 after VIGS with CLCrV containing a fragment of GhMYB36 gene. Photos were taken at 30 days after V. dahliae inoculation (45 days after VIGS) upper panel, disease symptoms of cotton plants, Bar = 4 cm; middle panel, stem inspection vascular discoloration, Bar = 0.3 cm; bottom panel, recovery assay, Bar = 2 cm. (b) The disease indices GhMYB36 gene‐silence lines. The results were presented as means ± SE from three replications with at least 25 plants per replication. (c) Fungal biomass determined by quantitative real‐time PCR (R.Q.) in cotton. Bars represent V. dahliae ITS transcript levels relative to cotton UBQ14 transcript levels (for equilibration) with SD in a sample of four pooled plants. WT (control) is set to 1. Asterisks indicate significant differences when compared with Col‐0 (P < 0.05).
Figure 7
Figure 7
GhMYB36 is a transcriptional activator localized in the nucleus. (a) Using agro‐infiltration, the green fluorescent proteins GhMYB36‐GFP and GFP were transiently expressed in Nicotiana benthamiana leaves. Two days later, confocal microscopy was used to observe the protein distribution. The nuclei of the plant cells were stained by DAPI and imaged for comparison with the GFP fluorescence. Fluorescence was detected on the cytoplasm and nuclei of the epidermal cells transformed by GFP, whereas GFP fluorescence of GhMYB36 existed only on the plant cell nucleus. Photographs of typical characteristics were taken 48 h after infiltration. Bar = 18 µm. (b) Diagram to illustrate the yeast‐one hybrid assay. (c) Yeast one‐hybrid analysis of the interaction of GhMYB36 and the GhPR1 promoter. Bar = 2 mm. (d) Diagram to illustrate the LUC assay. (e) Transcription activity of GhMYB36 was tested in tobacco leaves using a LUC‐based system. Bar = 0.5 cm. (f) The quantitative analysis of fluorescence intensity in (e). Two‐tailed t test was used to test the significance. Two asterisks represent P < 0.001. GhPR1P, Promoter of GhPR1; 35SP, CaMV 35S promoter; EV, pCambia2301 empty vector; Luc, Luciferases gene. pGADT7‐EV, pGADT7 empty vector; ADH1P, ADH1 promoter; HIS3, Histone 3 gene.
Figure 8
Figure 8
GhPR1 is required for V. dahliae resistance and drought tolerance in cotton. (a) The phenotypes of Ao3503 under infection by V. dahliae isolates V991 after VIGS with CLCrV containing a fragment of GhPR1 gene. Photos were taken at 30 days after V. dahliae inoculation (45 days after VIGS). upper panel, disease symptoms of cotton plants, Bar = 4 cm; middle panel, stem inspection vascular discoloration, Bar = 0.3 cm; bottom panel, recovery assay, Bar = 2 cm. (b) Relative expression levels of GhPR1 after 20 days of agroinfiltration in the GhMYB36‐silenced (CLCrV‐GhMYB36), Gossypium hirsutum cv. Ao 3503 wild‐type (WT) and empty vector control plants (CLCrV). Values are the means ± SE (n = 5) (Student's t‐test, **P < 0.01). (c) The disease indices GhPR1 gene‐silence lines. The results were presented as means ± SE from three replications with at least 25 plants per replication. (d). Fungal biomass determined by quantitative real‐time PCR in cotton. Bars represent Verticillium ITS transcript levels relative to cotton UBQ14 transcript levels (for equilibration) with SD in a sample of four pooled plants. WT (control) is set to 1. Asterisks indicate significant differences when compared with Col‐0 (P < 0.05). (e) Phenotypes of the cotton seedling treated with 18% PEG. WT, denotes the wild‐type cotton cultivar Ao 3503; CLCrV, empty vector‐treated cotton; CLCrV‐PR1, CLCrV‐PR1‐treated cotton plants. Photos were taken at 48 h after the stress conditions achieved by the use of 18% PEG. Bar = 3 cm. (f) Leaf RWC of WT, EM, and VIGS cotton plants. EM, empty vector treated cotton; VIGS, CLCrV‐PR1‐treated cotton plants. Values are represented as means ± SE for six plants. Asterisks denote significantly lower values of GhPR1‐silenced cotton plants compared with WT plants (Student's t‐test, **P < 0.01). Experiments were carried out three times.
Figure 9
Figure 9
A model for GhMYB36 in cotton responses to biotic stress and abiotic stress. Arrows indicate positive regulation. Solid and dashed arrows indicate direct action and predicted indirect action respectively.

References

    1. Akbudak, M.A. , Yildiz, S. and Filiz, E. (2020) Pathogenesis related protein‐1 (PR‐1) genes in tomato (Solanum lycopersicum L.): Bioinformatics analyses and expression profiles in response to drought stress. Genomics, 112, 4089–4099. - PubMed
    1. Butt, H.I. , Yang, Z. , Chen, E. , Zhao, G. , Gong, Q. , Yang, Z. , Zhang, X. et al. (2017) Functional characterization of cotton GaMYB62L, a novel R2R3 TF in transgenic Arabidopsis . PLoS One, 12, e0170578. - PMC - PubMed
    1. Chen, T. , Li, W. , Hu, X. , Guo, J. , Liu, A. and Zhang, B. (2015) A cotton MYB transcription factor, GbMYB5, is positively involved in plant adaptive response to drought stress. Plant Cell Physiol., 56, 917–929. - PubMed
    1. Cheng, H.Q. , Han, L.B. , Yang, C.L. , Wu, X.M. , Zhong, N.Q. , Wu, J.H. , Wang, F.X. et al. (2016) The cotton MYB108 forms a positive feedback regulation loop with CML11 and participates in the defense response against Verticillium dahliae infection. J. Exp. Bot., 67, 1935–1950. - PMC - PubMed
    1. Chu, X. , Wang, C. , Chen, X. , Lu, W. , Li, H. , Wang, X. , Hao, L. et al. (2015) The cotton WRKY gene GhWRKY41 positively regulates salt and drought stress tolerance in transgenic Nicotiana benthamiana . PLoS One, 10, e0143022. - PMC - PubMed

Publication types

MeSH terms

LinkOut - more resources