. 2021 Nov 23:10:e70970.
doi: 10.7554/eLife.70970.

Ten months of temporal variation in the clinical journey of hospitalised patients with COVID-19: An observational cohort

Collaborators, Affiliations

Ten months of temporal variation in the clinical journey of hospitalised patients with COVID-19: An observational cohort

ISARIC Clinical Characterisation Group et al. Elife. .

Abstract

Background: There is potentially considerable variation in the nature and duration of the care provided to hospitalised patients during an infectious disease epidemic or pandemic. Improvements in care and clinician confidence may shorten the time spent as an inpatient, or the need for admission to an intensive care unit (ICU) or high dependency unit (HDU). On the other hand, limited resources at times of high demand may lead to rationing. Nevertheless, these variables may be used as static proxies for disease severity, as outcome measures for trials, and to inform planning and logistics.

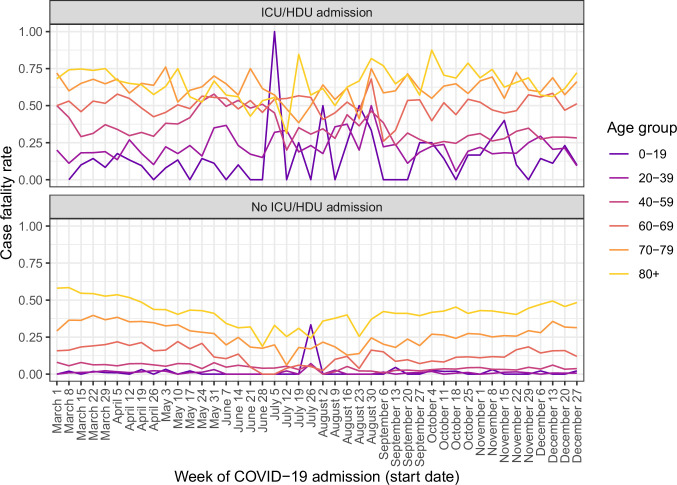
Methods: We investigate these time trends in an extremely large international cohort of 142,540 patients hospitalised with COVID-19. Investigated are: time from symptom onset to hospital admission, probability of ICU/HDU admission, time from hospital admission to ICU/HDU admission, hospital case fatality ratio (hCFR) and total length of hospital stay.

Results: Time from onset to admission showed a rapid decline during the first months of the pandemic followed by peaks during August/September and December 2020. ICU/HDU admission was more frequent from June to August. The hCFR was lowest from June to August. Raw numbers for overall hospital stay showed little variation, but there is clear decline in time to discharge for ICU/HDU survivors.

Conclusions: Our results establish that variables of these kinds have limitations when used as outcome measures in a rapidly evolving situation.

Funding: This work was supported by the UK Foreign, Commonwealth and Development Office and Wellcome [215091/Z/18/Z] and the Bill & Melinda Gates Foundation [OPP1209135]. The funders had no role in study design, data collection and analysis, decision to publish, or preparation of the manuscript.

Keywords: COVID-19; ICU; SARS-CoV-2; epidemiology; global health; hospitalisation; human; medicine; viruses.


Conflict of interest statement

MH, JB, GC, BC, AD, ED, CD, JD, ME, CK, LM, MP, JW, PH, AR, PO No competing interests declared

Figures

Figure 1.
Figure 1.. Time from reported symptom onset to hospital admission, by week of reported symptom onset.
(A) Blue cells represent binned patients, with darker colours corresponding to more individuals. The black line represents the mean. (B)-(D) Mean time to admission plotted by patient characteristics: (B) age group, (C) final outcome, (D) number of the four most common symptoms (cough, fatigue, fever, and shortness of breath) present upon admission.
Figure 2.
Figure 2.. Patients entering ICU/HDU within 13 days of COVID-19 admission (A) and time from COVID-19 admission to ICU/HDU admission (B) over time.
Each line is the proportion (A) or mean value (B) amongst all patients (black, dotted) or patients in each age group (coloured).
Figure 3.
Figure 3.. Temporal trends in outcome and time to outcome.
(A) Case fatality ratio in patients experiencing death or discharge within 45 days of COVID-19 admission, by recorded ICU/HDU admission. (B) Mean time from COVID-19 admission to the outcome of death or discharge, further faceted by ICU/HDU admission. Error bars represent 95 % confidence intervals. Numbers along the x-axis indicate the numbers of patients involved in each category.
Figure 3—figure supplement 1.
Figure 3—figure supplement 1.. Temporal trends in case fatality rate amongst all patients.
Figure 3—figure supplement 2.
Figure 3—figure supplement 2.. Temporal trends in mean time from COVID-19 admission to final outcome (death or discharge).
Figure 3—figure supplement 3.
Figure 3—figure supplement 3.. Temporal trends in case fatality rate, faceted by ICU/HDU admission and further separated by age group.
Figure 3—figure supplement 4.
Figure 3—figure supplement 4.. Temporal trends in mean time from COVID-19 admission to final outcome, faceted by outcome and ICU/HDU admission and further separated by age group.
Figure 4.
Figure 4.. Regression model predictions for hospital CFR (A), predicted time to death in fatal cases (B) and predicted time to discharge in non-fatal cases (C) in a set of hypothetical typical patients.
Lines are plotted by month of COVID-19 admission (y-axis), age group (facets, left to right), sex (red: female, blue: male), and ICU admission (solid lines: at least once, dotted lines: never). The inset table (D) lists the comorbidities assigned to the individuals in each combination of sex and age group.
Figure 5.
Figure 5.. Sankey diagrams depicting the progress through the inpatient journey for patients with COVID-19 admission in April, June, August and October 2020, and subdivided by age.
Bars are presented for the day of admission (A), 3 and 7 days later (A + 3 and A + 7), and the day after final outcome (O + 1).
Figure 5—figure supplement 1.
Figure 5—figure supplement 1.. Expanded version of Figure 5, showing Sankey diagrams for all months.

References

    1. Alberca RW, Yendo T, Aoki V, Sato MN. Asthmatic patients and COVID-19: Different disease course? Allergy. 2021;76:963–965. doi: 10.1111/all.14601. - DOI - PMC - PubMed
    1. Bell LC, Norris-Grey C, Luintel A, Bidwell G, Lanham D, Marks M, Baruah T, O’Shea L, Heightman M, Logan S, University College London Hospitals COVID response team Implementation and evaluation of a COVID-19 rapid follow-up service for patients discharged from the emergency department. Clinical Medicine. 2021;21:e57–e62. doi: 10.7861/clinmed.2020-0816. - DOI - PMC - PubMed
    1. Brunson J. ggalluvial: Layered Grammar for Alluvial Plots. Journal of Open Source Software. 2020;5:2017. doi: 10.21105/joss.02017. - DOI - PMC - PubMed
    1. Choi H-G, Wee JH, Kim SY, Kim J-H, Il Kim H, Park J-Y, Park S, Il Hwang Y, Jang SH, Jung K-S. Association between asthma and clinical mortality/morbidity in COVID-19 patients using clinical epidemiologic data from Korean Disease Control and Prevention. Allergy. 2021a;76:921–924. doi: 10.1111/all.14675. - DOI - PMC - PubMed
    1. Choi YJ, Park JY, Lee HS, Suh J, Song JY, Byun MK, Cho JH. Effect of Asthma and Asthma Medication on the Prognosis of Patients with COVID-19. The European Respiratory Journal. 2021b;57:3. doi: 10.1183/13993003.02226-2020. - DOI - PMC - PubMed

Publication types