. 2022 Jan 3;219(1):e20210836.
doi: 10.1084/jem.20210836. Epub 2021 Nov 23.

An NR2F1-specific agonist suppresses metastasis by inducing cancer cell dormancy

Affiliations

An NR2F1-specific agonist suppresses metastasis by inducing cancer cell dormancy

Bassem D Khalil et al. J Exp Med. .

Abstract

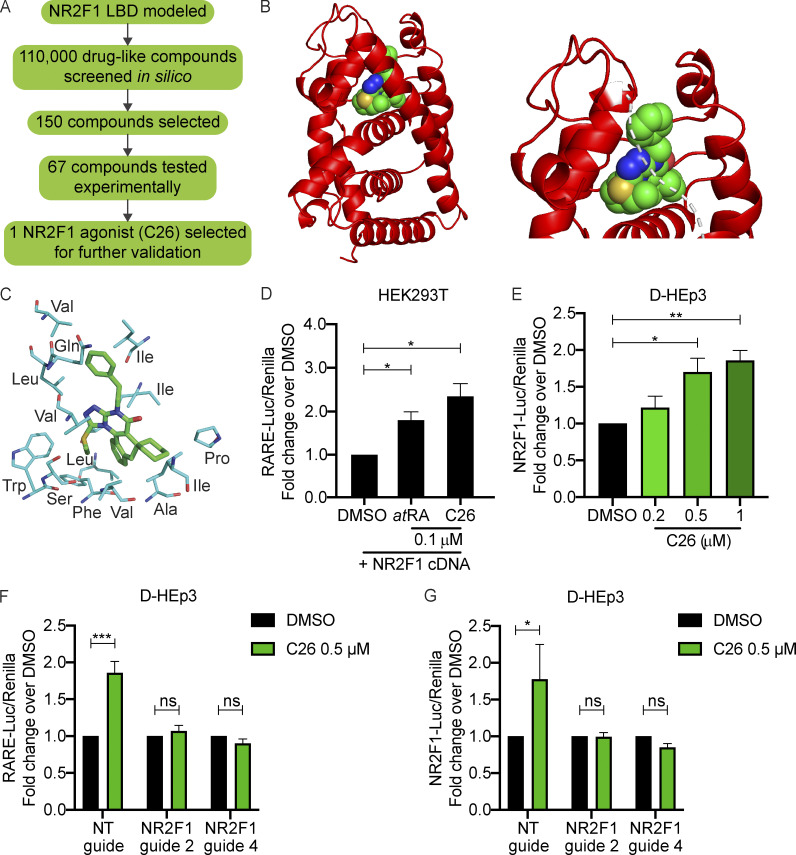
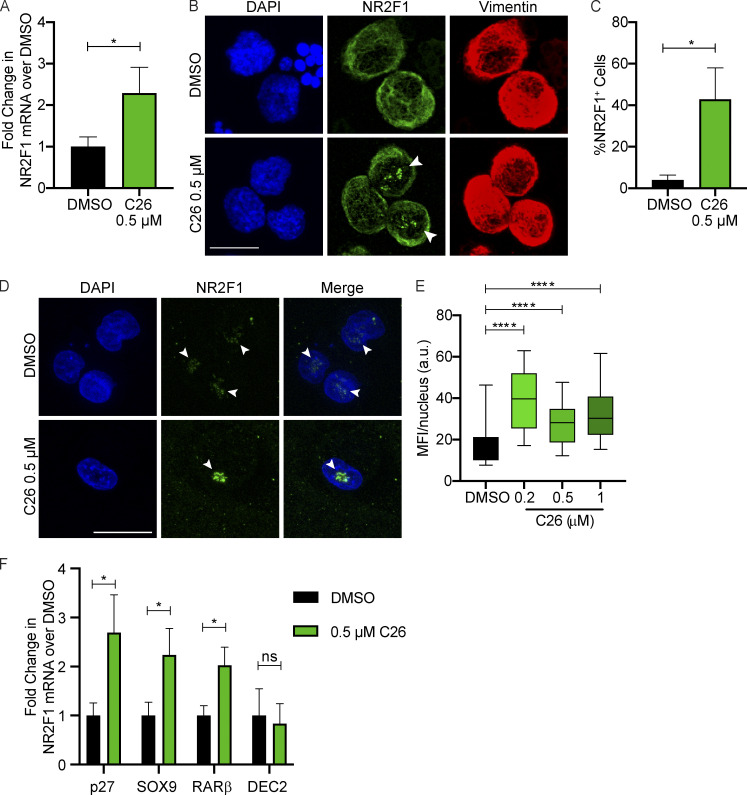
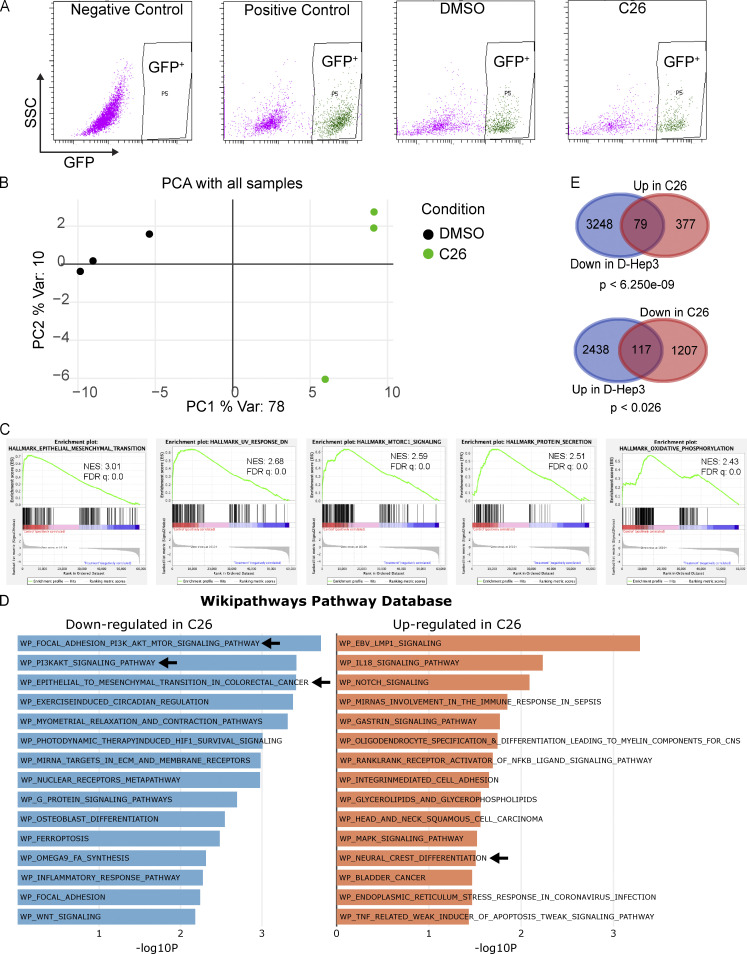
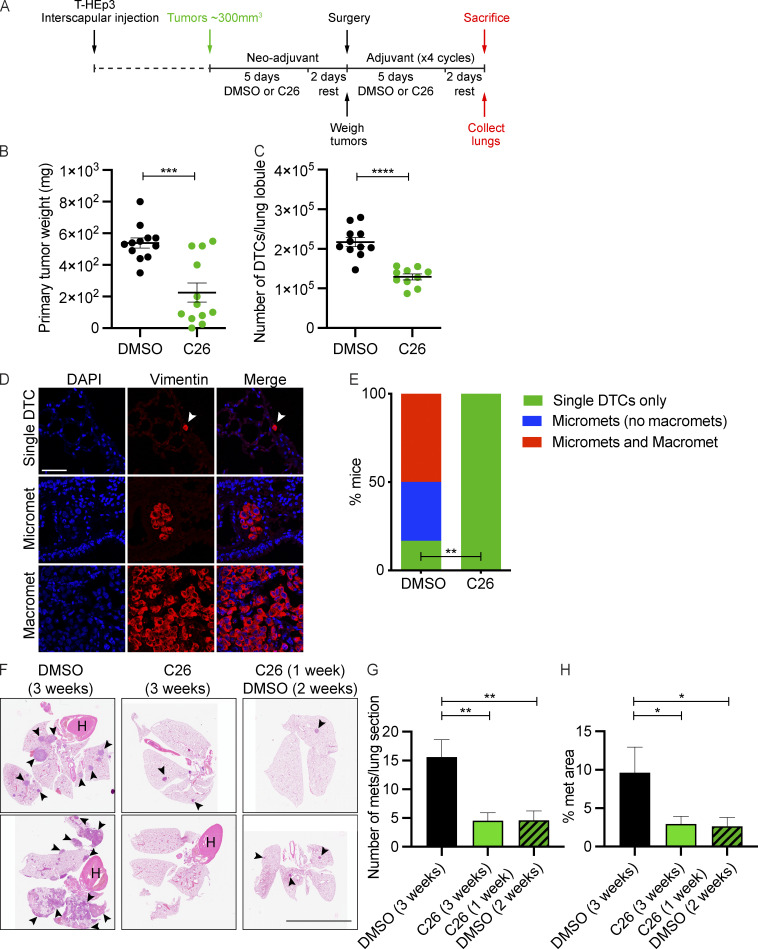
We describe the discovery of an agonist of the nuclear receptor NR2F1 that specifically activates dormancy programs in malignant cells. The agonist led to a self-regulated increase in NR2F1 mRNA and protein and downstream transcription of a novel dormancy program. This program led to growth arrest of an HNSCC PDX line, human cell lines, and patient-derived organoids in 3D cultures and in vivo. This effect was lost when NR2F1 was knocked out by CRISPR-Cas9. RNA sequencing revealed that agonist treatment induces transcriptional changes associated with inhibition of cell cycle progression and mTOR signaling, metastasis suppression, and induction of a neural crest lineage program. In mice, agonist treatment resulted in inhibition of lung HNSCC metastasis, even after cessation of the treatment, where disseminated tumor cells displayed an NR2F1hi/p27hi/Ki-67lo/p-S6lo phenotype and remained in a dormant single-cell state. Our work provides proof of principle supporting the use of NR2F1 agonists to induce dormancy as a therapeutic strategy to prevent metastasis.


Conflict of interest statement

Disclosures: J.A. Aguirre-Ghiso reported grants from HiberCell LLC during the conduct of the study; grants from HiberCell LLC outside the submitted work; and is a HiberCell LLC co-founder, consultant, and scientific advisory board member. No other disclosures were reported.

Figures

Figure 1.
Figure 1.
NR2F1 LBD modeling and agonist screen. (A) Diagram depicting the approach used to screen for NR2F1 agonists. (B) Left: Ribbon diagram (in red) of NR2F1 LBD modeled using MODELLER v9.10 shown with the agonist C26 (sphere representation) docked in the binding site. Right: Close-up of C26 docked in the binding site; white dotted line represents the part of the helix that was removed for a better view of the binding site. (C) Stick representation showing the interaction between C26 and mostly hydrophobic residues in the binding site of the NR2F1 LBD. (D) Graph showing the fold change of luciferase/Renilla activity using the RARE-luciferase reporter system in HEK293T cells with NR2F1 overexpression and treated for 18 h with DMSO, 0.1 µM atRA, or 0.1 µM C26. Data are shown as mean ± SEM from three independent experiments. *, P < 0.05 by t test. (E) Graph showing the mean fold change of luciferase/Renilla activity using the NR2F1-luciferase reporter system in D-HEp3 cells treated for 18 h with DMSO or C26 (0.2, 0.5, or 1 µM) ± SEM from three independent experiments. *, P < 0.05; **, P < 0.01 by ANOVA. (F and G) Graphs showing the fold change of luciferase/Renilla activity using RARE-luciferase (F) or NR2F1-luciferase (G) reporter systems in D-HEp3 cells expressing NT gRNA or with NR2F1 knockout using two separate gRNAs (guide 2 and guide 4). Cells were treated for 18 h with DMSO or 0.5 µM C26. Data are mean ± SEM from three independent experiments. *, P < 0.05; ***, P < 0.001 by ANOVA. See also Fig. S1.
Figure S1.
Figure S1.
Chemical structure of C26, KO controls for NR2F1, and effect of C26 on RXRα activation. (A) Chemical structure of C26 compound. (B) Western blot shows NR2F1 protein expression level in nuclear extracts of D-HEp3 cell lines with NT RNA or four different NR2F1 gRNAs. Arrows indicate the two cell lines that were selected for use in experiments (guide 2 [g2] and g4). Lamin-B1 is used as a loading control. (C) Graph showing the percent activation of RXRα using different C26 concentrations. Shaded area represents the range of C26 concentration that was used in our experiments.
Figure 2.
Figure 2.
C26 up-regulates NR2F1 expression. (A) T-HEp3 cells pretreated for 6 d with DMSO or 0.5 µM C26 were inoculated on CAM and treated daily. After 7 d, tumors were collected and RNA extracted. Graph shows mean fold change in NR2F1 mRNA levels over DMSO obtained by qPCR ± SEM from four tumors per group. *, P < 0.05 by t test. (B and C) CAM tumors treated as in A were dissociated and cell cytospins were generated and immunostained for NR2F1 and nuclei counterstained with DAPI. Graph shows the mean percentage of NR2F1+ cells ± SEM from four tumors per group (DMSO, 87 cells; C26, 128 cells). Scale bar, 10 µm; arrowheads indicate nuclear NR2F1. *, P < 0.05 by t test. (D and E) T-HEp3 cells were plated in Matrigel and treated with DMSO or 0.5 µM C26. After 4 d, cells were fixed and immunostained for NR2F1. Scale bar, 50 µm; arrowheads indicate nuclear NR2F1. Graph shows box (25th to 75th percentile) and whiskers (minimum to maximum values) of nuclear NR2F1 MFI per cell (DMSO, 64 cells; 0.2 µM, 26 cells; 0.5 µM, 29 cells; 1 µM, 23 cells from two independent experiments). ****, P < 0.0001. (F) SOX9, RARβ, p27, and DEC2 mRNA levels were measured using qPCR in CAM tumors described in A. Graph shows fold change in mRNA levels over DMSO ± SEM from four tumors per group. *, P < 0.05 by t test.
Figure S2.
Figure S2.
Sorting and RNA-seq controls and description and additional gene expression analysis. (A) Representative FACS plots showing gating strategy used to sort GFP+ cells from T-HEp3-GFP tumors. Negative control, T-HEp3 cells with no GFP; positive control, T-HEp3-GFP cells grown in culture; DMSO, cells from DMSO-treated T-HEp3-GFP tumors; C26, cells from C26-treated T-HEp3-GFP tumors; SSC, side scatter. (B) PCA plot generated using the top 500 genes with the highest variation (Var) in gene expression across samples. (C) Gene set enrichment profiles of the top 5 enriched gene sets in DMSO control. (D) Top 15 most down-regulated or up-regulated pathways from the WikiPathways database in C26 treatment. Arrows indicate the pathways that were discussed in text. (E) Venn diagrams showing DEGs down-regulated in D-HEp3 versus T-HEp3 and up-regulated in C26 versus DMSO (top) and DEGs up-regulated in D-HEp3 versus T-HEp3 and down-regulated in C26 versus DMSO (bottom). Statistical analysis was performed using a hypergeometric probability test.
Figure 3.
Figure 3.
RNA-seq analysis showing transcriptional changes induced by C26 treatment. T-HEp3-GFP cells pretreated for 6 d with DMSO or 0.5 µM C26 were inoculated on CAM and treated daily. After 7 d, GFP+ T-HEp3 cells were sorted by FACS from dissociated tumors, and mRNA was isolated and sequenced using next-generation sequencing as described in Materials and methods. (A) Heatmap showing differentially expressed genes (DEGs) between DMSO control and C26-treated samples (three replicates per condition). Up Reg, up-regulated; Down Reg, down-regulated; vst, variable stabilizing transformation. (B and C) Gene set enrichment profile showing enrichment of the PI3K_AKT_mTOR signaling pathway in DMSO (B) and the neural crest differentiation pathway in C26 (C). FDR, false discovery rate; NES, normalized enrichment score. (D) Graph showing fold change in the number of RNA-seq reads of 27 neural crest differentiation pathway genes that were significantly (q value < 0.05) up-regulated in C26 treatment; error bars show the standard deviation for mRNA levels for each gene. (E) Graphical summary of the most significant entities predicted in the core analysis using IPA software (Qiagen). Entities include canonical pathways, upstream regulators, transcription factors, and biological functions. Orange color, activated entities; blue color, inhibited entities in C26 treatment. (F) Venn diagrams showing DEGs down-regulated (Down) in D-HEp3 versus T-HEp3 and in C26 versus DMSO (top) and DEGs up-regulated (Up) in D-HEp3 versus T-HEp3 and in C26 versus DMSO (bottom). Statistical analysis was performed using a hypergeometric probability test. See also Figs. S2 and S3 and Table S1.
Figure S3.
Figure S3.
Control for NR2F1 KO in T-HEp3 cells and on neural crest cell marker gene expression. (A) Western blot shows NR2F1 protein expression level in nuclear extracts of T-HEp3 cell lines with NT RNA or four different NR2F1 gRNAs. Arrows indicate the two cell lines that were selected for use in experiments (g2 and g4). Lamin-B1 was used as a loading control. (B) mRNA levels of indicated transcripts were measured using qPCR in DMSO- or C26-treated CAM tumors from T-HEp3 cells with NT or NR2F1 gRNA (g2). Graph shows fold difference in mRNA levels obtained by qPCR and normalized to DMSO. Data represent mean ± SEM from six to eight tumors per group. *, P < 0.05; **, P < 0.01; ***, P < 0.001; ****, P < 0.0001 by t test.
Figure 4.
Figure 4.
C26 induces growth arrest via NR2F1. (A–C) T-HEp3, SQ20B, or FaDu cells were plated in Matrigel and treated with DMSO or C26 (0.2, 0.5, or 1 µM for T-HEp3; 0.5 µM for SQ20B and FaDu). After 4 d, cells were counted manually under a microscope. Graphs show percentage of single cells (A and C) or colonies of three or more cells (B). Data are shown as mean ± SEM from three independent experiments. *, P < 0.05; **, P < 0.01 by ANOVA (A and B). *, P < 0.05 by t test (C). (D) T-HEp3, SQ20B, or FaDu cells from A–C were fixed and immunostained for Ki-67. Graph shows the percentage of Ki-67+ cells. Data are shown as mean ± SEM from three (T-HEp3 and FaDu) or two (SQ20B) independent experiments. The total number of cells analyzed is 81 (DMSO) and 68 cells (C26) for T-HEp3; 125 (DMSO) and 117 cells (C26) for FaDu; and 49 (DMSO) and 34 cells (C26) for SQ20B. *, P < 0.05; **, P < 0.01 by t test. (E and F) T-HEp3 cells were pretreated in culture for 6 d with DMSO or 0.5 µM C26 and inoculated on CAM without continuous treatment (E) or with daily treatment (F). After 7 d, tumors were collected and dissociated. Graph shows the mean number of cells per tumor ± SEM from 20 tumors (DMSO) and 21 tumors (C26; E) or 7 tumors (DMSO) and 8 tumors (C26; F). *, P < 0.05; **, P < 0.01 by t test. (G–I) Single cells from patient-derived organoids were plated in Matrigel and treated with DMSO or 0.5 µM C26. After 7 d, 5–10 random widefield images per sample were acquired on a confocal microscope. Images in G are representative z-stack projections (scale bar, 100 µm). Graph in H shows the percentage of single cells or organoids per well. Data are mean ± SEM from three independent experiments. *, P < 0.05 by t test. Graph in I shows the colony area of 112 colonies (DMSO) or 33 colonies (C26) from three independent experiments. ****, P < 0.0001 by t test. (J) T-HEp3 cells expressing CDK2 biosensor were plated on Matrigel and treated with DMSO or 0.5 µM C26 for 48 h. Cells in different phases of the cell cycle were manually counted under a microscope. Graph shows the percentage of cells in G0/G1, S, or G2/M phases of the cell cycle. Data are shown as mean ± SEM from three independent experiments. *, P < 0.05; **, P < 0.01. (K and L) T-HEp3 cells with NT gRNA or two different NR2F1 gRNAs (guide 2 and guide 4) were plated in Matrigel and treated with DMSO or 0.5 µM C26. After 4 d, cells were counted manually under a microscope. Graphs show the mean number of single cells (J) or colonies with more three or more cells (K). Data represent mean ± SEM from two independent experiments. *, P < 0.05; **, P < 0.01 by ANOVA. See also Fig. S4.
Figure S4.
Figure S4.
Effect of C26 on HNSCC cell lines, apoptosis, cell cycle, and knockdown controls and C26 effect on single cell and colony frequencies in 3D cultures. (A) Representative images of THEp3, FaDu, and SQ20B cells plated in Matrigel and treated with DMSO or C26 (0.5 µM) for 4 d then fixed and immunostained for Ki-67. Scale bar, 25 µm. (B) DMSO or C26 (0.5 µM) treated CAM tumors were dissociated and cell cytospins were generated. Cytospins were immunostained for cleaved caspase-3 and nuclei counterstained with DAPI. Graph shows the percentage of cleaved caspase-3+ cells from four tumors per group. (C) Representative images of T-HEp3 cells expressing CDK2 biosensor in G0/G1, S, or G2/M phases of the cell cycle. Scale bar, 25 µm. (D) NR2F2 mRNA levels in T-HEp3 cells transfected with control siRNA or two different NR2F2 siRNAs. (E and F) T-HEp3 cells transfected with control siRNA or two different NR2F2 siRNAs were plated in Matrigel and treated with DMSO or C26 (0.5 µM). After 4 d, cells were counted manually under a microscope. Graphs show the percentage of single cells (E) or colonies of three or more cells (F). Data are mean ± SEM from two independent experiments. *, P < 0.05; **, P < 0.01; ***, P < 0.001 by ANOVA.
Figure 5.
Figure 5.
C26 suppresses primary tumor growth and lung metastasis in mice. (A) Schematic depicting xenograft establishment as well as neoadjuvant and adjuvant treatment with DMSO or C26 (0.5 mg/kg/day) in mice. (B) Graph showing the weight of primary tumors surgically resected after the neoadjuvant phase. Data are mean ± SEM from 12 mice per group. ***, P < 0.001 by t test. (C) Graph showing the number of T-HEp3-GFP+ cells in collagenase-digested lung lobules counted under a fluorescence microscope. Data are mean ± SEM from 11 mice (DMSO) and 10 mice (C26). ****, P < 0.0001 by t test. (D) Lung sections from A were immunostained for vimentin to detect single DTCs, micrometastases (<50 cells), or macrometastases (>50 cells). Scale bar, 50 µm. (E) Graph showing the percentage of DMSO- or C26-treated mice with single DTCs only, micrometastases only, or micrometastases and macrometastases. **, P < 0.01 by Fisher’s exact test. (F–H) Experimental metastasis assay was performed by injecting T-HEp3 cells into tail veins of BALB/c nu/nu mice, which were treated by i.p. injection of DMSO for 3 wk, C26 (0.5 mg/kg/day) for 3 wk, or C26 (0.5 mg/kg/day) for 1 wk and then DMSO for 2 wk. Two representative images of lungs stained with H&E are shown in F. Arrowheads indicate metastatic lesions. Scale bar, 10 mm. Graphs show the number of metastases per lung section (G) and percentage of lung area section with metastasis (H). *, P < 0.05; **, P < 0.01 by t test. See also Fig. S5.
Figure S5.
Figure S5.
Effect of C26 on NR2F1 expression and apoptosis in primary tumors, association of DTC numbers and tumor weight, effect of AZA+atRA on primary tumor weight and DTC burden, effect of C26 on apoptosis of DTCs and quantification, and quantification of NR2F1 signal intensity in DTCs. (A) Representative images of primary tumors from the spontaneous metastasis experiment immunostained for NR2F1. Scale bar, 75 µm. Graph shows the percentage of NR2F1+ cells. Data are mean ± SEM from eight mice per group. *, P < 0.05 by t test. Arrowheads indicate examples of NR2F1+ cells. (B) Representative images of primary tumors from the spontaneous metastasis experiment immunostained for cleaved caspase-3 (cc-3). Scale bar, 100 µm. Graph shows the percentage of cc-3+ cells. Data are mean ± SEM from eight mice per group. Arrowheads indicate examples of cc-3+ cells. (C) Supplementary data for Fig. 5. Graphs show correlation between primary tumor weight and number of DTC per lung lobule of DMSO- or C26-treated mice. (D) Schematic depicting treatment protocol used for the combination of AZA and then ATRA/C26 in the neoadjuvant setting. (E) Graph shows weight of primary tumors surgically resected after the neoadjuvant phase. Data are mean ± SEM from 12 mice per group. *, P < 0.05; ***, P < 0.001 by t test. (F) Graph shows number of T-HEp3-GFP+ cells in collagenase-digested lung lobules counted under a fluorescence microscope. Data are mean ± SEM from 11 mice (DMSO), 10 mice (C26), and 10 mice (AZA+atRA/C26). *, P < 0.05; ****, P < 0.0001 by t test. Data for DMSO and C26 are the same as those presented in Fig. 5, B and C, as the AZA+atRA/C26 treatment was done in parallel. (G) Graph shows weight of mice (in grams) measured weekly in the experimental metastasis experiment. (H) Lungs from DMSO- or C26-treated mice described in Fig. 4 were immunostained for vimentin and cleaved caspase-3. Scale bar, 50 µm. (I) Graph shows percentage of cleaved caspase-3/vimentin+ tumor cells in lungs. (J) Graph shows box (25th to 75th percentile) and whiskers (minimum to maximum values) of nuclear NR2F1 MFI in single DTCs only in lungs from DMSO- and C26-treated mice. ****, P < 0.0001 by t test.
Figure 6.
Figure 6.
C26 suppresses metastatic growth in lungs by inducing dormancy. (A) Lungs from DMSO- or C26-treated mice described in Fig. 4 were immunostained for vimentin, Ki-67, and NR2F1. Scale bar, 50 µm. (B and C) Graphs showing the percentage of Ki-67+/vimentin+ (B) or NR2F1+/vimentin+ (C) tumor cells in lungs. Data are mean ± SEM. (D) Graph showing box (25th to 75th percentile) and whiskers (minimum to maximum values) of nuclear NR2F1 MFI per cell. Data in B–D are from five mice per group (DMSO, 250 cells; C26, 150 cells). *, P < 0.05; **, P < 0.01; ****, P < 0.0001 by t test. (E) Lungs from DMSO- or C26-treated mice described in Fig. 4 were immunostained for vimentin and p27. Scale bar, 50 µm. (F) Graph showing the percentage of vimentin+ tumor cells with nuclear accumulation of p27. Data are mean ± SEM. (G) Graph shows box (25th to 75th percentile) and whiskers (minimum to maximum values) of nuclear p27 MFI per cell in vimentin+ tumor cells. Data in F and G are from five mice per group (DMSO, 174 cells; C26, 85 cells). **, P < 0.01; ****, P < 0.0001 by t test. (H) Lungs from DMSO- or C26-treated mice described in Fig. 4 were immunostained for vimentin and p-S6. Scale bar, 50 µm. Arrowheads in C26 indicate solitary DTCs that are negative for p-S6. (I) Graph showing the percentage of vimentin+ tumor cells with a positive p-S6 signal. Data are mean ± SEM from five mice per group. **, P < 0.01 by t test. See also Fig. S5.
Figure 7.
Figure 7.
NR2F1 levels in solitary human DTCs and C26 signature in disease progression in HNSCC. (A) HNSCC patient samples of normal epithelium, primary tumors, or lymph nodes with solitary DTCs were immunostained for NR2F1 and pan-CK and nuclei counterstained with DAPI. Scale bar, 50 µm (normal epithelium and primary tumor) or 10 µm (solitary DTC). The total number of cells analyzed is 1,814 cells for normal epithelium and 3,841 cells for primary tumors from two patients and 271 solitary DTCs from three patients. (B) Graph showing the percentage of NR2F1hi, NR2F1med, or NR2F1−/low cells in normal epithelium (n = 1,814 cells from two patients), primary tumor (PT; n = 3,841 cells from two patients), or solitary DTCs (n = 271 cells from three patients). ***, P < 0.001 by Fisher’s exact test adjusted with false discovery rate correction by Benjamini–Hochberg. (C) Kaplan–Meier plots of overall survival (left panel) or relapse-free survival (right panel) generated from 500 HNSCC patients using the Kaplan–Meier plotter database. Hazard ratio (HR) with 95% confidence intervals and log-rank P value are shown.

References

    1. Adam, A.P., George A., Schewe D., Bragado P., Iglesias B.V., Ranganathan A.C., Kourtidis A., Conklin D.S., and Aguirre-Ghiso J.A.. 2009. Computational identification of a p38SAPK-regulated transcription factor network required for tumor cell quiescence. Cancer Res. 69:5664–5672. 10.1158/0008-5472.CAN-08-3820 - DOI - PMC - PubMed
    1. Aguirre-Ghiso, J.A. 2007. Models, mechanisms and clinical evidence for cancer dormancy. Nat. Rev. Cancer. 7:834–846. 10.1038/nrc2256 - DOI - PMC - PubMed
    1. Aguirre-Ghiso, J.A. 2021. Translating the Science of Cancer Dormancy to the Clinic. Cancer Res. 81:4673–4675. 10.1158/0008-5472.CAN-21-1407 - DOI - PMC - PubMed
    1. Aguirre Ghiso, J.A., Kovalski K., and Ossowski L.. 1999. Tumor dormancy induced by downregulation of urokinase receptor in human carcinoma involves integrin and MAPK signaling. J. Cell Biol. 147:89–104. 10.1083/jcb.147.1.89 - DOI - PMC - PubMed
    1. Aguirre-Ghiso, J.A., Ossowski L., and Rosenbaum S.K.. 2004. Green fluorescent protein tagging of extracellular signal-regulated kinase and p38 pathways reveals novel dynamics of pathway activation during primary and metastatic growth. Cancer Res. 64:7336–7345. 10.1158/0008-5472.CAN-04-0113 - DOI - PubMed

Publication types

MeSH terms

Substances