. 2022 Jan 18;132(2):e150985.
doi: 10.1172/JCI150985.

Positive and negative selection shape the human naive B cell repertoire

Affiliations

Positive and negative selection shape the human naive B cell repertoire

Jeff W Chen et al. J Clin Invest. .

Abstract

Although negative selection of developing B cells in the periphery is well described, yet poorly understood, evidence of naive B cell positive selection remains elusive. Using 2 humanized mouse models, we demonstrate that there was strong skewing of the expressed immunoglobulin repertoire upon transit into the peripheral naive B cell pool. This positive selection of expanded naive B cells in humanized mice resembled that observed in healthy human donors and was independent of autologous thymic tissue. In contrast, negative selection of autoreactive B cells required thymus-derived Tregs and MHC class II-restricted self-antigen presentation by B cells. Indeed, both defective MHC class II expression on B cells of patients with rare bare lymphocyte syndrome and prevention of self-antigen presentation via HLA-DM inhibition in humanized mice resulted in the production of autoreactive naive B cells. These latter observations suggest that Tregs repressed autoreactive naive B cells continuously produced by the bone marrow. Thus, a model emerged, in which both positive and negative selection shaped the human naive B cell repertoire and that each process was mediated by fundamentally different molecular and cellular mechanisms.

Keywords: Autoimmunity; Immunology; Tolerance.


Conflict of interest statement

Conflict of interest: EM is an advisor for and receives research funding from AbbVie Inc.

Figures

Figure 1
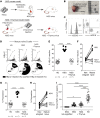
Figure 1. Peripheral selection of autoreactive naive B cells requires the presence of an autologous thymus.
(A) Schematic diagram depicting the generation of 2 humanized mouse models. CD34+ HSCs were injected into the liver of NSG pups (NSG mouse model) or i.v. into adult mice, along with surgical implantation of a piece of autologous thymus under the kidney capsule (NSG + thymus mouse model). (B) Representative image of the engrafted human thymic organoid upon sacrifice of the humanized mouse. (C) Representative flow cytometric analysis of the frequency of human (h) CD45+, CD3+, and CD19+ cells, reflecting the extent of engraftment in the blood of humanized mice. Max, maximum; Q, quadrant.(D) Recombinant Abs cloned from mature naive B cells from HDs (n = 13), NSG humanized mice (n = 7), and NSG + thymus humanized mice (n = 7) were tested by ELISA for anti–HEp-2 cell reactivity. Dotted lines show the ED38 positive control. Horizontal lines show the cutoff OD405 for positive reactivity. For each individual or humanized mouse, the frequency of nonreactive (white area) and reactive (black area) clones is summarized in a pie chart below, with the total number of clones tested indicated in the centers. The frequencies of HEp-2–reactive and polyreactive mature naive B cells are summarized in E and G, respectively. Each symbol represents an individual or humanized mouse. Solid lines show the mean. The frequencies of (F) HEp-2–reactive and (H) polyreactive B cells and their evolution between the new emigrant/transitional and mature naive B cell stages in NSG and NSG + thymus humanized mice. (I) Human BAFF concentrations were measured by ELISA in the sera of nonengrafted NSG mice, NSG humanized mice, NSG + thymus humanized mice, and HDs. *P < 0.05 and ****P < 0.0001, by Mann-Whitney U test (E, G, and I).
Figure 2
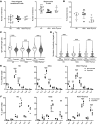
Figure 2. Peripheral positive B cell selection allows the expansion of clones expressing specific BCRs.
(A) Evaluation of the number of cell divisions that occurred in vivo by KREC analysis of new emigrant/transitional and mature naive B cells isolated from the blood of HDs (n = 15) and the spleens of NSG (n = 10) or NSG + thymus (n = 4) humanized mice. (B) Proportions of IgH CDR3s identified more than once (expanded clones) in IgH sequences from mature naive B cells isolated from 4 HDs (146,604 sequences), 6 NSG humanized mice (133,800 sequences), and 5 NSG + thymus (45,223 sequences) humanized mice. Violin plots represent the IgH CDR3 length in amino acids (C) and numbers of positively charged amino acids, i.e., arginine, lysine, and histidine in IgH CDR3s (D) of nonexpanded versus expanded clones in HDs and NSG and NSG + thymus humanized mice. VH family usage (E) and JH gene usage (F) of nonexpanded versus expanded mature naive B cells in HDs, NSG humanized mice, and NSG + thymus humanized mice. *P < 0.05, **P < 0.01, ***P < 0.001, by 2-way ANOVA followed by Tukey’s post hoc multiple-comparison test.
Figure 3
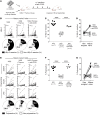
Figure 3. Tregs are necessary for the establishment of the peripheral B cell tolerance checkpoint.
(A) Schematic diagram depicting the Treg depletion strategy. NSG + thymus humanized mice were i.v. injected with 200 μg mouse anti–human CD25 Abs once a week for 4 weeks before analysis of B cell Ab reactivity. Recombinant Abs cloned from mature naive B cells from NSG (n = 7), NSG + thymus (n = 7), and anti–CD25 Ab–injected NSG + thymus (n = 3) humanized mice were tested by ELISA for (B) anti–HEp-2 cell reactivity and (E) polyreactivity. Reactivity curves are represented as in Figure 1. Frequencies of (C) HEp-2–reactive and (F) polyreactive mature naive B cells. Each symbol represents an individual or a humanized mouse. Solid lines indicate the mean. Frequencies of (D) HEp-2–reactive and (G) polyreactive B cells and their evolution between the new emigrant/transitional and mature naive B cell stages in NSG + thymus humanized mice injected or not with anti-CD25 Abs. ****P < 0.0001, by Kruskal-Wallis test.
Figure 4
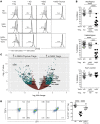
Figure 4. Tregs from NSG humanized mice display defective suppressive capacity and a dysregulated transcriptome and phenotype.
(A) Representative flow cytometric analysis of Treg-mediated in vitro suppression of autologous and heterologous CFSE-labeled conventional Tconv cells on day 3.5. Dashed line shows nonstimulated Tconv cells. (B) Summaries of the suppressive capacity of Tregs from HDs, NSG humanized mice, and NSG + thymus humanized mice in autologous and heterologous settings. The bottom panel shows the percentage of suppression in control settings, where HD Tregs were paired with Tconv cells from HDs, NSG humanized mice, or NSG + thymus humanized mice. (C) Volcano plot from the RNA-Seq analysis (x axis shows the log2 fold change; y axis shows –log10 adjusted P values). Significantly differentially expressed genes are plotted as green dots, and select genes are labeled. The right half of the graph shows genes that were upregulated in NSG Tregs, and the left half shows genes that were upregulated in NSG + thymus Tregs. (D) Representative flow cytometric plots and summary of TCF1 and LEF1 expression in Tregs from HDs, NSG, and NSG + thymus humanized mice. ***P < 0.001 and ****P < 0.0001, by Kruskal-Wallis test.
Figure 5
Figure 5. Patients with B cell-selective MHC Class II deficiency harbor elevated proportions of autoreactive mature naive B cells.
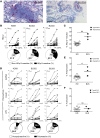
(A) Residual HLA-DR expression was detected in patients BLS02 and BLS03. Formalin-fixed biopsy specimens from the duodenum of patient BLS02 and rectum of patient BLS03 were stained with anti–HLA-DR. Scale bars: 100 μm. (B) HEp-2 reactivity and (D) polyreactivity of recombinant Abs cloned from single mature naive B cells from a representative HD (HD09) and patients BLS02 and BLS03. Reactivity curves are represented as in Figure 1. Plots showing results for (C) HEp-2 reactivity, (E) polyreactivity, and (F) antinuclear reactivity in the mature naive B cell compartment. Each white diamond represents a HD, each black diamond represents a new patient with atypical BLS, and the black square represents the previously reported patient with typical BLS (40). *P < 0.05 and **P < 0.01, by Mann-Whitney U test.
Figure 6
Figure 6. B cell–intrinsic antigen presentation is required for the establishment of the peripheral tolerance checkpoint.
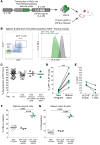
(A) CD34+ HSCs were transduced with a GFP-tagged lentivirus that allowed the expression of an shRNA against HLA-DM before engraftment into NSG + thymus humanized mice. LTR, long terminal repeat.(B) Representative flow cytometric analysis of CD19+ B cells isolated from the spleens of these modified NSG + thymus humanized mice. Left panel shows surface CLIP expression versus GFP expression; right panel shows intracellular staining for HLA-DM in sorted GFP+CLIP+ B cells versus GFP B cells. (C) Suppressive capacity of GFP and GFP+ Tregs from DM-knockdown NSG + thymus humanized mice compared counterpart Tregs from HDs, NSG humanized mice, and NSG + thymus humanized mice. Tregs from DM-knockdown humanized mice were suppressive regardless of GFP expression. (D) Proportions of GFP+CLIP+ B cells in the new emigrant/transitional and mature naive B cell compartments. (E) Proportions of GFP+ B cells and GFP+ T cells in the 3 HLA-DM–knockdown NSG + thymus humanized mice from which recombinant Abs were cloned from single B cells. The frequencies of (F) HEp-2–reactive and (G) polyreactive mature naive B cells from sorted GFP+CLIP+ B cells were determined and compared with those of GFP (unmodified) B cells from the same mice. Each symbol represents a mouse, and the average is shown with a bar. **P < 0.01 and ****P < 0.0001, by Kruskal-Wallis test.
Figure 7
Figure 7. Peripheral B cell selection requires cognate interactions between B cells and T cells.
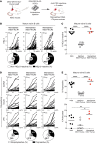
(A) Thymic graft from 1 fetal donor was cotransplanted with HSCs from a different HLA-mismatched fetus into an NSG mouse. Two 50 μg doses of anti-CD2 were injected after the surgery to deplete initial thymocytes in the thymic graft. (B) HEp-2 reactivity of recombinant Abs cloned from single mature naive B cells from 3 HLA-mismatched NSG + thymus humanized mice were assessed by ELISA. (C) Summary of the frequencies of HEp-2–reactive mature naive B cells in mismatched NSG + thymus humanized mice compared with regular NSG + thymus and NSG humanized mice. Each symbol represents a mouse, and the average is shown with a bar. (D) Polyreactivity of recombinant Abs cloned from single mature naive B cells from 3 HLA-mismatched NSG + thymus (NSG+Thy) humanized mice was assessed by ELISA. (E) Summaries of the frequencies of polyreactive and antinuclear clones in mismatched NSG + thymus humanized mice compared with regular NSG + thymus and NSG humanized mice. *P < 0.01 and ****P < 0.0001, by Kruskal-Wallis test.

References

    1. Wardemann H, et al. Predominant autoantibody production by early human B cell precursors. Science. 2003;301(5638):1374–1377. doi: 10.1126/science.1086907. - DOI - PubMed
    1. Meffre E, O’Connor KC. Impaired B-cell tolerance checkpoints promote the development of autoimmune diseases and pathogenic autoantibodies. Immunol Rev. 2019;292(1):90–101. doi: 10.1111/imr.12821. - DOI - PMC - PubMed
    1. Ng YS, et al. Bruton’s tyrosine kinase is essential for human B cell tolerance. J Exp Med. 2004;200(7):927–934. doi: 10.1084/jem.20040920. - DOI - PMC - PubMed
    1. Isnardi I, et al. IRAK-4- and MyD88-dependent pathways are essential for the removal of developing autoreactive B cells in humans. Immunity. 2008;29(5):746–757. doi: 10.1016/j.immuni.2008.09.015. - DOI - PMC - PubMed
    1. Menard L, et al. The PTPN22 allele encoding an R620W variant interferes with the removal of developing autoreactive B cells in humans. J Clin Invest. 2011;121(9):3635–3644. doi: 10.1172/JCI45790. - DOI - PMC - PubMed

Publication types

Substances