Clinical Trial
. 2022 Jan 18;132(2):e150535.
doi: 10.1172/JCI150535.

Neoantigen-reactive CD8+ T cells affect clinical outcome of adoptive cell therapy with tumor-infiltrating lymphocytes in melanoma

Affiliations
Clinical Trial

Neoantigen-reactive CD8+ T cells affect clinical outcome of adoptive cell therapy with tumor-infiltrating lymphocytes in melanoma

Nikolaj Pagh Kristensen et al. J Clin Invest. .

Abstract

BACKGROUNDNeoantigen-driven recognition and T cell-mediated killing contribute to tumor clearance following adoptive cell therapy (ACT) with tumor-infiltrating lymphocytes (TILs). Yet how diversity, frequency, and persistence of expanded neoepitope-specific CD8+ T cells derived from TIL infusion products affect patient outcome is not fully determined.METHODSUsing barcoded pMHC multimers, we provide a comprehensive mapping of CD8+ T cells recognizing neoepitopes in TIL infusion products and blood samples from 26 metastatic melanoma patients who received ACT.RESULTSWe identified 106 neoepitopes within TIL infusion products corresponding to 1.8% of all predicted neoepitopes. We observed neoepitope-specific recognition to be virtually devoid in TIL infusion products given to patients with progressive disease outcome. Moreover, we found that the frequency of neoepitope-specific CD8+ T cells in TIL infusion products correlated with increased survival and that neoepitope-specific CD8+ T cells shared with the infusion product in posttreatment blood samples were unique to responders of TIL-ACT. Finally, we found that a transcriptional signature for lymphocyte activity within the tumor microenvironment was associated with a higher frequency of neoepitope-specific CD8+ T cells in the infusion product.CONCLUSIONSThese data support previous case studies of neoepitope-specific CD8+ T cells in melanoma and indicate that successful TIL-ACT is associated with an expansion of neoepitope-specific CD8+ T cells.FUNDINGNEYE Foundation; European Research Council; Lundbeck Foundation Fellowship; Carlsberg Foundation.

Trial registration: ClinicalTrials.gov NCT00937625.

Keywords: Cancer immunotherapy; Immunology; Melanoma; T cells; Therapeutics.


Figures

Figure 1
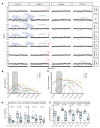
Figure 1. Detection of neoepitope-specific CD8+ T cells in expanded TILs of melanoma.
(A) Melanoma-specific mutation-derived peptides were predicted to bind patient’s HLA molecules using the prediction platform MuPeXI. DNA barcode–labeled MHC multimers with either neopeptides or virus-derived peptides were assembled on a PE-labeled streptavidin-conjugated dextran backbone. Multimer-binding NARTs were fluorescence sorted and T cell specificities decoded by barcode sequencing. (B) Examples of neoepitope- and virus-specific CD8+ T cells detected in expanded TILs of melanoma patient M22 (PR) across available HLAs. Significant barcode enrichment is defined based on a log2 FC of the number of barcode reads compared with triplicate baseline samples. P ≤ 0.001 (egdeR) after correction for multiple hypothesis testing (see Methods). Blue, NARTs; red, virus-specific CD8+ T cells; black, multimers with nonenriched barcodes. V17 annotate EBV peptide RAKFKQLL. (C) Number and frequency of neoepitope- and virus-specific CD8+ T cells in TIL samples across cohort of 26 melanoma patients. Blue, NARTs; red, virus-specific CD8+ T cells. Number of and frequency of NARTs were normalized to absolute HLA coverage (see Methods). Sum est. frequency, sum of estimate frequency.
Figure 2
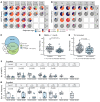
Figure 2. Autologous tumor recognition by enriched NARTs.
(A) Correlation of TIL reactivity to autologous tumor (measured by intracellular cytokine staining) and sum of estimated NART frequency. TIL reactivity toward an autologous tumor cell line was defined as positive for 2 out of the 3 proteins TNF-α, IFN-γ, and CD107a. Sixteen patients with available tumor reactivity data were included from both responder (n = 6) and nonresponders (n = 10). R and P values from Spearman’s correlation with 95% CIs in gray. NART frequency was normalized to absolute HLA coverage (see Methods). (B and C) HLA-B*08:01–restricted, NLFR-specific CD8+ T cells from M22 TIL Inf product were sorted based on 2-color tetramer binding (B) and expanded in vitro followed by NLFR-tetramer staining (C). (D) Tumor reactivity as measured by TNF-α/IFN-γ release after coculture of expanded, NART-specific cell products with or without autologous tumor cell lines, with PMA/ionomycin or with autologous tumor cell line and IFN-γ. NLFR, NLFRRVWEL from USP34S1391F. TIL reactivity data shown in A originate from previous study (4), and the assay was performed as described previously (66).
Figure 3
Figure 3. Frequency of NARTs correlates with increased survival after TIL-ACT.
(A and B) NART diversity represented as the number of NARTs detected in TIL Inf products for each patient according to RECIST (A) and clinical response (B). (C and D) NART frequency represented as the sum of estimated frequency of NARTs detected in TIL Inf products for each patient according to RECIST (C) and clinical response (D). (E and F) PFS for the cohort split by median NART diversity (median = 3.65 NARTs) (E) and median NART frequency (median = 0.63 %) (F). (G and H) PFS for the cohort splits by high (>66th percentile), intermediate (> 33rd percentile), and low groups (≤33rd percentile). (G) NART diversity. 66th percentile = 5.65 NARTs. 33rd percentile = 0.88 NARTs. (H) NART frequency. 66th percentile = 3.26%. 33rd percentile = 0.03%. P values were calculated using Kruskal-Wallis test followed by Dunn’s multiple comparison test in A and C; only significant comparisons are shown. Nonparametric Mann-Whitney U test was used for B and D. Box plot whiskers represent IQR. P values and HRs were calculated using the Mantel-Cox test and log-rank approach, respectively (F). P values for G and H were calculated using log-rank test. Both number of and frequency of NARTs were normalized to absolute HLA coverage (see Methods). n = 26 for all plots. All values displayed on a logarithmic scales were increased by 0.01 to account for 0 values.
Figure 4
Figure 4. NARTs appear in peripheral blood and decline in frequency following TIL-ACT.
(A) Output example from screening paired PBMCs from 19 patients. Virus- and neoepitope-specific CD8+ T cells in patient M22 (PR) in pre-ACT PBMCs, TIL Inf product, and PBMCs following TIL-ACT. Blue, NARTs; red, virus-specific CD8+ T cells; black, multimers associated with nonenriched barcodes. Significant barcode enrichment is defined based on a log2 FC of the number of barcode reads compared with triplicate baseline samples. P < 0.001 (egdeR) (see Methods). V1 annotate FLU peptide ELRSRYWAI, v17 annotate EBV peptide RAKFKQLL, v30 annotate EBV peptide QAKWRLQTL, and v31 annotated EBV peptide FLRGRAYGL. (B and C) Median number of NARTs. Error bars indicate IQR. Points were displaced for visual purposes. (B) Number of NART responses and sum of estimated NART frequency (C) over time in TIL Inf product and available PBMC samples. Patients were divided according to RECIST groups. (D and E) Box plots representing diversity (D) and frequency (E) of NARTs for each patient according to RECIST groups. P values were calculated using Mann-Whitney U test. Nineteen patients had both TIL Inf products and PBMCs available, but the number of samples at each time point varied according to sample and data availability (Supplemental Table 1 and Supplemental Figure 8). NART frequency could not be calculated for M40 PBMCs before ACT and for M40 PBMCs less than 1 month after treatment (see Methods) and are therefore excluded in C and E. Whiskers represent IQR. NART frequencies were normalized to HLA coverage of the given patient (see Methods). All values displayed on logarithmic scales were increased by 0.01 to account for 0 values.
Figure 5
Figure 5. Responding patients have high-frequency engrafting NARTs in their TIL Inf product.
(A and B) Each NART population was annotated and colored according to first appearance in pre-ACT PBMCs, TIL Inf products, and post-ACT PBMCs (<1 month to <48 months). Black numbers specify the total number of NARTs detected for the specific time and RECIST group. (A) Distribution of NARTs within RECIST groups according to first appearance. (B) Distribution of NART frequency within RECIST groups according to first appearance. *M01 (CR) did not have pre-ACT and <1 month PBMCs available and was excluded from analysis to avoid a biased distribution. **Frequency data could not be calculated for M40 pre-ACT and M40 post-ACT <1 month, which were excluded (see Methods). (C) Venn diagram showing the overlap of detected NARTs among pre-ACT PBMCs, TIL Inf products, and all post-ACT PBMC samples. n = 19. (D) The estimated frequency of each NART population detected less than 1 month after infusion. Responses were either regarded as engrafted (i.e., also detected in TIL Inf) or novel. n = 16. M01 and M40 were excluded as stated for A and B; M29 did not have detectable antigen-specific CD8+ T cells before the second time point after ACT. (E) The estimated frequency of each NART population observed in TIL Inf products. Nonengrafted versus engrafted (i.e., detected at least once at a later time points). n = 19. (F and G) Number and frequency of engrafted NARTs, defined by presence in both TIL Inf product and after TIL-ACT. n varied according to sample availability (Supplemental Table 1 and Supplemental Figure 8). M40 before ACT and <1 month PBMCs were excluded from G (see Methods). Sum of estimated frequency in G was increased by 0.01 to account for 0 values. P values from Mann-Whitney U test. Whiskers represent IQR.
Figure 6
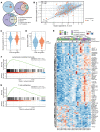
Figure 6. Characteristics of immunogenic neoepitopes.
(A) Venn diagram of 5921 unique pMHC; 204 immunogenic and 5717 nonimmunogenic as determined by the presence of neoepitope-specific CD8+ T cells in patients at any time. The distribution and overlap of immunogenic versus nonimmunogenic neoepitopes deriving from either cancer-driver genes (6.5% versus. 3.3%, P = 0.0048, z test), C/T mutations (3.4% versus. 3.5%, P = 0.78, z test), or clonal mutations (80.1% versus 86.0% P = 0.03, z test). Clonality could not be determined for 913 neopeptides, as WES was performed on autologous tumor cell lines (M22, M24, and a subset of M15). These were excluded from the z test, but included in the Venn diagram as subclonal mutations for visualization. (B) Eluted ligand (EL) percentage rank score of mutated peptide compared with percentage rank score of the corresponding germline peptide without mutation or nearest germline peptide. Red, immunogenic peptides. 3.4% CB versus 3.5 % IB, P = 0.99, z test. (C) Mutant EL percentage rank score comparing proportion of immunogenic neoepitopes above and below 0.5 percentage rank score (3.3 % versus 3.5, P = 0.71, z test). (D) RNA expression (TPM) comparing proportion of immunogenic peptides with expression above and below 2 TPM (4.2 % versus. 2.6%, P = 0.001, z test). (E) Unsupervised clustering of the 226 differentially expressed gene according to high and low sum of estimated frequency within TIL Inf products split by the median frequency (0.63%). Denoted names were prioritized according to GO terms and known function. (F) Enriched GO gene set representing lymphocyte-mediated immunity. (G) Enriched GO gene set representing T cell proliferation. Significance threshold or GSEA was set at FDR ≤ 0.01. M24 was excluded from DG, as RNA-Seq data were obtained from an autologous tumor cell line. n = 25. M22 was included in DG using data from the tumor biopsy used for manufacturing of the infusion product.

References

    1. Rosenberg SA, et al. Durable complete responses in heavily pretreated patients with metastatic melanoma using T-cell transfer immunotherapy. Clin Cancer Res. 2011;17(13):4550–4557. doi: 10.1158/1078-0432.CCR-11-0116. - DOI - PMC - PubMed
    1. Besser MJ, et al. Adoptive transfer of tumor-infiltrating lymphocytes in patients with metastatic melanoma: intent-to-treat analysis and efficacy after failure to prior immunotherapies. Clin Cancer Res. 2013;19(17):4792–4800. doi: 10.1158/1078-0432.CCR-13-0380. - DOI - PubMed
    1. Itzhaki O, et al. Establishment and large-scale expansion of minimally cultured “young” tumor infiltrating lymphocytes for adoptive transfer therapy. J Immunother. 2011;34(2):212–220. doi: 10.1097/CJI.0b013e318209c94c. - DOI - PubMed
    1. Andersen R, et al. Long-lasting complete responses in patients with metastatic melanoma after adoptive cell therapy with tumor-infiltrating lymphocytes and an attenuated IL-2 regimen. Clin Cancer Res. 2016;22(15):3734–3745. doi: 10.1158/1078-0432.CCR-15-1879. - DOI - PubMed
    1. Lauss M, et al. Mutational and putative neoantigen load predict clinical benefit of adoptive T cell therapy in melanoma. Nat Commun. 2017;8(1):1–10. doi: 10.1038/s41467-016-0009-6. - DOI - PMC - PubMed

Publication types

Substances

Associated data