. 2021 Dec 6;218(12):e20210639.
doi: 10.1084/jem.20210639. Epub 2021 Nov 23.

ACC1-expressing pathogenic T helper 2 cell populations facilitate lung and skin inflammation in mice

Affiliations

ACC1-expressing pathogenic T helper 2 cell populations facilitate lung and skin inflammation in mice

Takahiro Nakajima et al. J Exp Med. .

Abstract

T cells possess distinguishing effector functions and drive inflammatory disorders. We have previously identified IL-5-producing Th2 cells as the pathogenic population predominantly involved in the pathology of allergic inflammation. However, the cell-intrinsic signaling pathways that control the pathogenic Th2 cell function are still unclear. We herein report the high expression of acetyl-CoA carboxylase 1 (ACC1) in the pathogenic CD4+ T cell population in the lung and skin. The genetic deletion of CD4+ T cell-intrinsic ACC1 dampened eosinophilic and basophilic inflammation in the lung and skin by constraining IL-5 or IL-3 production. Mechanistically, ACC1-dependent fatty acid biosynthesis induces the pathogenic cytokine production of CD4+ T cells via metabolic reprogramming and the availability of acetyl-CoA for epigenetic regulation. We thus identified a distinct phenotype of the pathogenic T cell population in the lung and skin, and ACC1 was shown to be an essential regulator controlling the pathogenic function of these populations to promote type 2 inflammation.


Conflict of interest statement

Disclosures: The authors declare no competing interests exist.

Figures

None
Graphical abstract
Figure S1.
Figure S1.
Experimental protocol of memory Th2 cells and gating strategy of ST2hi IL-5–producing cells in vivo. (A) Experimental protocol for the generation of memory Th2 cell. (B) Intracellular staining profiles of IL-5 and IL-13 in restimulated polyclonal Tpath2 cells. The percentages of IL-5+ and IL-13+ cells are shown with SD. Cells were cultured with IL-2 or IL-2 plus IL-33 in complete medium for 5 d. (C and D) Intracellular staining profiles of IL-5 and IL-4 in restimulated antigen-specific Tpath2 cells (C) or polyclonal Tpath2 cells (D) treated with or without rapamycin (100 nM). The percentages of IL-4+ cells are shown with SD. Cells were cultured with IL-33 (B) or IL-2 and IL-33 (C) in complete medium for 5 d. (E) Intracellular staining profiles and gating strategy for flow cytometric analysis of lung cells that express ACC1 low, intermediate, and high cells. Intracellular staining profiles of IL-5 and ST2 in each population. The percentages of ST2hiIL-5+ cells are shown with SD. FSC, forward scatter; SSC, side scatter. (F) Representative intracellular staining profiles of ACC1 and IL-5 in restimulated lung lymphocytes isolated from untreated C57BL/6 mice or C57BL/6 mice administered IL-33 intranasally. (G) Heatmap visualization of expression profiles of genes involved in fatty acid biosynthesis in IL-2–cultured and IL-2 plus IL-33–cultured polyclonal Tpath2 cells treated with or without rapamycin. The Z-score scales ranging from blue to red are shown in the bottom right corner. For each group, n = 3 (D) or 4 (B, C, and E–G) biologically independent samples are shown. More than three independent experiments were performed with similar results for B–G. Mean values with SD are shown for B–E. An unpaired two-tailed Student’s t test was applied for B–E. Statistical significance (P values) is indicated as *, P < 0.05; **, P < 0.01; ****, P < 0.0001.
Figure 1.
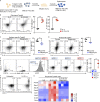
Figure 1.
ST2hi IL-5–producing Tpath2 cells express high levels of ACC1. (A) p4E-BP1 and pS6 in memory Th2 cells were analyzed by FACS. MFI, mean fluorescence intensity. (B and C) Intracellular staining profiles of IL-5 and IL-13 in antigen-specific Tpath2 cells (B) or polyclonal Tpath2 cells (C) treated with or without rapamycin (100 nM). (D and E) Quantitative RT-PCR analysis of Il5 and Il13 in antigen-specific Tpath2 cells (D) or polyclonal Tpath2 cells (E). (F) Representative intracellular staining profiles of IL-5 and ST2 in stimulated lung lymphocytes isolated from mice given IL-33 and expression of CD4 and TCRβ on the ST2hiIL-5+ population. (G) Expression of ACC1 in lung lymphocytes (three populations as shown in Fig. 1 F). (H and I) Heatmap visualization of expression profiles of genes involved in fatty acid biosynthesis in preculture, IL-2–cultured, and IL-33–cultured antigen-specific Tpath2 cells (H) or IL-2 plus IL-33–cultured antigen-specific Tpath2 cells treated with or without rapamycin (I). The Z-score scales ranging from blue to red are shown in the bottom right corner. For each group, n = 4 (A–C, E, H, and I); n = 5 (F and G); or n = 6 (D) biologically independent samples are shown. More than three independent experiments were performed with similar results (A–I). Mean values with SD are shown (A–E and G). An unpaired two-tailed Student’s t test was applied for A–E and G. Statistical significance (P values) is indicated as *, P < 0.05; **, P < 0.01; ***, P < 0.001; ****, P < 0.0001.
Figure 2.
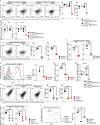
Figure 2.
ACC1 controls the development of ST2hi IL-5–producing pathogenic lymphocytes. (A) Intracellular staining profiles of IL-5 and IL-13 in ERT2-CreAcacafl/fl or ERT2-Cre+Acacafl/fl Tpath2 cells treated with or without 4-OHT (100 nM). (B) Quantitative RT-PCR analysis of Il5 and Il13 in ERT2-CreAcacafl/fl or ERT2-Cre+Acacafl/fl Tpath2 cells cultured as in A. (C) Intracellular staining profiles of IL-5 and IL-13 in antigen-specific Tpath2 cells treated with or without TOFA. (D) Quantitative RT-PCR analysis of Il5 and Il13 in antigen-specific Tpath2 cells cultured as in C. (E) Expression profiles of ST2 on antigen-specific Tpath2 cells treated with or without TOFA. (F) Quantitative RT-PCR analysis of Il1rl1 in antigen-specific Tpath2 cells treated with or without TOFA. (G) Quantitative RT-PCR analysis of Il1rl1 in ERT2-CreAcacafl/fl or ERT2-Cre+Acacafl/fl Tpath2 cells cultured as in A. (H) Intracellular staining profiles of IL-5 and IL-13 treated with TOFA or rapamycin. (I) Quantitative RT-PCR analysis of Il5 and Il13 in ILC2s treated with TOFA or rapamycin. (J) Expression profiles of ST2 on ILC2s treated with TOFA or rapamycin. The cells isolated from ERT2-CreAcacafl/fl or ERT2-Cre+Acacafl/fl mice were used for A, B, and G. For each group, n = 4 (A–C, E, and G–J) or n = 5 (D and F) biologically independent samples are shown. More than three independent experiments were performed with similar results (A–J). Mean values with SD are shown (A–J). An unpaired two-tailed Student’s t test was applied in A–J. Statistical significance (P values) is indicated as *, P < 0.05; **, P < 0.01; ***, P < 0.001; ****, P < 0.0001.
Figure S2.
Figure S2.
ACC1 controls the development of ST2hi IL-5–producing pathogenic lymphocytes. (A and D) Intracellular staining profiles of IL-5 and IL-13 (A) or IL-5 and IL-4 (D) in restimulated ERT2-CreAcacafl/fl or ERT2-Cre+Acacafl/fl polyclonal Tpath2 cells treated with or without 4-OHT. The percentages of IL-5+ and IL-13+ cells (A) or IL-4+ cells (D) are shown. (B) Quantitative RT-PCR analysis of Il5 and Il13 in ERT2-CreAcacafl/fl or ERT2-Cre+Acacafl/fl polyclonal Tpath2 cells treated with or without 4-OHT. (C) Intracellular staining profiles of IL-5 and IL-4 in restimulated ERT2-CreAcacafl/fl or ERT2-Cre+Acacafl/fl Tpath2 cells treated with or without 4-OHT. The percentages of IL-4+ cells are shown. (E) Intracellular staining profiles of IL-5 and IL-13 in restimulated polyclonal Tpath2 cells treated with TOFA or rapamycin. The percentages of IL-5+ and IL-13+ cells are shown. (F) Quantitative RT-PCR analysis of Il5 and Il13 in polyclonal Tpath2 cells treated with TOFA or rapamycin. (G) Expression profiles of ST2 on ERT2-CreAcacafl/fl or ERT2-Cre+Acacafl/fl polyclonal Tpath2 cells treated with 4-OHT or TOFA on day 5. The graph shows mean fluorescence intensity (MFI) ± SD values of ST2 in each group. (H) Quantitative RT-PCR analysis of Il1rl1 in ERT2-CreAcacafl/fl or ERT2-Cre+Acacafl/fl polyclonal Tpath2 cells treated with 4-OHT or TOFA. For each group, n = 4 biologically independent samples are shown (A–H). The cells isolated from ERT2-CreAcacafl/fl or ERT2-Cre+Acacafl/fl mice were used for A–D, G, and H. More than three independent experiments were performed with similar results for A–H. Mean values with SD are shown for A–H. An unpaired two-tailed Student’s t test was applied for A–H. Statistical significance (P values) is indicated as **, P < 0.01; ***, P < 0.001; ****, P < 0.0001.
Figure 3.
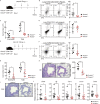
Figure 3.
Genetic deletion of CD4+ T cell–intrinsic ACC1 restrains Tpath2 cell responses and reduces airway inflammation in vivo. (A) Experimental protocol for papain-induced lung inflammation model. (B) Intracellular staining profiles of ST2 and IL-5 in lung TCRβ+CD4+CD44hi cells. The percentage of ST2hiIL-5+ cells is shown. (C) The absolute cell number of eosinophils and total cells in the BAL fluid collected from Acaca+/+ or Acaca−/− mice intranasally administered with papain. (D) Intracellular staining profiles of ST2 and IL-5 in lung CD44hiCD4 cells isolated from Acaca+/+ or Acaca−/− mice. (E) Experimental protocol for IL-33–induced lung inflammation model. (F) Intracellular staining profiles of ST2 and IL-5 in stimulated lung TCRβ+CD4+CD44hi cells. The percentage of ST2hiIL-5+ cells is shown. (G) The absolute cell number of eosinophils and total cells in the BAL fluid collected from Acaca+/+ or Acaca−/− mice intranasally administered with IL-33. (H) Lung tissue sections of mice administered with IL-33 were fixed and stained with H&E (HE). A representative staining pattern is shown. Scale bars in bottom right corner represent 100 µm. Number of infiltrated inflammatory cells in lung per high power field (HPF) is shown. (I) Lung tissue sections of mice administered with IL-33 were fixed and stained with PAS. A representative staining pattern is shown. Scale bars in bottom right corner represent 100 µm. (J) Quantitative RT-PCR analysis of Gob5, Il5, Ccl11, Ccl17, and Ccl21 in the lung tissues of Acaca+/+ or Acaca−/− mice intranasally administered with IL-33. For each group, n = 6–7 (B–D and F–H) or n = 9–10 (J) biologically independent samples are shown. More than three independent experiments were performed with similar results (B–D and F–J). Mean values with SD are shown for B–D, F–H, and J. An unpaired two-tailed Student’s t test was applied for B–D, F–H, and J. Statistical significance (P values) is indicated as *, P < 0.05; **, P < 0.01; ***, P < 0.001.
Figure 4.
Figure 4.
Genetic deletion of CD4+ T cell–intrinsic ACC1 reduces lung allergic inflammation in vivo. (A) Experimental protocol for OVA-induced lung inflammation model. (B) Intracellular staining profiles of ST2 and IL-5 lung TCRβ+CD4+CD44hi cells. The percentage of ST2hiIL-5+ cells is shown. (C) The absolute cell number of eosinophils and total cells in the BAL fluid collected from Acaca+/+ or Acaca−/− mice intranasally administered with OVA as in A. (D) Intracellular staining profiles of ST2 and IL-5 in lung CD44hiCD4 cells isolated from Acaca+/+ or Acaca−/− mice. (E) Lung tissue sections of mice administered with OVA were fixed and stained with H&E (HE). A representative staining pattern is shown. Scale bars in bottom right corner represent 100 µm. Number of infiltrated inflammatory cells in lung per high power field (HPF) is shown. (F) Lung tissue sections of mice administered with OVA were fixed and stained with PAS. A representative staining pattern is shown. Scale bars in bottom right corner represent 100 µm. (G) Quantitative RT-PCR analysis of Gob5, Il5, Ccl11, and Ccl17 in the lung tissues of Acaca+/+ or Acaca−/− mice intranasally administered with OVA. (H and I) Total serum IgE (H) or OVA-specific IgE (I) was tested using ELISA. For each group, n = 6 (B–D, H, and I) or n = 5 (E–G) biologically independent samples are shown. More than three independent experiments were performed with similar results for B–I. Mean values with SD are shown for B–E and G–I. An unpaired two-tailed Student’s t test was applied for B–E and G–I. Statistical significance (P values) is indicated as *, P < 0.05; **, P < 0.01; ***, P < 0.001.
Figure 5.
Figure 5.
ACC1 controls the production of common β cytokines, including IL-3 and GM-CSF, in memory Th2 cells. (A) Expression profile by RNA-seq of selected cytokine genes in IL-33–cultured ERT2-Cre+Acacafl/fl Tpath2 cells treated with or without 4-OHT. (B) Quantitative RT-PCR analysis of Il3 and Csf2 in IL-33–cultured ERT2-CreAcacafl/fl or ERT2-Cre+Acacafl/fl Tpath2 cells treated with or without 4-OHT. (C) Quantitative RT-PCR analysis of Il3 and Csf2 in IL-33–cultured antigen-specific Tpath2 cells treated with or without TOFA. (D) Intracellular staining profiles of IL-3 and GM-CSF in stimulated ERT2-CreAcacafl/fl or ERT2-Cre+Acacafl/fl polyclonal Tpath2 cells treated with or without 4-OHT. (E) Intracellular staining profiles of IL-3 and GM-CSF in stimulated lung CD44hiCD4+ T cells. The cells were collected from Acaca+/+ or Acaca−/− mice intranasally administered with papain. For each group, n = 2 (A); n = 4 (B–D); or n = 6 (E) biologically independent samples are shown. More than three independent experiments were performed with similar results for B–E. Mean values with SD are shown for B–E. An unpaired two-tailed Student’s t test was applied for B–E. Statistical significance (P values) is indicated as **, P < 0.01; ***, P < 0.001; ****, P < 0.0001.
Figure S3.
Figure S3.
ACC1 controls the production of common β cytokines, including IL-3 and GM-CSF, in memory Th2 cells. (A and B) Expression profile by RNA-seq of selected cytokine genes in Tpath2 cells. (C) Intracellular staining profiles of IL-3 and GM-CSF in restimulated polyclonal Tpath2 cells treated with or without TOFA. The percentages of IL-3+ cells or GM-CSF+ cells are shown with SD. For each group, n = 2 (A and B) or 4 (C) biologically independent samples are shown. More than three independent experiments were performed with similar results for C. Mean values with SD are shown for C. An unpaired two-tailed Student’s t test was applied for C. Statistical significance (P values) is indicated as ****, P < 0.0001.
Figure S4.
Figure S4.
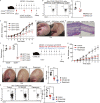
ACC1 controls MC903-induced skin inflammation via IL-3–mediated basophil activation. (A) Experimental protocol for MC903-induced skin inflammation model. 1 nmol MC903 in 10 µl EtOH was applied topically on both sides of ear (total 2 nmol/20 µl per ear). (B) Intracellular staining profiles of IL-3 and ACC1 in ear CD45+CD44hiCD4+ T cells. Histogram shows ACC1 expression of IL-3+ or IL-3 cells. Gray filled histogram indicates background, stained without primary antibody. (C) Intracellular staining profiles of IL-3 in ear CD45+CD44hiCD4+ T cells. The percentage of IL-3+ cells is shown. (D) Expression profiles of CD4 and CD44 on Acaca+/+ or Acaca−/− skin CD45+ cells. (E and F) Intracellular staining profiles of IL-5 in ear (E) or ear-dLN (F) CD45+CD44hiCD4+ T cells. The percentage of IL-5+ cells is shown. (G) The absolute number of skin basophils in Acaca+/+ or Acaca−/− mice. (H) Experimental protocol for MC903-induced skin inflammation model with subcutaneous injection of mIL-3/anti-mIL-3 mixture or PBS. IL-3 mixture or PBS administration was performed on days 1, 3, 6, and 8 (details of reagent in Materials and methods). (I) Intracellular staining profiles of IL-3 in ear dLN CD44hiCD4+ T cells. The percentage of IL-3+ cells is shown. (J) Confirmation of gene depletion in cells by tamoxifen-inducible and CD4-specific deletion of Acaca. PCR analysis indicates Acaca deletion in genomic DNA of ear CD45+ cells (ERT-Cre+ or ERT-Cre) and lymph-node CD4+ cells (as positive control). Representative data are shown. (K) Intracellular staining profiles of IL-3 in stimulated ear CD45+CD44hiCD4+ T cells. The percentage of IL-3+ cells is shown. For each group, n = 3–4 (C and G); 4 (I and J); 5–6 (D–F); or 6 (B and K) biologically independent samples are shown. More than three independent experiments were performed with similar results for B–G and I–K. An unpaired two-tailed Student’s t test was applied for B–G, I, and K. Mean values with SD are shown for B–G, I, and K. Statistical significance (P values) is indicated as *, P < 0.05; **, P < 0.01; ***, P < 0.001; N.S., not significant.
Figure 6.
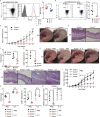
Figure 6.
ACC1 controls MC903-induced skin inflammation via IL-3–mediated basophil activation. (A) Intracellular staining profiles of IL-3 and ACC1 in stimulated ear-dLN CD44hiCD4+ T cells. Histogram shows ACC1 expression in IL-3+ or IL-3 cells. (B) Intracellular staining profiles of IL-3 in stimulated ear-dLN CD44hiCD4+ T cells. (C) Ear thickness of Acaca+/+ and Acaca−/− mice after daily MC903 treatment (2 nmol per ear). Values are differences in thickness from day 0. (D and E) Representative images of ears collected from Acaca+/+ or Acaca−/− mice topically treated with MC903 (D) and histological analysis of ear sections fixed and stained with H&E (HE; E). Scale bars represent 100 µm. (F) Clinical score of the ear skin based on the redness and swelling. (G) Expression of CD63 on ear-dLN basophils (CD45intCD200R3+CD49b+c-kit) of Acaca+/+ or Acaca−/− mice. (H and I) Representative images of ears collected from Acaca+/+ and Acaca−/− mice subcutaneously administered with mIL-3/anti-IL-3 or PBS to shoulders (H). Histological analysis of ear sections of mice fixed and stained with H&E (I). Scale bars represent 100 µm. (J) Ear thickness of Acaca+/+ and Acaca−/− mice subcutaneously injected with mIL-3/anti-IL-3 mixture or PBS, after daily MC903 treatment. Values are differences in thickness from day 0. P values indicated comparison with Acaca+/+ group administered PBS and Acaca+/+ or Acaca−/− group administered IL-3 mixture. (K) Clinical score of the ear skin based on redness and swelling. (L) Expression of CD63 on ear-dLN basophils (CD45intCD200R3+CD49b+c-kit) of Acaca+/+ and Acaca−/− mice subcutaneously injected with mIL-3/anti-IL-3 or PBS, after daily MC903 treatment. (M) Quantitative RT-PCR analysis of Cd203c in tissue section of ear, same condition as in L. For each group, n = 4 (B–E and J–M); n = 6 (A); n = 3–4 (G); or n = 4–5 (F) biologically independent samples are shown. More than three independent experiments were performed with similar results for A–M. Mean values with SD are shown for A–C, F–G, and J–M. Two-way ANOVA was applied for C and J. An unpaired two-tailed Student’s t test was applied for A, B, F, G, and K–M. Statistical significance (P values) is indicated as *, P < 0.05; **, P < 0.01; ***, P < 0.001; ****, P < 0.0001; N.S., not significant.
Figure 7.
Figure 7.
ACC1 deletion or inhibition to whole cells in ear region by topical treatment of 4-OHT or inhibitors reduces MC903-induced skin inflammation. (A) Experimental protocol for MC903-induced skin inflammation model with ERT2-CreAcacafl/fl or ERT-Cre+Acacafl/fl mice. (B) Intracellular staining profiles of IL-3 in ear CD45+CD44hiCD4+ T cells in 4-OHT–treated ERT-Cre+Acacafl/fl or ERT2-Cre mice. (C) Ear thickness of ERT-Cre+Acacafl/fl or ERT-Cre mice given 4-OHT or EtOH (vehicle) topically. Values are differences in thickness from day 0. Statistical significance indicates difference between ERT-Cre+Acacafl/fl with 4-OHT group and the others. Cont., control. (D and E) Representative images of ears of ERT-Cre+Acacafl/fl or ERT2-Cre mice given 4-OHT topically (D). Ear tissue sections of mice were fixed and stained with H&E (E). Scale bars represent 100 µm. (F) Clinical score of ear redness and scaling. (G) Experimental protocol for MC903-induced skin inflammation model treated with rapamycin or CP-640186. (H) Ear thickness of mice treated topically with rapamycin or CP-640186 versus control mice. Values are differences in thickness from day 0. Statistical significance indicates difference between rapamycin or CP-640186 group and control. (I) Representative images of ears of rapamycin- or CP-640186–treated mice with control. (J) Clinical score of rapamycin- or CP-640186–treated mice with control, assessed by ear redness and scaling. (K) Intracellular staining profiles of IL-3 in ear CD45+CD44hiCD4+ T cells in rapamycin- or CP-640186–treated mice. For each group, n = 4 (B–F) or n = 6 (H–K) biologically independent samples are shown. More than three independent experiments were performed with similar results for B–E and H–K. Mean values with SD are shown for B, C, F, H, J, and K. Two-way ANOVA was applied for C and H. An unpaired two-tailed Student’s t test was applied for B, F, J, and K. Statistical significance (P values) is indicated as *, P < 0.05; **, P < 0.01; ****, P < 0.0001.
Figure 8.
Figure 8.
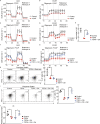
ACC1-dependent de novo fatty acid biosynthesis together with maximal glycolytic capacity controls IL-5–producing Tpath2 cells. (A) OCR of ERT2-Cre+Acacafl/fl Tpath2 cells treated with or without 4-OHT. FCCP, carbonyl cyanide 4-(trifluoromethoxy) phenylhydrazone. (B) ECAR of Tpath2 cells cultured as in A. (C) OCR of Tpath2 cells after 5-d cultivation with IL-33 plus TOFA or without TOFA. (D) ECAR of Tpath2 cells after 5-d cultivation with IL-33 plus TOFA or without TOFA. (E) The graph shows the number of Tpath2 cells after 5-d culture with TOFA in the presence or absence of OA (50 µM). (F) OCR of Tpath2 cells treated with TOFA in the presence or absence of OA as in E. (G) ECAR of Tpath2 cells cultured as in F. (H) Intracellular staining profiles of IL-5 in polyclonal Tpath2 cells treated with TOFA or TOFA plus OA (50 µM). (I) Intracellular staining profiles of IL-5 in polyclonal Tpath2 cells treated with TOFA in the presence or absence of OA (50 µM) and glucose (50 mM). (J) Quantitative RT-PCR analysis of Il5 in polyclonal Tpath2 cells cultured as in I. For each group, n = 3 (E–J); n = 4 (H); or n = 5–6 (A–D, F, and G) biologically independent samples are shown. The cells isolated from ERT-Cre+Acacafl/fl mice are used for A and B. More than three independent experiments were performed with similar results for A–J. Mean values with SD are shown for A–J. An unpaired two-tailed Student’s t test was applied for E and H–J. Statistical significance (P values) is indicated as *, P < 0.05; **, P < 0.01; ***, P < 0.001.
Figure S5.
Figure S5.
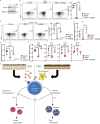
Acetate promotes chromatin accessibility at the Il3 locus in Acaca−/− Th2 cells. (A) Intracellular staining profiles of IL-5 and IL-3 in restimulated Th2 cells treated with TOFA in the presence or absence of OA (50 µM) and glucose (50 mM). The percentage of IL-3+ cells is shown with SD. (B) Schematic representation of the murine Il3 locus. The locations of primers and exons are indicated. (C) Intracellular staining profiles of IL-3 in restimulated Th2 cells treated with or without Curcumin (2.5 µM). The percentage of IL-3+ cells is shown with SD. (D) Intracellular staining profiles of IL-3 in restimulated Th2 cells treated with or without TSA (3 nM). The percentage of IL-3+ cells is shown with SD. (E) Upper left: IL-33 stimulation induces fatty acid biosynthesis via the mTORC1-ACC1 axis in IL-5–producing Tpath2 cells. Fatty acid biosynthesis and maximal glycolytic capacity control a large amount of IL-5 production and eosinophilic inflammation in the lung. OXPHOS, oxidative phosphorylation; TCA, tricarboxylic acid. Lower left: Fatty acid biosynthesis in Tpath2 cells is inhibited by genetic deletion or pharmacologic inhibition of ACC1. Blockade of de novo fatty acid biosynthesis reduced glycolysis, which resulted in a dramatic decrease of IL-5 production in Tpath2 cells. Upper right: Antigenic TCR stimulation induces fatty acid (FA) biosynthesis via the mTORC1-ACC1 axis in IL-3–producing Th2 cells. Active fatty acid biosynthesis properly regulates the availability of cellular Ac-CoA into histone acetylation and induces IL-3 production in Th2 cells. Lower right: Fatty acid biosynthesis is suppressed by genetic deletion or pharmacologic inhibition of ACC1 in Th2 cells. As a result, cellular Ac-CoA likely feeds into the cellular pool of metabolites in the tricarboxylic acid cycle, which may decrease the usage of Ac-CoA for chromatin acetylation. The reduction of histone acetylation levels at the Il3 gene locus in Acaca−/− or TOFA-treated Th2 cells strongly decreases transcription and production of IL-3. For each group, n = 4 biologically independent samples are shown (A, C, and D). More than three independent experiments were performed with similar results for A, C, and D. Mean values with SD are shown for A, C, and D. An unpaired two-tailed Student’s t test was applied for A, C, and D. Statistical significance (P values) is indicated as ****, P < 0.0001.
Figure 9.
Figure 9.
Acetate promotes chromatin accessibility at the Il3 locus in Acaca−/− Th2 cells. (A) Western blot analysis of acetylated histone H3K9 and total histone H3 in Th2 cells treated with or without TOFA (C control; T, TOFA). (B) Intracellular staining profiles of IL-3 in restimulated Th2 cells treated with TOFA in the presence or absence of acetate (5 mM). (C) Intracellular staining profiles of IL-3 in restimulated Acaca−/− Th2 cells treated with acetate (5 mM). Acaca−/− Th2 cells were differentiated from CD4-Cre+Acacafl/fl mouse–derived naive CD4 T cells. (D) Quantitative RT-PCR analysis of Il3 in Th2 cells cultured as in B. (E) Quantitative RT-PCR analysis of Il3 in Acaca−/− Th2 cells cultured as in C. (F) ChIP assays were performed with anti-acetyl histone H3-K9 at the Il3 locus from Th2 cells. The intensities of these modifications relative to input DNA were determined by quantitative RT-PCR analysis. (G) Schematic diagram of ACC1hi Tpath2 cell–induced airway inflammation and skin inflammation. For each group, n = 2 (A) or n = 4 (B–F) biologically independent samples are shown. More than three independent experiments were performed with similar results for A–F. Mean values with SD are shown for B–F. An unpaired two-tailed Student’s t test was applied for B–F. Statistical significance (P values) is indicated as *, P < 0.05; **, P < 0.01; ***, P < 0.001; ****, P < 0.0001; N.S., not significant.

References

    1. Aleman, F., Lim H.F., and Nair P.. 2016. Eosinophilic Endotype of Asthma. Immunol. Allergy Clin. North Am. 36:559–568. 10.1016/j.iac.2016.03.006 - DOI - PubMed
    1. Angela, M., Endo Y., Asou H.K., Yamamoto T., Tumes D.J., Tokuyama H., Yokote K., and Nakayama T.. 2016. Fatty acid metabolic reprogramming via mTOR-mediated inductions of PPARγ directs early activation of T cells. Nat. Commun. 7:13683. 10.1038/ncomms13683 - DOI - PMC - PubMed
    1. Berod, L., Friedrich C., Nandan A., Freitag J., Hagemann S., Harmrolfs K., Sandouk A., Hesse C., Castro C.N., Bähre H., et al. . 2014. De novo fatty acid synthesis controls the fate between regulatory T and T helper 17 cells. Nat. Med. 20:1327–1333. 10.1038/nm.3704 - DOI - PubMed
    1. Brandt, E.B., and Sivaprasad U.. 2011. Th2 Cytokines and Atopic Dermatitis. J. Clin. Cell. Immunol. 2:110. 10.4172/2155-9899.1000110 - DOI - PMC - PubMed
    1. Broughton, S.E., Dhagat U., Hercus T.R., Nero T.L., Grimbaldeston M.A., Bonder C.S., Lopez A.F., and Parker M.W.. 2012. The GM-CSF/IL-3/IL-5 cytokine receptor family: from ligand recognition to initiation of signaling. Immunol. Rev. 250:277–302. 10.1111/j.1600-065X.2012.01164.x - DOI - PubMed

Publication types

MeSH terms