. 2021 Dec 9;184(25):6174-6192.e32.
doi: 10.1016/j.cell.2021.10.022. Epub 2021 Nov 4.

Xist nucleates local protein gradients to propagate silencing across the X chromosome

Affiliations

Xist nucleates local protein gradients to propagate silencing across the X chromosome

Yolanda Markaki et al. Cell. .

Erratum in

Abstract

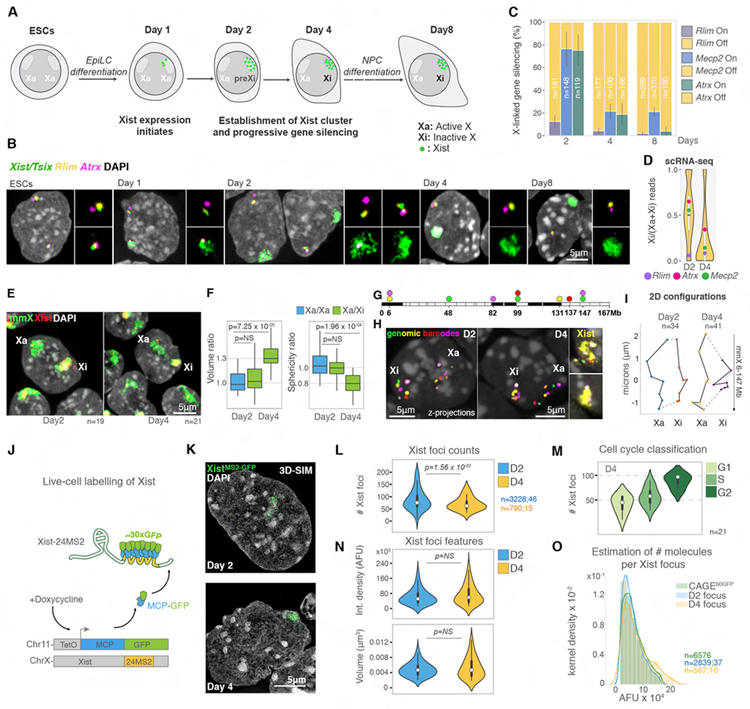
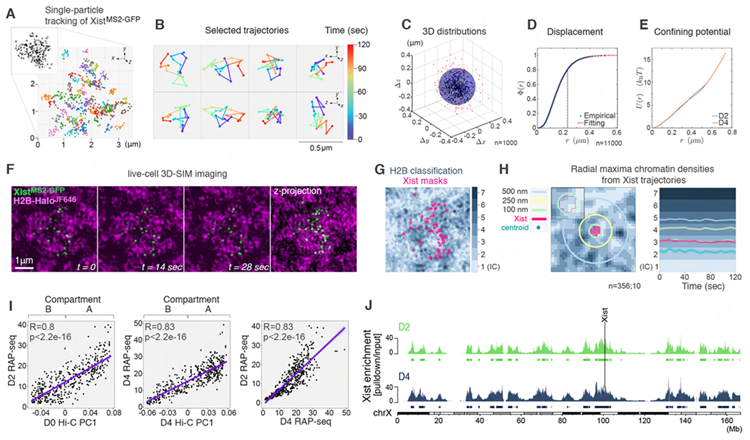
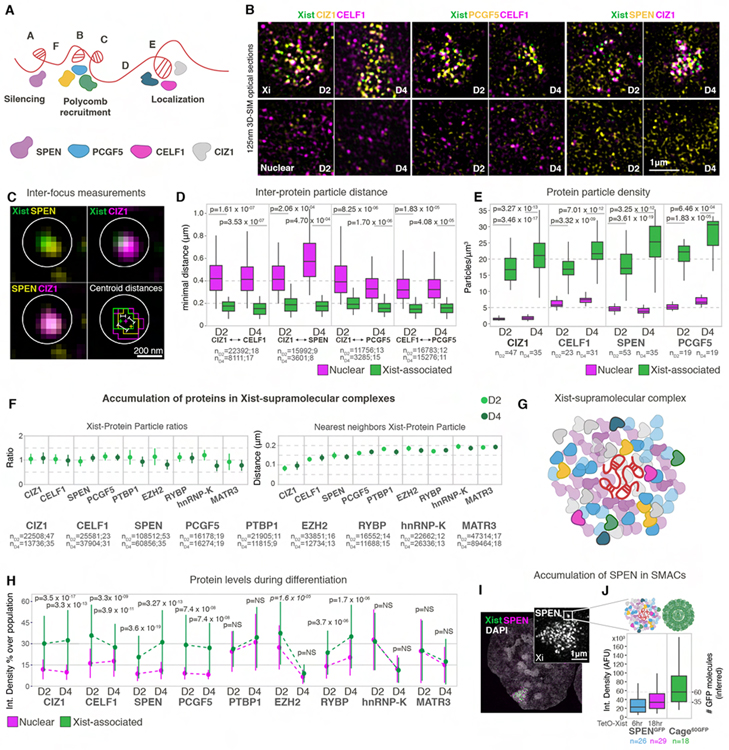
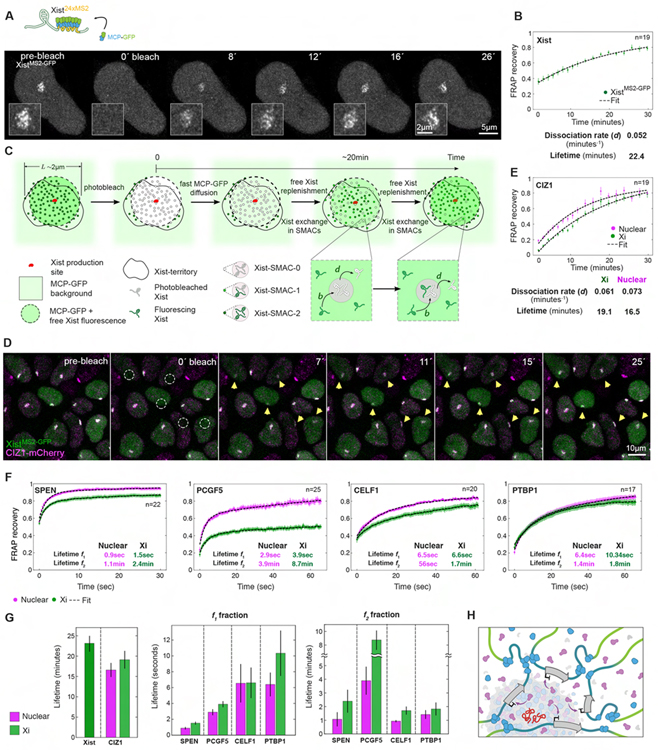
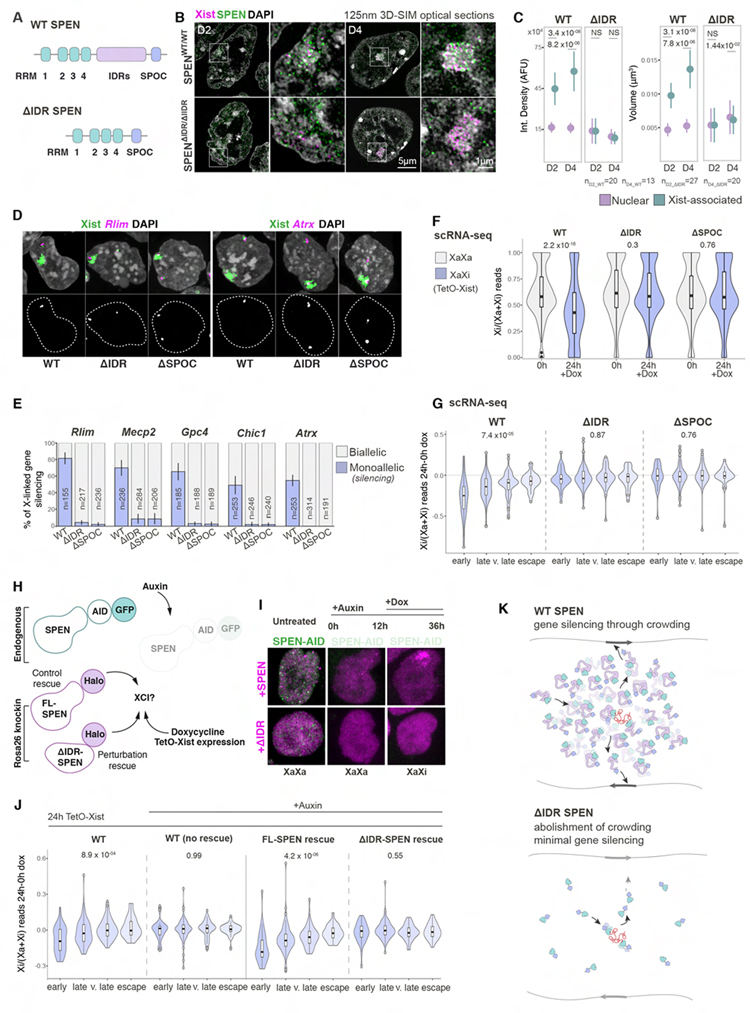
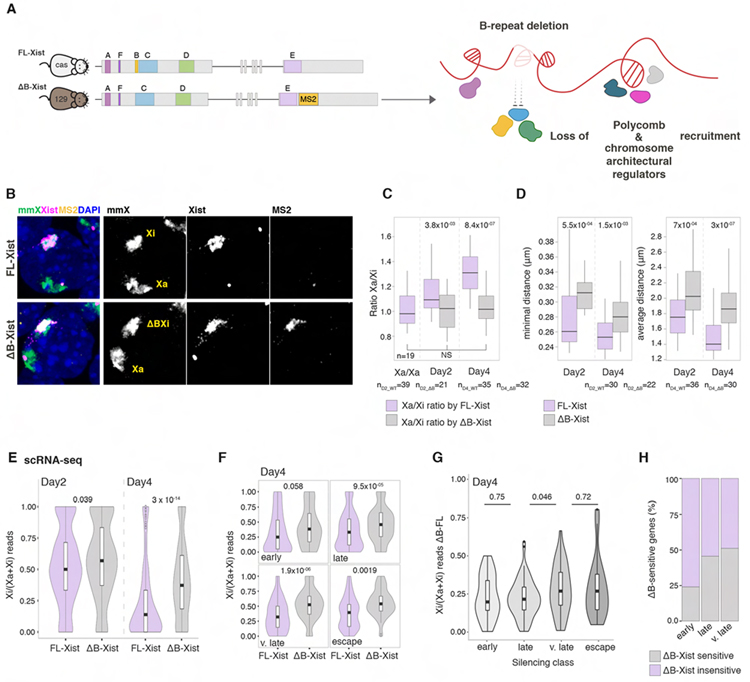
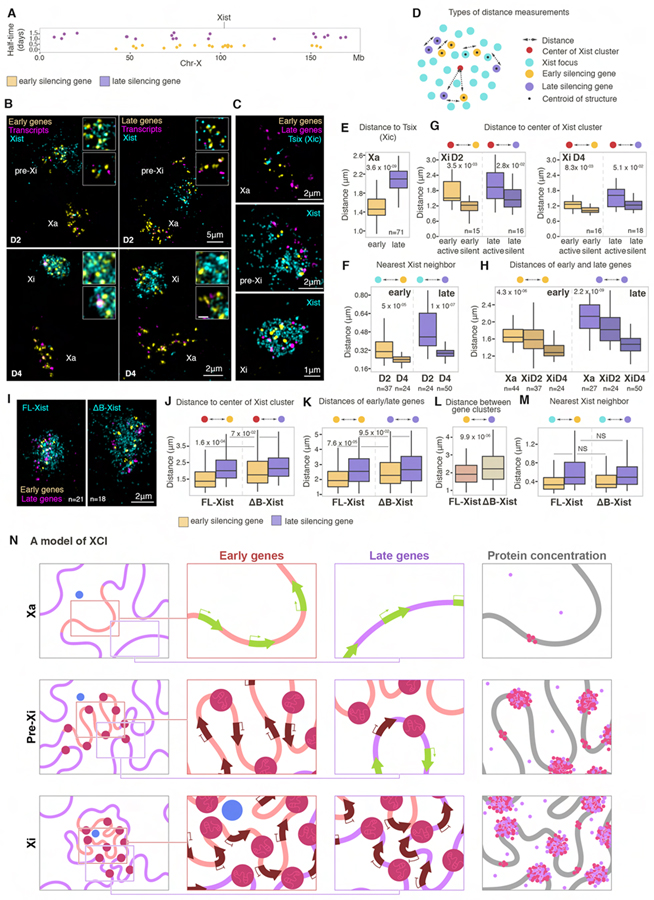
The lncRNA Xist forms ∼50 diffraction-limited foci to transcriptionally silence one X chromosome. How this small number of RNA foci and interacting proteins regulate a much larger number of X-linked genes is unknown. We show that Xist foci are locally confined, contain ∼2 RNA molecules, and nucleate supramolecular complexes (SMACs) that include many copies of the critical silencing protein SPEN. Aggregation and exchange of SMAC proteins generate local protein gradients that regulate broad, proximal chromatin regions. Partitioning of numerous SPEN molecules into SMACs is mediated by their intrinsically disordered regions and essential for transcriptional repression. Polycomb deposition via SMACs induces chromatin compaction and the increase in SMACs density around genes, which propagates silencing across the X chromosome. Our findings introduce a mechanism for functional nuclear compartmentalization whereby crowding of transcriptional and architectural regulators enables the silencing of many target genes by few RNA molecules.

Keywords: RNA-binding proteins; X chromosome inactivation; Xist RNA; biomolecular condensates; chromatin organization; heterochromatin; macromolecular dynamics; quantitative imaging; super-resolution microscopy; supramolecular complexes.


Conflict of interest statement

Declaration of interests K.P. is a member of Cell’s advisory board. The authors have a patent pending related to this work.

Figures

Figure 1:
Figure 1:. ~50 Xist foci initiate XCI
(A) Schematic of the ESC differentiation protocol. (B) RNA FISH for Xist/Tsix (green), Rlim (yellow) and Atrx (magenta) transcripts during differentiation. DAPI staining is shown in grey. Small images show magnifications of the Tsix signals on the Xa or the Xist signals on the Xi and nascent gene transcripts. (C) Percentage of cells with given nascent transcripts of Rlim, Atrx and Mecp2 under Xist clouds during differentiation from two replicates. Error bars denote standard deviation; n is the number of cells analyzed. (D) Violin plots of the Xi expression ratios of X-linked genes averaged across single cells expressing Xist from the 129 allele at D2 and D4. The ratios of Rlim, Atrx and Mecp2 are highlighted. (E) DNA/RNA FISH with X-chromosome paints (mmX, green) and Xist probes (red) of cells at D2 and D4. DAPI is shown in grey. n is the number of cells analyzed in F. (F) Boxplots showing the volume and sphericity ratio of Xa/Xa (blue) in cells not expressing Xist at D2 and Xa/Xi (green) in cells with an Xist cloud at D2 and D4. MannWhitney-Wilcoxon (MWW) p-values are given. (G) Schematic of the spectral barcoding strategy applied to map X chromosome configuration. (H) DNA FISH of the spectrally barcoded genomic regions described in G. Overlay with Xist RNA FISH signals (far right, yellow) was used to score for the Xi at D2 (top) and D4 (bottom). (I) 2D configuration plots of average coordinates of genomic barcodes from H, extracted with 95% confidence. n is the number of cells analyzed from three experiments. (J) Illustration of live-cell Xist labelling strategy. (K) 3D-SIM projections showing XistMS2-GFP signals (green) and DAPI staining (grey) at the indicated differentiation day. (L) Violin plots of the 3D-SIM quantification of XistMS2-GFP foci number at D2 and D4. n denotes the number of Xist foci measured, followed by the number of cells analyzed from two replicates. MWW p-value is given. (M) As in L at D4 after scoring for cell cycle stages. (N) As in L, except for showing integrated density (AFU) and volume (μm3) of XistMS2-GFP foci at D2 and D4 for the same sets of foci. (O) Histograms depicting integrated density (AFU) of XistMS2-GFP foci (~30 GFP molecules per Xist) and GFP nanocages (cage60GFP) per pixel kernel density, detected by 3D-SIM. n denotes the number of foci measured followed by the number of cells analyzed from two replicates.
Figure 2.
Figure 2.. Xist foci are locally confined at open chromatin regions
(A) Trajectories of XistMS2-GFP foci from live-cell 3D-SIM imaging for 2 minutes (5sec/frame) at D4. Inset: Projection of one frame showing an XistMS2-GFP cluster. (B) Selected trajectories from A showing the displacement of Xist foci over time (color-gradient) in top (xyz, top) and side (zyx, bottom) views. (C) D4 Xist foci displacements derived from ~100 trajectories, each centered about their centers of mass. n denotes the number of foci analyzed from four experiments. (D) Cumulative distribution function Φ(r) of the number of displacement positions at D4 with distance from origin <r. The distance marked with the dashed line at r=0.22μm corresponds to the radius of the shaded sphere in C where ~80% of all distances lie (Methods S1 file). n denotes the number of foci analyzed from ~800 trajectories from four experiments. (E) Effective spherically symmetric confining potential inferred from the spatial distribution of displacement distances of Xist foci at D2 and D4. We assume an equilibrium Boltzmann distribution over an effective potential energy well that is a function of r. (F) Image sequence from t=0 to t=28sec and z-projection (from t=0) of XistMS2-GFP (green) and H2B-HaloJF646 (magenta) based on live-cell 3D-SIM. (G) Segmentation of H2B-HaloJF646 from live-cell 3D-SIM data into seven density classes with overlay of Xist masks. (H) Left: Schematic for the assessment of the chromatin landscape around one Xist focus. Mask (bright pink) of one Xist focus showing radial distances denoted by circles from its centroid (dark green). Inset: magnification showing the outline of the Xist mask. Right: Plot of Xist foci trajectories showing the average radial maxima of chromatin density reached at indicated timepoints. Light shaded areas show 95% confidence interval. n denotes the number of foci and cells analyzed from three experiments. (I) Correlation of Xist enrichment determined by RAP-seq at D2 and D4 to the first principal component of ESC (D0) and D4 Hi-C data (A-compartment = positive values, B-compartment = negative values). Far right panel shows the correlation between D2 and D4 Xist RAP-seq data. Pearson correlation r-coefficients and associated p-values are given. (J) Xist enrichment along the X chromosome, defined based on RAP-seq data for Xist over the input, at D2 and D4, with peak calls below. The Xist locus is indicated.
Figure 3.
Figure 3.. Xist nucleates supramolecular complexes
(A) Schematic of Xist RNA with its repeat sequences A-F, different repeat-binding proteins, and repeat functions. Proteins examined in B are indicated. (B) 125nm 3D-SIM optical sections showing detection of indicated Halo protein-fusions labelled with JF549 (yellow) and immunodected proteins (magenta) in XistMS2-GFP cells at D2 and D4. Top panels show the Xist-demarcated X-territory (pre-Xi/Xi); bottom panels a nuclear region (Nuclear). Note the distinctive enrichment of all pairs of interactors around Xist foci. (C) Overview of inter-protein particle distance measurements for protein foci associated with one Xist focus, based on data in B. Overlay: Xist (green), SPEN (yellow) and CIZ1 (magenta). Bottom right panel shows mask outlines after image segmentation, depiction of protein and Xist foci centroids (crosses) and measurement of inter-particle distances performed in D. Circles denote a 200nm radius. (D) Boxplots from data in B showing the nearest-neighbor distances between the indicated pairs of protein particles in nuclear and Xist-associated fractions obtained as shown in C for D2 and D4. n denotes the number of protein particles followed by the number of cells analyzed. MWW p-values are given. (E) Boxplots of the distribution of the density of indicated protein particles (number of particles per μm3) in the Xi and in nuclear regions on D2 and D4. n denotes the number of cells analyzed. MWW p-values are given. (F) Point-plots showing the average ratio of the number of indicated protein particles per Xist particle within 250nm radial search (left) and their nearest distance (right) on D2 and D4. The bars denote the standard deviation and n the number of particles followed by number of cells analyzed. (G) Schematic of a Xist-supramolecular complex. (H) Point-plots from data in F showing the integrated density of fluorescence of indicated protein particles in Xist-associated (green) and nuclear (magenta) fractions, on D2 and D4 from two experiments. Dots denote the median, bars the standard deviation. Dotted lines are included to visualize changes. Data are normalized to the highest signal observed across the entire population of each protein. Absolute values are shown in Figure S4E. MWW p-values are given. (I) Projection of a nucleus imaged with 3D-SIM expressing SPEN-GFP from the endogenous locus (magenta) and Xist-Bgl-mCherry (green) at 18hrs post tetO-Xist induction. Inset shows SPEN signals in the Xi. (J) Boxplots showing integrated densities of cages60GFP, Xist-associated SPEN at 6 or 18hrs after tetO-Xist induction. n denotes the number of cells analyzed from two replicates.
Figure 4.
Figure 4.. FRAP of Xist interactors identifies diverse protein behaviors in the Xi
(A) Top: Schematic of Xist live-cell labeling. Bottom: Image sequence from an Airyscan FRAP experiment of XistMS2-GFP at D4. Insets show the Xist territory. (B) XistMS2-GFP FRAP recovery at D4 and fitting. Error bars indicate the standard error. Dissociation rate and lifetime inferred from fitting are given. n denotes the number of cells analyzed from four experiments. (C) Model for the Xist FRAP process. The expression and replenishment of Xist from its expression site is assumed to be fast and free MCP-GFP replenishment is assumed almost instantaneous after t=0. The exchange of photobleached with fluorescing Xist is assumed fast in the Xi-territory outside Xist-SMACs (free pool) and slow within XistSMACs. Xist-SMACs with zero, one, and two fluorescing Xist molecules are denoted Xist-SMAC-0, −1, and −2. Binding of Xist to sites in SMACs occurs at rate b and dissociation at rate d, which sets the timescale for FRAP recovery. The FRAP curves for Xist were fit with a single exponential. (D) Image sequence showing a FRAP experiment of XistMS2-GFP (green) and CIZ1-mCherry (magenta) at D4. Dashed circles indicate bleached Xist-territories and yellow arrows monitor recovery. (E) FRAP recovery and fitting (dashed black lines) of the nuclear and Xist-associated populations of CIZ1-mCherry. Error bars denote the standard error. Parameters from fitting with a single exponential are given. n denotes the number of cells analyzed from four experiments. (F) FRAP recovery and fitting (dashed black lines) of the nuclear and Xist-associated populations of SPEN-HaloTMR, PCGF5-HaloTMR, CELF1-mCherry and PTBP1-HaloTMR at D4. Error bars denote the standard error. Every fifth timepoint is shown. Lifetimes for the slow (f1) and fast (f2) detaching fractions inferred for each protein from bi-exponential fitting are indicated. n denotes the number of cells analyzed from two experiments. (G) Bargraphs showing the lifetimes for Xist and CIZ1 (left) and for the two subpopulations (f1, f2) of bi-exponentially fitted proteins (right). Error bars denote the standard error. (H) Schematic showing an Xist-SMAC and its dynamic regulatory compartment. The increased accumulation of proteins surrounding Xist (red) and their rapid cycling results in gradients over broad chromosomal regions in the vicinity to the SMAC. SPEN is depicted in purple, accumulation of PCGF5 in blue, and purple arrows indicate the gene silencing function of SPEN.
Figure 5.
Figure 5.. IDR-mediated crowding of SPEN in SMACs is required for gene silencing
(A) Schematic of the domains of WT and ΔIDR SPEN. (B) 3D-SIM optical sections of immuno-RNA-FISH with Xist probes (magenta) and GFP antibodies (green) at D2 and D4 in cells homozygously expressing GFP-tagged WT- or ΔIDR-SPEN. Second columns show the Xi. Staining by DAPI is shown in grey. (C) Point-plots of integrated density and volume measurements for WT- and ΔIDR-SPEN particles that are Xist-associated (green) or in the nuclear (purple) fraction, on D2 and D4 from B. n denotes the number of cells analyzed from two experiments. MWW p-values are given. (D) RNA FISH of Xist (green) and nascent transcripts of Rlim or Atrx (magenta) at 24hrs after doxycycline induction of tetO-Xist expression in female Xistwt/tetO cells homozygously expressing WT-, ΔIDR- and ΔSPOC-SPEN. Chromatin is stained with DAPI (grey). Second row images show Rlim or Atrx signals (grey) and nuclei masks (dashed lines). (E) Quantification of experiment in D showing percentage of Xist clouds with a nascent transcript spot (purple, monoallelic) versus no transcripts (grey, biallelic). n denotes the number of cells analyzed from two replicates. (F) Violin plots of Xi expression ratios of X-linked genes averaged across single Xistwt/tetO cells homozygously expressing WT-, ΔIDR- or ΔSPOC-SPEN without and with 24 hours of doxycycline addition. MWW p-values are given. (G) Violin plots of the change in Xi expression ratio for data in F, grouped according to gene silencing dynamics in normal cells. Kruskal-Wallis p-values are given. (H) Schematic of rescue assay used in I and J. SPEN-AID-GFP encoded from the endogenous locus is depleted with addition of auxin for 12hrs and FL- or ΔIDR-SPEN-Halo are constitutively expressed from the R26 locus. Xist expression and XCI are induced by addition of doxycycline for 24hrs in the presence of auxin. (I) Images of SPEN-AID-GFP (green) with transgenic FL-SPEN (top) and ΔIDR-SPEN (bottom) rescue proteins (magenta). Columns from left to right: untreated; 12hrs auxin treated; and 24hrs doxycycline and 36hrs auxin treated cells. This strategy was used in J to explore rescue of XCI by transgenically encoded SPEN proteins after depletion of endogenously encoded SPEN and induction of tetO-Xist. (J) Violin plots of the change in Xi expression ratios of X-linked genes over 24hrs of doxycycline-induced Xist expression, grouped according to gene silencing dynamics in normal cells, for conditions described in H. The Xi ratio was averaged across 3 replicates. Kruskal-Wallis p-values are given. (K) Model of the augmented and dynamic distribution of WT-SPEN (top) in a Xist-SMAC compared to ΔIDR-SPEN (bottom). Xist is shown in red and SPEN domains are annotated as in A. Silent and active X-linked genes are indicated with black and grey arrows.
Figure 6.
Figure 6.. The B-repeat is critical for Xi compaction and late gene silencing
(A) Schematic of the heterozygous deletion of the B-repeat of Xist and insertion of a MS2 tag on the 129 X chromosome in female mouse 129/cas ESCs (XistΔΒ+MS2/WT ESCs). The effect of the B-repeat deletion is indicated. (B) RNA/DNA FISH of XistΔΒ+MS2/WT cells at D4 using X-chromosome paints (mmX, green), Xist (magenta) and MS2 probes (yellow). DAPI staining is shown in blue. Greyscale images show individual channels as indicated. (C) Boxplots showing the ratio of Xa/Xa at D2 in cells not expressing Xist and of Xa/Xi in FL-Xist (purple) or ΔB-Xist (grey) expressing XistΔΒ+MS2/WT cells at D2 and D4. n is the number of cells analyzed from two replicates. (D) Boxplots showing the minimal (left) and average (right) distance between Xist foci in FL- or ΔB-Xist expressing cells at D2 and D4. n is the number of cells analyzed from three experiments. (E) Violin plots of Xi ratios of X-linked gene expression at D2 and D4 in XistΔΒ+MS2/WT cells or parent WT (XistWT-MS2/WT) cells silencing the WT- or ΔB-Xist 129 X chromosome. Mean Xi ratio per gene was averaged across single cells based on scRNA-seq data. MWW p-values are given. (F) As in E, except that genes are grouped by gene silencing dynamics. MWW p-values are given. (G) Violin plots of the difference in Xi ratio between the ΔB- and WT-Xist expressing Xi shown in F. MWW p-values are given. (H) Bargraphs showing the proportion of ΔB-sensitive or insensitive genes from F. Genes were considered ΔB-sensitive based on a one-sided Welch t-test comparing ΔB and WT Xi129 ratios, p-value<0.05.
Figure 7.
Figure 7.. Xist-SMACs progressively re-configure and silence the Xi
(A) Annotation of the position of early (yellow) and late (purple) genes on the X chromosome simultaneously detected with oligo probes in RNA/DNA FISH experiments and their silencing half-time. (B) 3D-SIM projections of nuclei after RNA/DNA FISH, showing indicated gene sets (yellow), their corresponding transcripts (magenta), and Xist signals (cyan) at D2 and D4. Xa, pre-Xi and Xi are indicated. Insets show magnifications of pre-Xi or Xi areas with high (top) and low (bottom) Xist density. Images are smoothed with a 3×3 px for clarity. (C) 3D-SIM projections of Xa, pre-Xi or Xi regions after RNA/DNA FISH for Xist (cyan), early (yellow) and late (magenta) genes at D2 and D4. (D) Schematic of different types of distance metrics performed in this figure. (E) Boxplots of distances of early (yellow) or late (purple) genes relative to Tsix signals on the Xa. n denotes the number of cells analyzed from three experiments. MWW p-value is given. (F) Boxplots of the nearest distance of Xist foci to early (yellow) or late (purple) genes at D2 and D4. n denotes the number of cells analyzed from three experiments. MWW p-values are given. (G) Boxplots of distances of early (yellow) or late (purple) genes to the center of the Xist cluster at D2 and D4, divided into silent or active based on nascent transcripts detection. n is the number of cells analyzed from three experiments. MWW p-values are given. (H) Intra-genic distances of early (yellow) or late (purple) genes on the Xa, pre-Xi, or Xi at D2 and D4. n denotes the number of cells analyzed from three experiments. Kruskal-Wallis p-values are given. (I) 3D-SIM projections of the Xi after RNA/DNA FISH for Xist (cyan), early (yellow) and late (magenta) genes in male FL- or ΔΒ-Xist expressing ESCs after 18hrs doxycycline induction of tetO-Xist. n denotes the number of cells analyzed in J to M from two experiments. MWW p-values are given. (J) Boxplots of distances of early (yellow) or late (purple) genes to the center of the Xist cluster in FL- or ΔΒ-Xist expressing cells described in I. (K) As in J, except for intra-genic distances of early (yellow) or late (purple) genes. (L) As in J, except for the distances of early to late silencing genes. (M) As in J, except for nearest neighbor distance of early (yellow) or late (purple) genes to Xist foci. (N) SMAC-based model of XCI. Left column shows the changes in the higher-order chromatin organization between the Xa (top), pre-Xi (middle) and Xi (bottom). The Xist production site is shown in blue, SMACs in dark red, and genomic regions harboring early and late silencing genes with orange and purple lines, respectively. Insets indicate regions of early (top) or late (bottom) silencing genes magnified in the second and third columns to show the progression of silencing. Arrows indicate active (green) and silent (brown) genes. Fourth column shows the increase in protein concentration upon establishment of Xist-SMACs. Pink dots indicate Polycomb-group proteins and purple dots SPEN. Free protein dots indicate increased concentrations in the Xi due to the presence of SMACs. Architectural protein-mediated chromosomal compaction is depicted by pink islets on the DNA fiber.

Comment in

  • Xist seeds X inactivation.
    Wang J. Wang J. Nat Cell Biol. 2021 Dec;23(12):1215. doi: 10.1038/s41556-021-00816-5. Nat Cell Biol. 2021. PMID: 34876690 No abstract available.

References

    1. Almeida M, Pintacuda G, Masui O, Koseki Y, Gdula M, Cerase A, Brown D, Mould A, Innocent C, Nakayama M, et al. (2017). PCGF3/5-PRC1 initiates Polycomb recruitment in X chromosome inactivation. Science 356, 1081–1084. - PMC - PubMed
    1. Banani SF, Lee HO, Hyman AA, and Rosen MK (2017). Biomolecular condensates: organizers of cellular biochemistry. Nat Rev Mol Cell Biol 18, 285–298. - PMC - PubMed
    1. Barros de Andrade ESL, Jonkers I, Syx L, Dunkel I, Chaumeil J, Picard C, Foret B, Chen CJ, Lis JT, Heard E, et al. (2019). Kinetics of Xist-induced gene silencing can be predicted from combinations of epigenetic and genomic features. Genome Res 29, 1087–1099. - PMC - PubMed
    1. Beard C, Hochedlinger K, Plath K, Wutz A, and Jaenisch R (2006). Efficient method to generate single-copy transgenic mice by site-specific integration in embryonic stem cells. Genesis 44, 23–28. - PubMed
    1. Berg BA, and Harris RC (2008). From data to probability densities without histograms. Computer Physics Communications 179, 443–448.

Publication types