. 2022 Jan 4;34(1):75-89.e8.
doi: 10.1016/j.cmet.2021.11.002. Epub 2021 Nov 22.

Targeting p21Cip1 highly expressing cells in adipose tissue alleviates insulin resistance in obesity

Affiliations

Targeting p21Cip1 highly expressing cells in adipose tissue alleviates insulin resistance in obesity

Lichao Wang et al. Cell Metab. .

Erratum in

Abstract

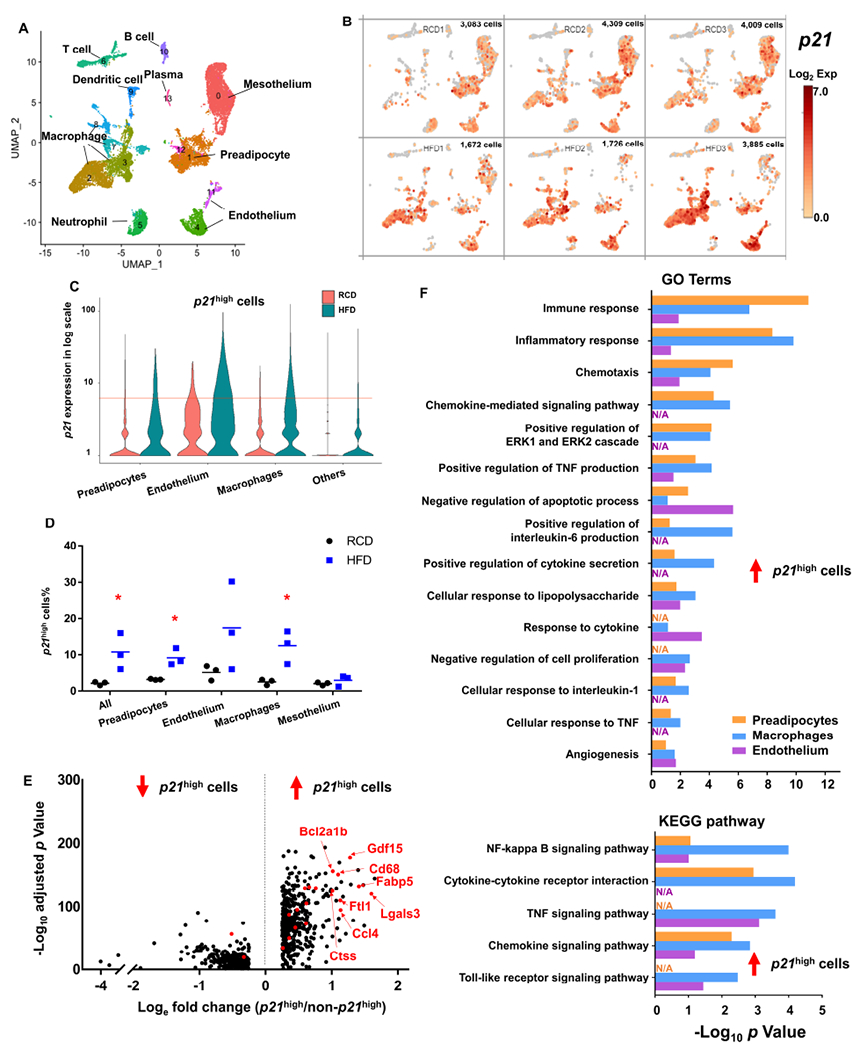
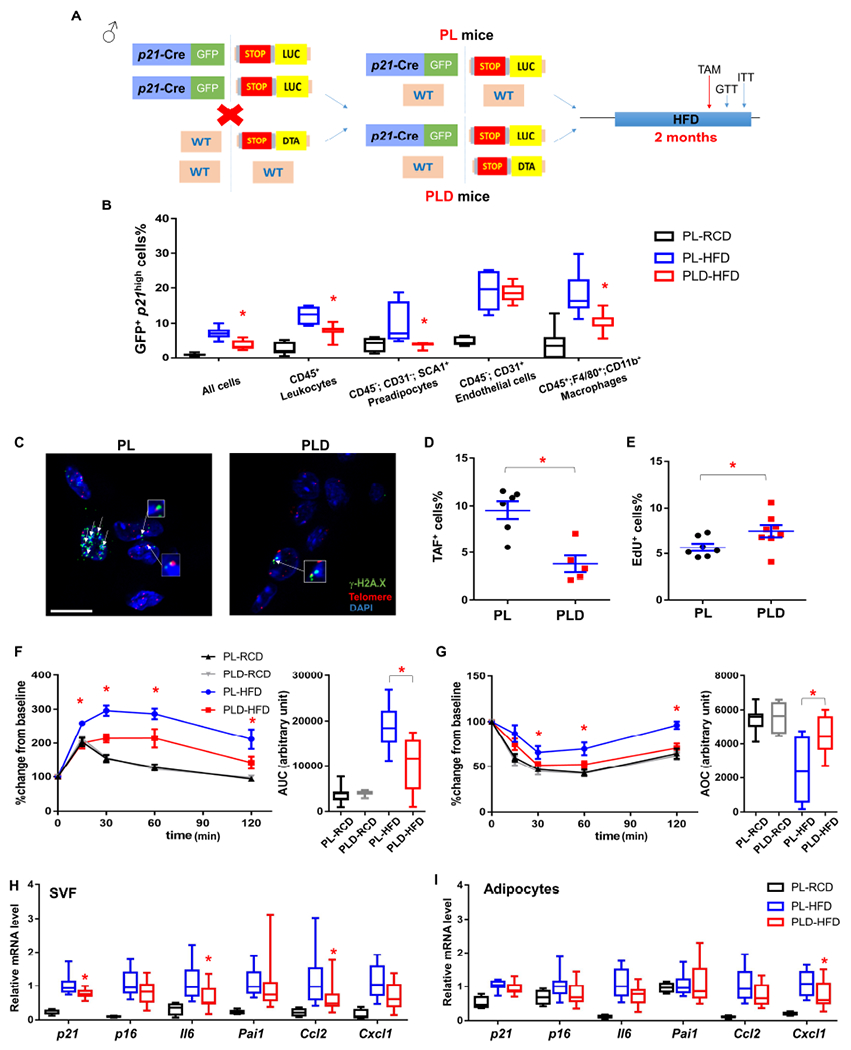
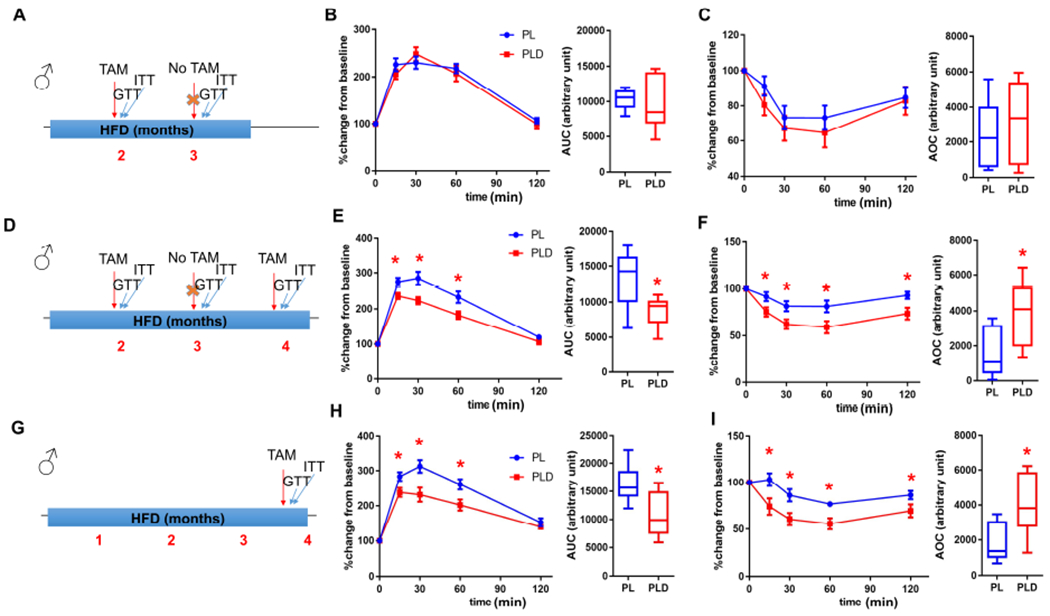
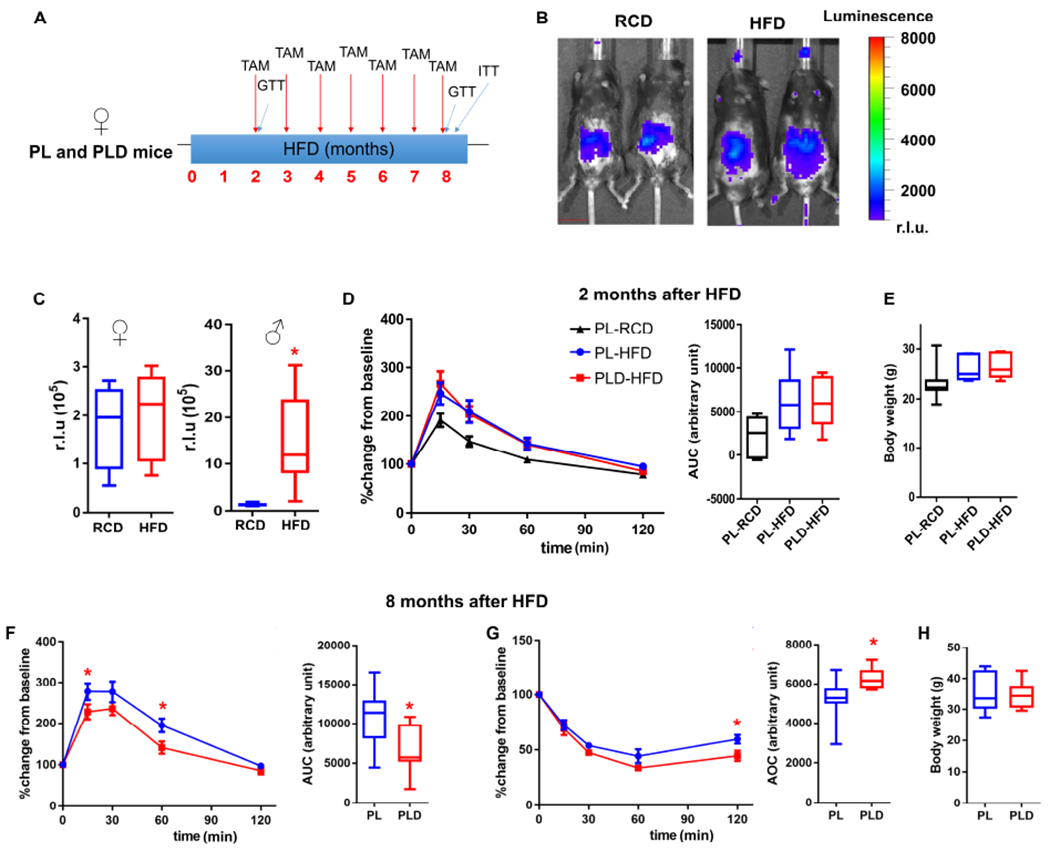
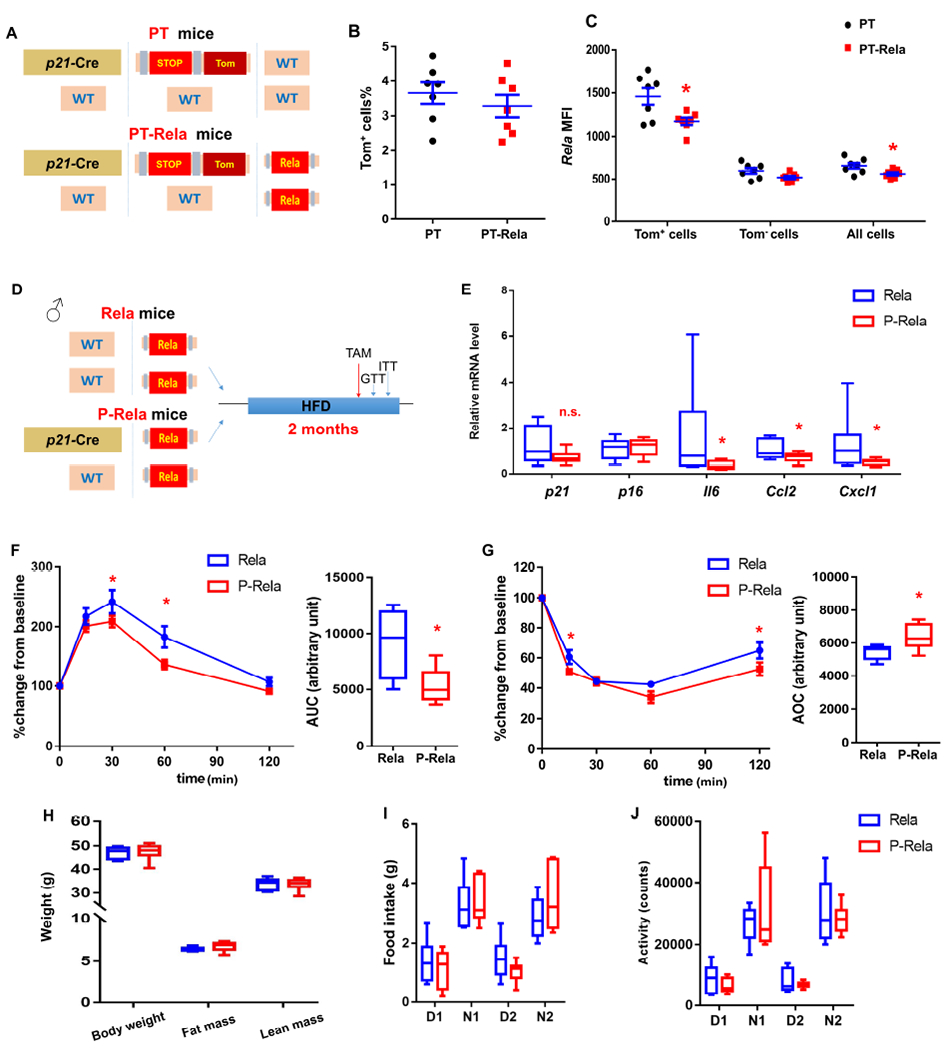
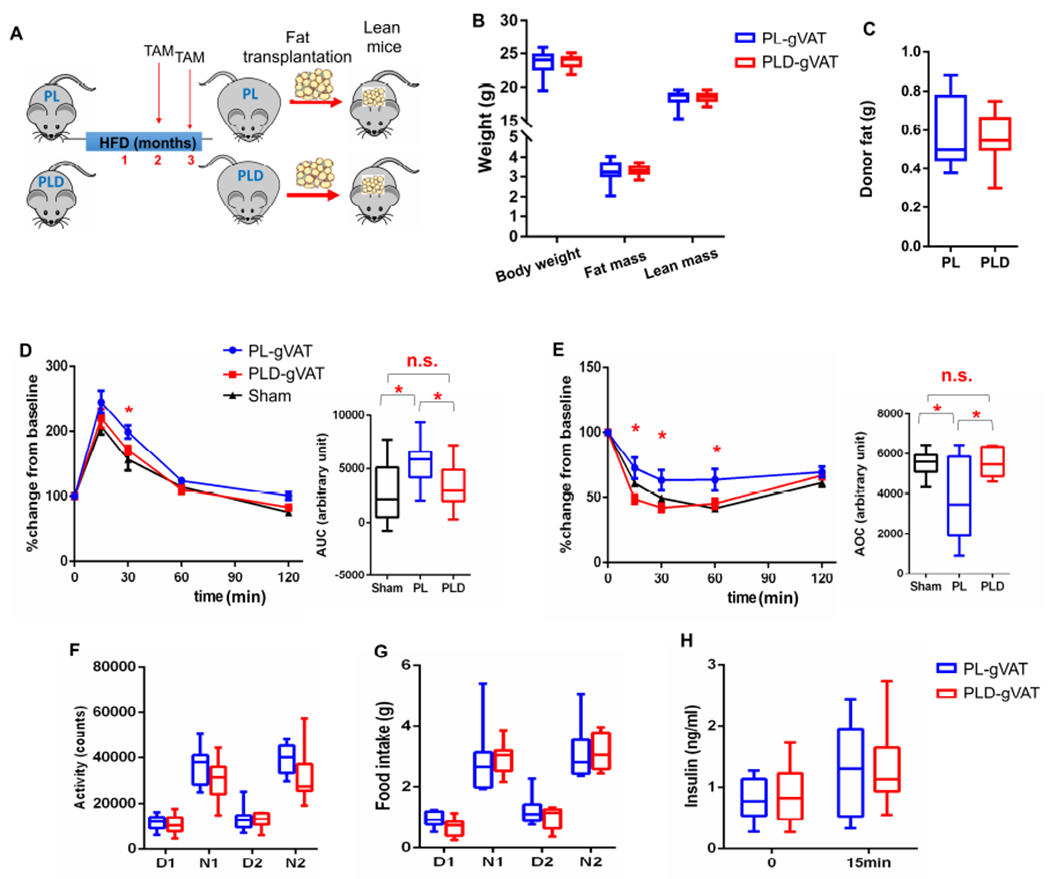
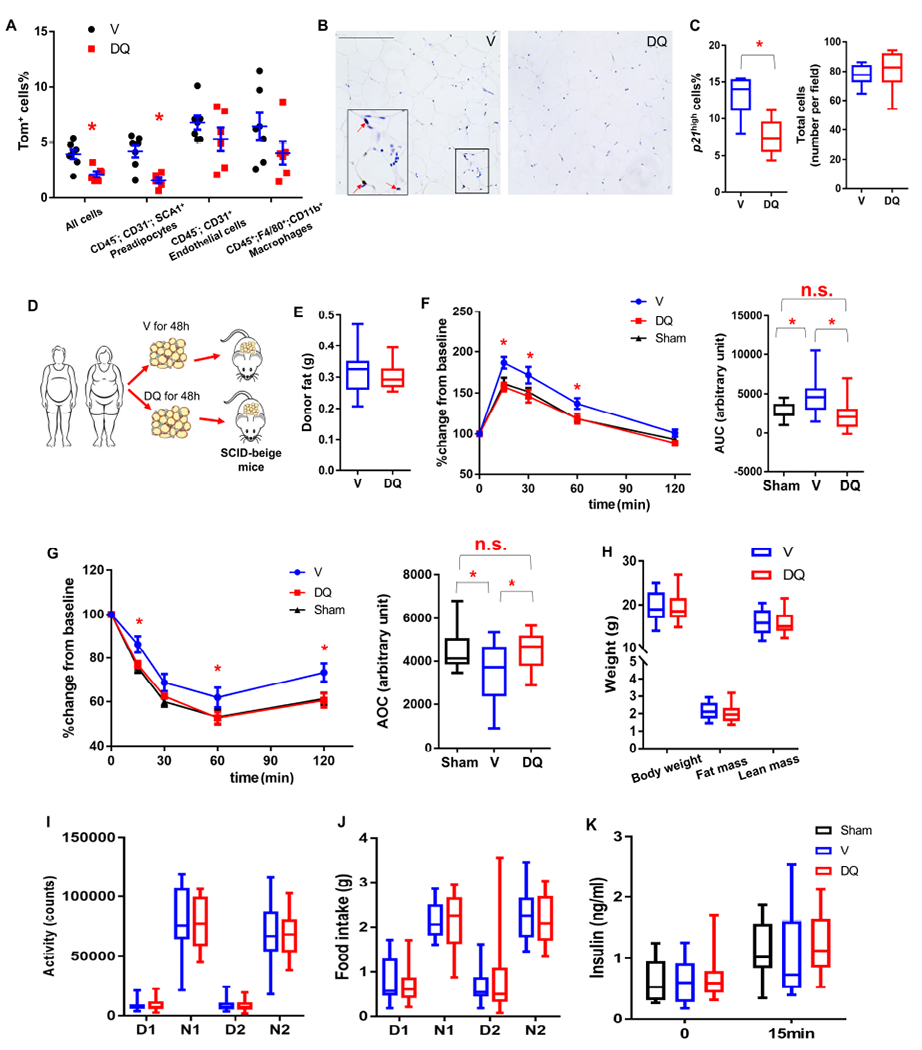
Insulin resistance is a pathological state often associated with obesity, representing a major risk factor for type 2 diabetes. Limited mechanism-based strategies exist to alleviate insulin resistance. Here, using single-cell transcriptomics, we identify a small, critically important, but previously unexamined cell population, p21Cip1 highly expressing (p21high) cells, which accumulate in adipose tissue with obesity. By leveraging a p21-Cre mouse model, we demonstrate that intermittent clearance of p21high cells can both prevent and alleviate insulin resistance in obese mice. Exclusive inactivation of the NF-κB pathway within p21high cells, without killing them, attenuates insulin resistance. Moreover, fat transplantation experiments establish that p21high cells within fat are sufficient to cause insulin resistance in vivo. Importantly, a senolytic cocktail, dasatinib plus quercetin, eliminates p21high cells in human fat ex vivo and mitigates insulin resistance following xenotransplantation into immuno-deficient mice. Our findings lay the foundation for pursuing the targeting of p21high cells as a new therapy to alleviate insulin resistance.

Keywords: Cellular senescence; NF-κB; diabetes; fat transplantation; senolytics; xenograft.


Conflict of interest statement

Declaration of interests M.X., A.K.P., T.T., and J.L.K. have a financial interest related to this research. Patents on senolytic drugs (including PCT/US2016/041646, filed at the US Patent Office) are held by Mayo Clinic. These studies were conducted in compliance with Mayo Clinic conflict of interest policies.

Figures

Figure 1.
Figure 1.. Single cell analysis of p21high cells in gVAT from lean and obese mice.
(A) Uniform manifold approximation and projection (UMAP) plot for unsupervised clustering of the single cells from SVF from RCD and HFD gVAT identified a total of 14 cell populations. (B) UMAP plots showing log2 (normalized expression of p21) in RCD (upper) and HFD (bottom) mice. Each panel represented one mouse, and the number of single cells was shown on the top right of each panel. (C) Violin plot of p21 expression in preadipocytes, endothelium, macrophages and others from RCD and HFD mice. Cells with p21 expression level > 6 (red line) were considered to be p21high. (D) Proportion of p21high cells (p21 expression level > 6) in all cells, preadipocytes, endothelium, macrophages and mesothelium. n = 3 for both groups. n represents the number of biological replicates with 1 technical replicate. Results were shown as means ± s.e.m. *P < 0.05; two-tailed Welch’s t-test. (E) Volcano plot of the down (left) and up-regulated (right) DEGs in p21high cells in all cell types. Overlapped DEGs among p21high preadipocytes, endothelium and macrophages are highlighted in red. (F) Gene ontology (upper) and KEGG (bottom) analysis (https://david.ncifcrf.gov/) of the up-regulated DEGs in p21high cells of 3 cell types. See also Figure S1.
Figure 2.
Figure 2.. Clearance of p21high cells alleviates metabolic dysfunction from 2 months of HFD.
(A) Genetic crosses and experimental design. (B) Percent of cells that are GFP+ across different cell types within gVAT. (C) Representative TAF images (4-5 images per biological replicate). A single layer obtained from z-stacks with 20+ layers is shown. TAFs are indicated by white arrows. Gamma H2A.X (green), Telomere probe (red), DAPI (blue). Cells are considered to be TAF+ if they contain no less than 3 TAFs from the entire z-stacks. Scale bar = 10 μm. (D) Proportion of TAF+ cells. (E) Proportion of EdU+ cells. (F) GTT curve (mean ± s.e.m.) and area under curve (AUC), (G) ITT curve (mean ± s.e.m.) and area over curve (AOC) in PL and PLD mice. (H) Relative mRNA expression in SVF. (I) Relative mRNA expression in adipocytes. For B, n = 7 for all groups. For D, n= 6 for PL, n = 5 for PLD. For E, n = 7 for PL, n = 8 for PLD. For F and G, n = 7 for PL-RCD and PLD-RCD; n = 8 for PL-HFD and PLD-HFD. For H and I, n = 4 for PL-RCD, n = 11 for PL-HFD and PLD-HFD. For B, E-I, n represents the number of biological replicates with 1 technical replicate. For D, n represents the number of biological replicates with 2-5 technical replicates. Results were shown as mean ± s.e.m. or box-and-whisker plots, where a box extends from the 25th to 75th percentile with the median shown as a line in the middle, and whiskers indicate the smallest and largest values. *P < 0.05 vs PL-HFD by one-way ANOVA (B, H-I), by two-way ANOVA (F-G), or by two-tailed Welch’s t-test (D-E). See also Figure S2–S5.
Figure 3.
Figure 3.. Intermittent clearance of p21high cells alleviates insulin resistance with obesity over the long term.
(A) Experimental timeline for B and C. (B-C) GTT curve (mean ± s.e.m.) and AUC (B), ITT curve (mean ± s.e.m.) and AOC (C) in PL and PLD mice 3 months after initiating HFD. (D) Experimental timeline for E and F. (E-F) GTT curve (mean ± s.e.m.) and AUC (E), ITT curve (mean ± s.e.m.) and AOC (F) in PL and PLD mice 4 months after initiating HFD. (G) Experimental timeline for H and I. (H-I) GTT curve (mean ± s.e.m.) and AUC (H), ITT curve (mean ± s.e.m.) and AOC (I) in PL and PLD mice 4 months after initiating HFD. For B, C, E, F, H and I, n = 8 for all groups. n represents the number of biological replicates with 1 technical replicate. Results were shown as box-and-whisker plots, where a box extends from the 25th to 75th percentile with the median shown as a line in the middle, and whiskers indicate the smallest and largest values. *P < 0.05 vs PL by two-way ANOVA (GTT and ITT curves), or by two-tailed Welch’s t-test (AUC and AOC). See also Figure S6.
Figure 4.
Figure 4.. Clearance of p21high cells has less metabolic benefit in female than male mice.
(A) Experimental design. (B) Representative images (1 image per 4 - 7 biological replicates) of LUC activity in female PL mice fed with RCD (n = 4) or HFD (n = 7). Scale bar = 15 mm. (C) Quantification of LUC activity. (D-E) GTT curve (mean ± s.e.m.) and AUC (D), body weight (E) in female RCD-fed PL, HFD-fed PL, and HFD-fed PLD mice after 2 months of HFD feeding. (F-H) GTT curve (mean ± s.e.m.) and AUC (F), ITT curve (mean ± s.e.m.), and AOC (G), body weight (H) in female PL and PLD mice after 8 months of HFD feeding. For C, n = 4 for female RCD, n = 7 for female HFD, n = 6 for male RCD, n = 8 for male HFD. For D-H, n = 7 for all groups. For C-H, n represents the number of biological replicates with 1 technical replicate. Results were shown as box-and-whisker plots, where a box extends from the 25th to 75th percentile with the median shown as a line in the middle, and whiskers indicate the smallest and largest values. *P < 0.05 vs RCD by two-tailed Welch’s t-test (C); *P < 0.05 vs PL by two-tailed Welch’s t-test (F and G) or by two-way ANOVA (GTT and ITT curves).
Figure 5.
Figure 5.. Inactivation of the NF-κB pathway specifically in p21high cells alleviates obesity-induced metabolic dysfunction.
(A) Transgenic schematic of PT and PT-Rela mice. (B) Proportion of Tom+ p21high cells in SVF from PT and PT-Rela mice fed with HFD. (C) Mean fluorescence intensity (MFI) of Rela staining by flow cytometry in Tom+, Tom and all SVF cells. (D) Experimental design. (E) Relative mRNA expression in gVAT. (F) GTT curve (mean ± s.e.m.) and AUC, (G) ITT curve (mean ± s.e.m.) and AOC in HFD-fed Rela and P-Rela mice. (H) Body composition. (I-J) Food intake (I) and activity (J) during daytime (D) and night (N) for 2 days in HFD-fed Rela and P-Rela mice. For B and C, n = 7 for both groups. Results were shown as means ± s.e.m. For E, n = 8 for Rela, n = 9 for P-Rela. For F and G, n = 7 for Rela, n = 6 for P-Rela. For H-J, n = 6 for both groups. For B-C, E-J, n represents the number of biological replicates with 1 technical replicate. Results were shown as box-and-whisker plots, where a box extends from the 25th to 75th percentile with the median shown as a line in the middle, and whiskers indicate the smallest and largest values. n.s, no significance vs Rela by two-tailed Welch’s t-test (E). *P < 0.05 vs PT (C) or Rela (E, F, G) by two-tailed Welch’s t-test, or by two-way ANOVA (GTT and ITT curves).
Figure 6.
Figure 6.. Elimination of p21high cells in gVAT is sufficient to alleviate obesity-induced metabolic dysfunction.
(A) Schematic of mouse gVAT transplantation experiments. (B) Body composition. (C) Donor fat weight 2 months after transplantation. (D-E) GTT curve (mean ± s.e.m.) and AUC (D), ITT curve (mean ± s.e.m.) and AOC (E) in lean mice transplanted with no tissue (Sham), gVAT from PL mice (PL-gVAT), and gVAT from PLD mice (PLD-gVAT). (F-G) Activity (F) and food intake (G) during daytime (D) and night (N) for 2 days. (H) Plasma insulin at baseline and 15 minutes after glucose injection. For B, C, H, n = 10 for both groups. For D and E, n = 8 for Sham, n = 10 for PL-gVAT, n = 10 for PLD-gVAT. For F, G, n = 8 for both groups. For B-H, n represents the number of biological replicates with 1 technical replicate. Results were shown as box-and-whisker plots, where a box extends from the 25th to 75th percentile with the median shown as a line in the middle, and whiskers indicate the smallest and largest values, n.s, no significance vs Sham by one-way ANOVA (D, E). *P < 0.05 vs PL by two-way ANOVA (GTT and ITT curves), or by one-way ANOVA (AUC and AOC). See also Figure S7.
Figure 7.
Figure 7.. Pharmacological elimination of p21high cells in VAT from humans with obesity alleviates its harmful effect on metabolic function in mice.
(A) Proportion of Tom+ cells in different cell types in gVAT from HFD-fed PT mice treated with D+Q (DQ) or vehicle (V). (B) Representative p21 staining micrographs of human VAT explants treated with DMSO (V) or D+Q (DQ) (3 images per 8 biological replicates in each group). Red arrows indicate p21high cells. Scale bar = 250 μm. (C) Percent of cells that are p21high cells among all cells and total cell number/field. (D) Experimental design for human VAT transplantation. (E) Human donor fat weight 2 months after transplantation. (F-G) GTT curve (mean ± s.e.m.) and AUC (F), ITT curve (mean ± s.e.m.) and AOC (G) in SCID-Beige mice transplanted with no tissue (Sham), VAT explants from humans with obesity treated with DMSO (V) or D+Q (DQ). (H) Body composition. (I-J) Activity (I) and food intake (J) during daytime (D) and night (N) for 2 days. (K) Plasma insulin at baseline and 15 minutes after glucose injection. For A, n = 7 for V, n = 6 for DQ. Results were shown as means ± s.e.m. For C, n = 8 for both groups. For E-K, n = 12 for Sham, n = 13 for V, n = 14 for DQ. For A, C, E-H, n represents the number of biological replicates with 1 technical replicate. Results were shown as box-and-whisker plots, where a box extends from the 25th to 75th percentile with the median shown as a line in the middle, and whiskers indicate the smallest and largest values. n.s, no significance vs Sham by one-way ANOVA (F-AUC, G-AOC). *P < 0.05 vs V by two-tailed Welch’s t-test (A, C), by one-way ANOVA (F, G), or by two-way ANOVA (GTT and ITT curves).

Comment in

References

    1. Aguayo-Mazzucato C, Andle J, Lee TB Jr., Midha A, Talemal L, Chipashvili V, Hollister-Lock J, van Deursen J, Weir G, and Bonner-Weir S (2019). Acceleration of beta Cell Aging Determines Diabetes and Senolysis Improves Disease Outcomes. Cell Metab. - PMC - PubMed
    1. Centers for Disease Control and Prevention (2018). Adult Obesity Facts.
    1. Champy MF, Selloum M, Zeitler V, Caradec C, Jung B, Rousseau S, Pouilly L, Sorg T, and Auwerx J (2008). Genetic background determines metabolic phenotypes in the mouse. Mamm Genome 19, 318–331. - PubMed
    1. Chen LF, and Greene WC (2004). Shaping the nuclear action of NF-kappaB. Nat Rev Mol Cell Biol 5, 392–401. - PubMed
    1. Chien Y, Scuoppo C, Wang X, Fang X, Balgley B, Bolden JE, Premsrirut P, Luo W, Chicas A, Lee CS, et al. (2011). Control of the senescence-associated secretory phenotype by NF-kappaB promotes senescence and enhances chemosensitivity. Genes Dev 25, 2125–2136. - PMC - PubMed

Publication types