

Multi-task vision transformer using low-level chest X-ray feature corpus for COVID-19 diagnosis and severity quantification
- PMID: 34814058
- PMCID: PMC8566090
- DOI: 10.1016/j.media.2021.102299
Multi-task vision transformer using low-level chest X-ray feature corpus for COVID-19 diagnosis and severity quantification
Abstract
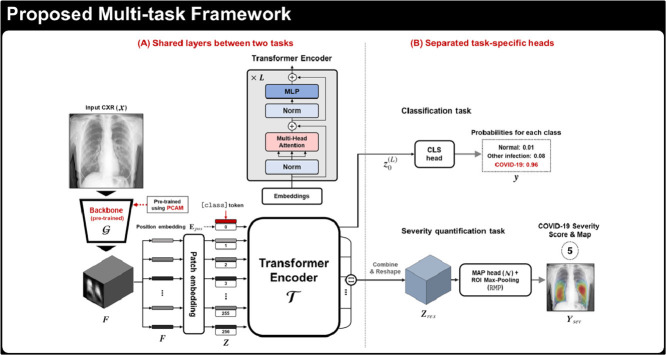
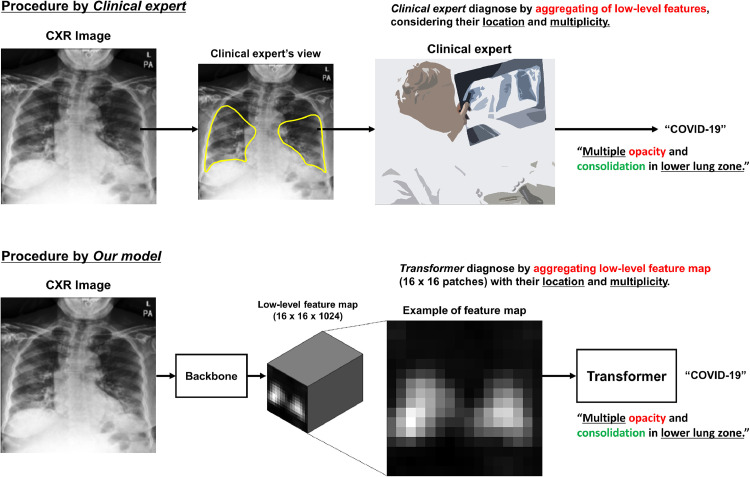
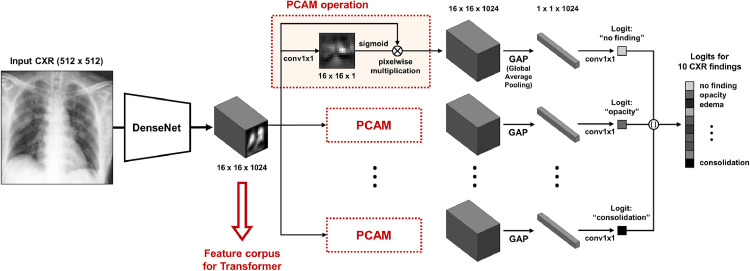
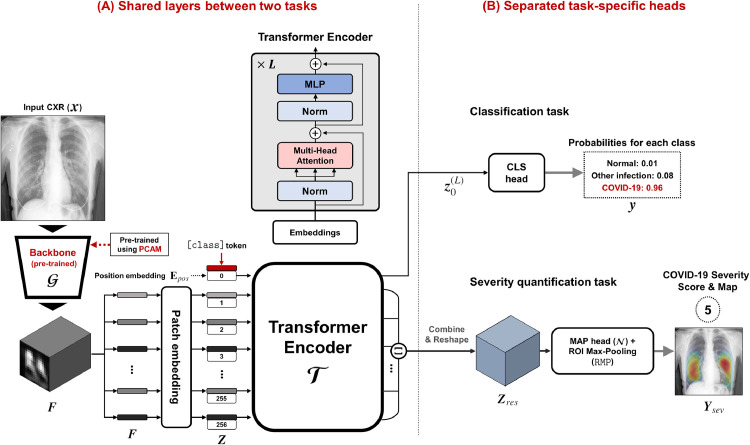
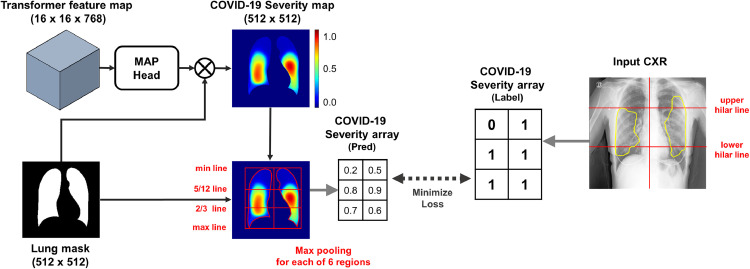
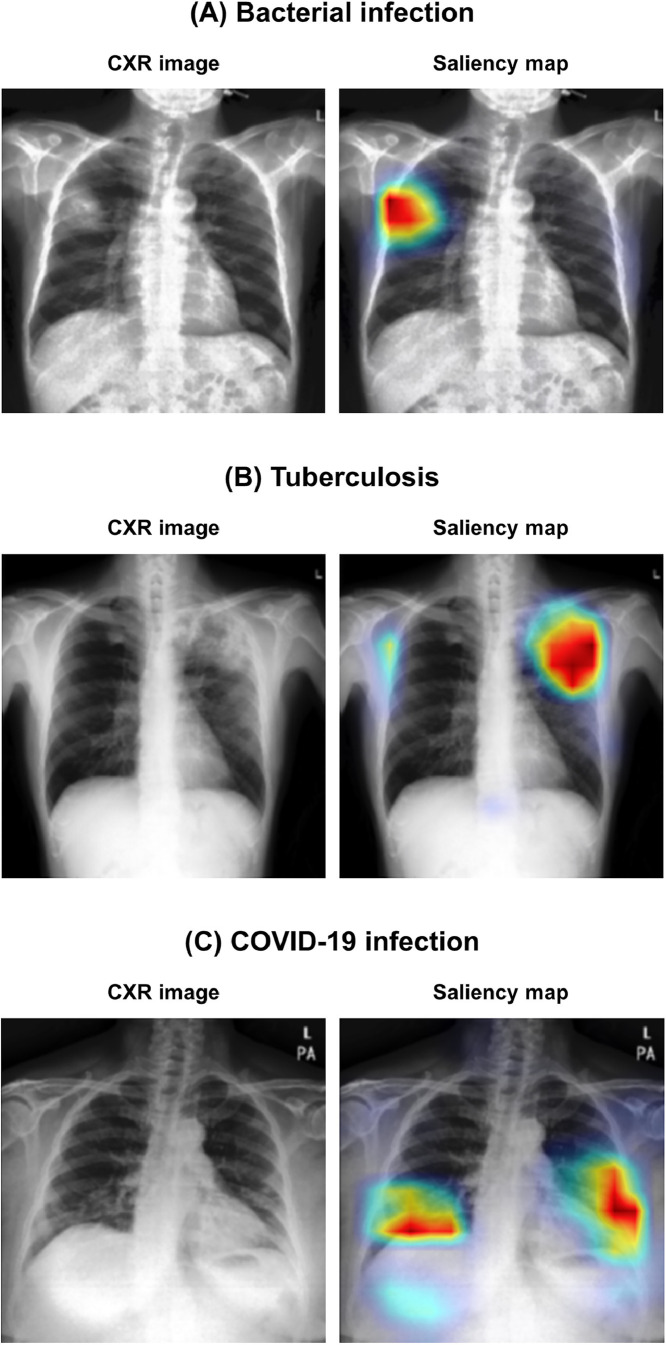
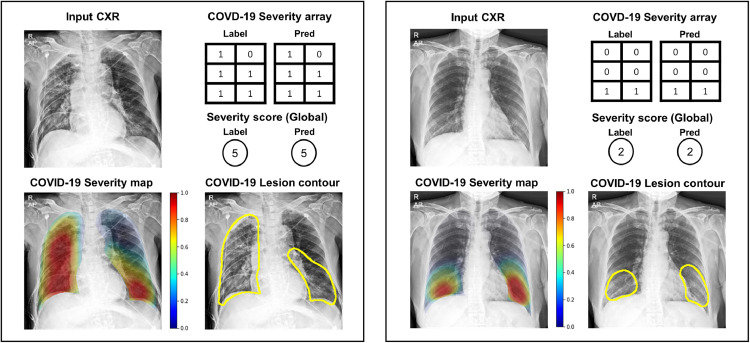
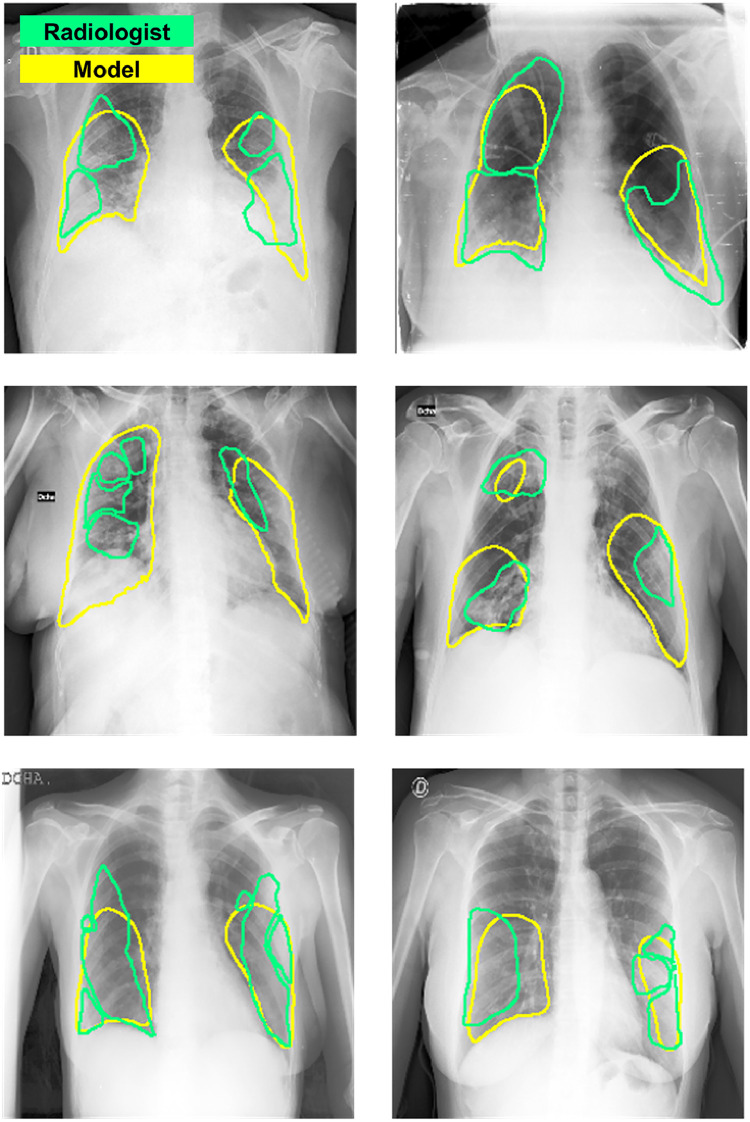
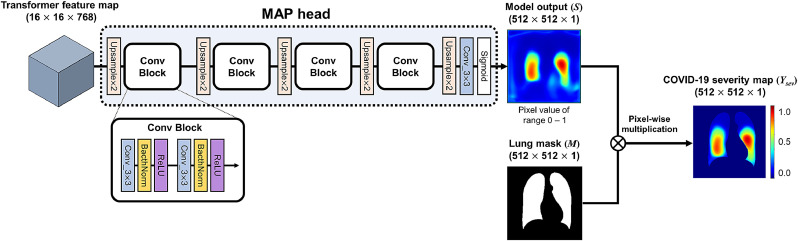
Developing a robust algorithm to diagnose and quantify the severity of the novel coronavirus disease 2019 (COVID-19) using Chest X-ray (CXR) requires a large number of well-curated COVID-19 datasets, which is difficult to collect under the global COVID-19 pandemic. On the other hand, CXR data with other findings are abundant. This situation is ideally suited for the Vision Transformer (ViT) architecture, where a lot of unlabeled data can be used through structural modeling by the self-attention mechanism. However, the use of existing ViT may not be optimal, as the feature embedding by direct patch flattening or ResNet backbone in the standard ViT is not intended for CXR. To address this problem, here we propose a novel Multi-task ViT that leverages low-level CXR feature corpus obtained from a backbone network that extracts common CXR findings. Specifically, the backbone network is first trained with large public datasets to detect common abnormal findings such as consolidation, opacity, edema, etc. Then, the embedded features from the backbone network are used as corpora for a versatile Transformer model for both the diagnosis and the severity quantification of COVID-19. We evaluate our model on various external test datasets from totally different institutions to evaluate the generalization capability. The experimental results confirm that our model can achieve state-of-the-art performance in both diagnosis and severity quantification tasks with outstanding generalization capability, which are sine qua non of widespread deployment.
Keywords: Chest X-ray; Coronavirus disease-19; Multi-task learning; Vision transformer.
Copyright © 2021 Elsevier B.V. All rights reserved.
Conflict of interest statement
Declaration of Competing Interest The authors declare that they have no known competing financial interests or personal relationships that could have appeared to influence the work reported in this paper.
Figures
Similar articles
-
IEViT: An enhanced vision transformer architecture for chest X-ray image classification.Comput Methods Programs Biomed. 2022 Nov;226:107141. doi: 10.1016/j.cmpb.2022.107141. Epub 2022 Sep 16. Comput Methods Programs Biomed. 2022. PMID: 36162246
-
PneuNet: deep learning for COVID-19 pneumonia diagnosis on chest X-ray image analysis using Vision Transformer.Med Biol Eng Comput. 2023 Jun;61(6):1395-1408. doi: 10.1007/s11517-022-02746-2. Epub 2023 Jan 31. Med Biol Eng Comput. 2023. PMID: 36719562 Free PMC article.
-
Lung pneumonia severity scoring in chest X-ray images using transformers.Med Biol Eng Comput. 2024 Aug;62(8):2389-2407. doi: 10.1007/s11517-024-03066-3. Epub 2024 Apr 9. Med Biol Eng Comput. 2024. PMID: 38589723 Free PMC article.
-
Portable chest X-ray in coronavirus disease-19 (COVID-19): A pictorial review.Clin Imaging. 2020 Aug;64:35-42. doi: 10.1016/j.clinimag.2020.04.001. Epub 2020 Apr 8. Clin Imaging. 2020. PMID: 32302927 Free PMC article. Review.
-
Thoracic imaging tests for the diagnosis of COVID-19.Cochrane Database Syst Rev. 2020 Sep 30;9:CD013639. doi: 10.1002/14651858.CD013639.pub2. Cochrane Database Syst Rev. 2020. Update in: Cochrane Database Syst Rev. 2020 Nov 26;11:CD013639. doi: 10.1002/14651858.CD013639.pub3. PMID: 32997361 Updated.
Cited by
-
Deep Learning Network Selection and Optimized Information Fusion for Enhanced COVID-19 Detection: A Literature Review.Diagnostics (Basel). 2025 Jul 21;15(14):1830. doi: 10.3390/diagnostics15141830. Diagnostics (Basel). 2025. PMID: 40722579 Free PMC article. Review.
-
Automated Multi-View Multi-Modal Assessment of COVID-19 Patients Using Reciprocal Attention and Biomedical Transform.Front Public Health. 2022 May 25;10:886958. doi: 10.3389/fpubh.2022.886958. eCollection 2022. Front Public Health. 2022. PMID: 35692335 Free PMC article.
-
Segmentation and classification on chest radiography: a systematic survey.Vis Comput. 2023;39(3):875-913. doi: 10.1007/s00371-021-02352-7. Epub 2022 Jan 8. Vis Comput. 2023. PMID: 35035008 Free PMC article.
-
Metaheuristic optimizers integrated with vision transformer model for severity detection and classification via multimodal COVID-19 images.Sci Rep. 2025 Apr 22;15(1):13941. doi: 10.1038/s41598-025-98593-w. Sci Rep. 2025. PMID: 40263404 Free PMC article.
-
COVID-19 detection on chest X-ray images using Homomorphic Transformation and VGG inspired deep convolutional neural network.Biocybern Biomed Eng. 2023 Jan-Mar;43(1):1-16. doi: 10.1016/j.bbe.2022.11.003. Epub 2022 Nov 24. Biocybern Biomed Eng. 2023. PMID: 36447948 Free PMC article.
References
Publication types
MeSH terms
LinkOut - more resources
Full Text Sources
Medical
