

Optimizing COVID-19 control with asymptomatic surveillance testing in a university environment
- PMID: 34814094
- PMCID: PMC8591900
- DOI: 10.1016/j.epidem.2021.100527
Optimizing COVID-19 control with asymptomatic surveillance testing in a university environment
Abstract
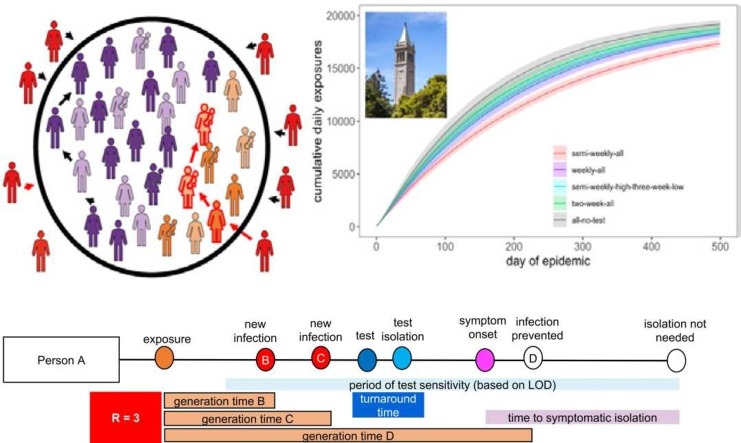
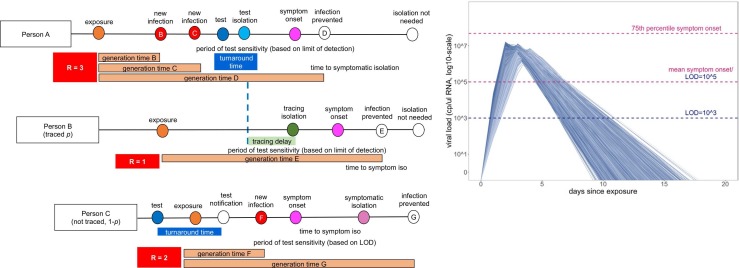
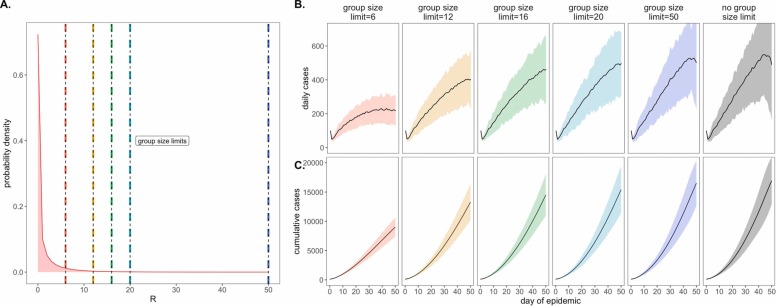
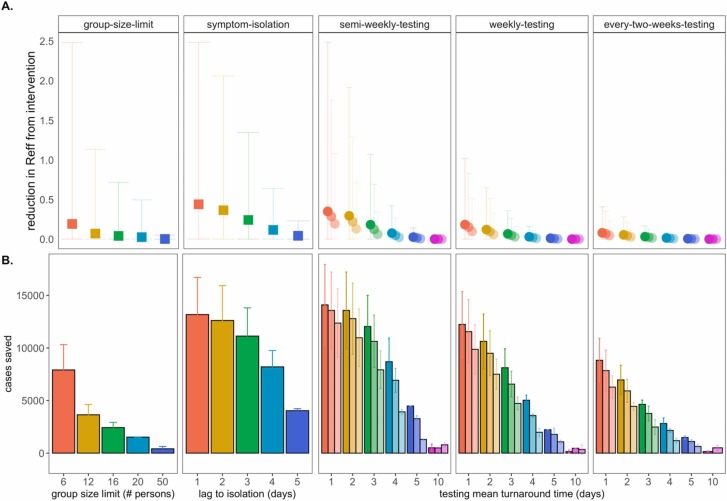
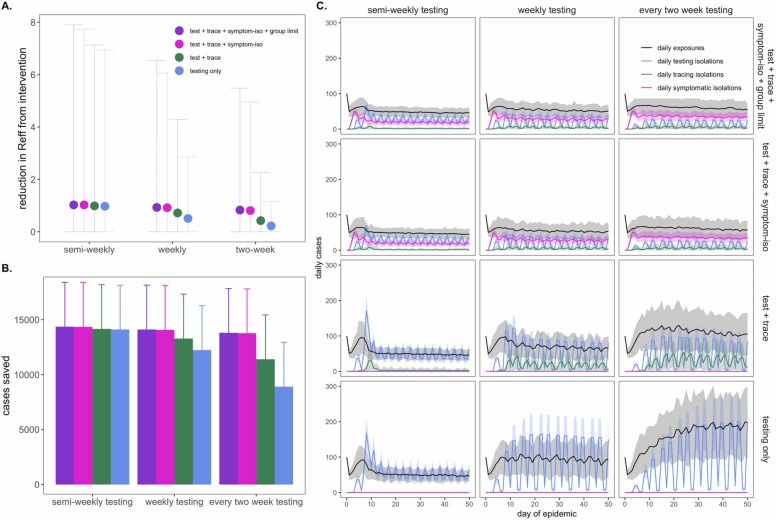
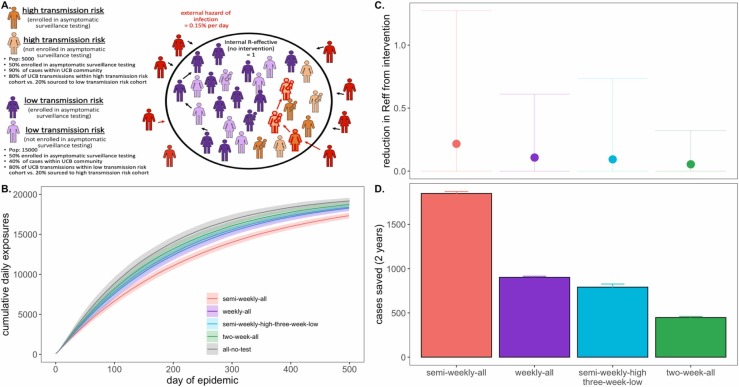
The high proportion of transmission events derived from asymptomatic or presymptomatic infections make SARS-CoV-2, the causative agent in COVID-19, difficult to control through the traditional non-pharmaceutical interventions (NPIs) of symptom-based isolation and contact tracing. As a consequence, many US universities developed asymptomatic surveillance testing labs, to augment NPIs and control outbreaks on campus throughout the 2020-2021 academic year (AY); several of those labs continue to support asymptomatic surveillance efforts on campus in AY2021-2022. At the height of the pandemic, we built a stochastic branching process model of COVID-19 dynamics at UC Berkeley to advise optimal control strategies in a university environment. Our model combines behavioral interventions in the form of group size limits to deter superspreading, symptom-based isolation, and contact tracing, with asymptomatic surveillance testing. We found that behavioral interventions offer a cost-effective means of epidemic control: group size limits of six or fewer greatly reduce superspreading, and rapid isolation of symptomatic infections can halt rising epidemics, depending on the frequency of asymptomatic transmission in the population. Surveillance testing can overcome uncertainty surrounding asymptomatic infections, with the most effective approaches prioritizing frequent testing with rapid turnaround time to isolation over test sensitivity. Importantly, contact tracing amplifies population-level impacts of all infection isolations, making even delayed interventions effective. Combination of behavior-based NPIs and asymptomatic surveillance also reduces variation in daily case counts to produce more predictable epidemics. Furthermore, targeted, intensive testing of a minority of high transmission risk individuals can effectively control the COVID-19 epidemic for the surrounding population. Even in some highly vaccinated university settings in AY2021-2022, asymptomatic surveillance testing offers an effective means of identifying breakthrough infections, halting onward transmission, and reducing total caseload. We offer this blueprint and easy-to-implement modeling tool to other academic or professional communities navigating optimal return-to-work strategies.
Keywords: Asymptomatic surveillance testing; Branching process model; COVID-19; University control.
Copyright © 2021 The Authors. Published by Elsevier B.V. All rights reserved.
Figures
Update of
-
Optimizing COVID-19 control with asymptomatic surveillance testing in a university environment.medRxiv [Preprint]. 2021 Oct 27:2020.11.12.20230870. doi: 10.1101/2020.11.12.20230870. medRxiv. 2021. Update in: Epidemics. 2021 Dec;37:100527. doi: 10.1016/j.epidem.2021.100527. PMID: 33442708 Free PMC article. Updated. Preprint.
References
-
- Adam, D.C., Wu, P., Wong, J.Y., Lau, E.H.Y., Tsang1, T.K., Cauchemez, S., Leung, G.M., Cowling, B.J., Cauchemez3, B.J.C. *, Leung1*, Gabriel M., 2559. Clustering and superspreading potential of severe acute respiratory syndrome coronavirus 2 (SARS-CoV-2) infections in Hong Kong, J. Vis. Lang. Comput. 11, 55. https://www.m-culture.go.th/mculture_th/download/king9/Glossary_about_HM....
-
- Althouse B.M., Wenger E.A., Miller J.C., Scarpino S.V., Allard A., Hébert-Dufresne L., Hu H. Stochasticity and heterogeneity in the transmission dynamics of SARS-CoV-2. ArXiv. 2020:1–10. 〈http://arxiv.org/abs/2005.13689〉 - PMC - PubMed
-
- Amen A.M., Barry K.W., Brook C.E., Boyle J.M., Choo S., Cornmesser L.T., Dilworth D.J., Doudna J.A., Ehrenberg A.J., Fedrigo I., Friedline S.E., Graham T.G.W., Green R., Hamilton J.R., Hirsh A., Hochstrasser M.L., Hockemeyer D., Krishnappa N., Lari A., Li H., Lin-Shiao E., Lu T., Lyons E.F., Mark K.G., Martell L.A., Martins A.R.O., McDevitt S.L., Mitchell P.S., Moehle E.A., Naca C., Nandakumar D., O’Brien E., Pappas D.J., Pestal K., Quach D.L., Rubin B.E., Sachdeva R., Stahl E.C., Syed A.M., Tan I.-L., Tollner A.L., Tsuchida C.A., Tsui C.K., Turkalo T.K., Urnov F.D., Warf M.B., Whitney O.N., Witkowsky L.B. Blueprint for a pop-up SARS-CoV-2 testing lab. Nat. Biotechnol. 2020;38:791–797. doi: 10.1038/s41587-020-0583-3. - DOI - PubMed
-
- Anderson R.M., May R.M., Boily M.C., Garnett G.P., Rowley J.T. The spread of HIV-1 in Africa: sexual conflict patterns and the predicted demographic impact of AIDS. Nature. 1991;352:581–589. - PubMed
Publication types
MeSH terms
Grants and funding
LinkOut - more resources
Full Text Sources
Medical
Miscellaneous
