Clinical Trial
. 2022 Jan;601(7894):617-622.
doi: 10.1038/s41586-021-04232-5. Epub 2021 Nov 23.

A COVID-19 peptide vaccine for the induction of SARS-CoV-2 T cell immunity

Affiliations
Clinical Trial

A COVID-19 peptide vaccine for the induction of SARS-CoV-2 T cell immunity

Jonas S Heitmann et al. Nature. 2022 Jan.

Abstract

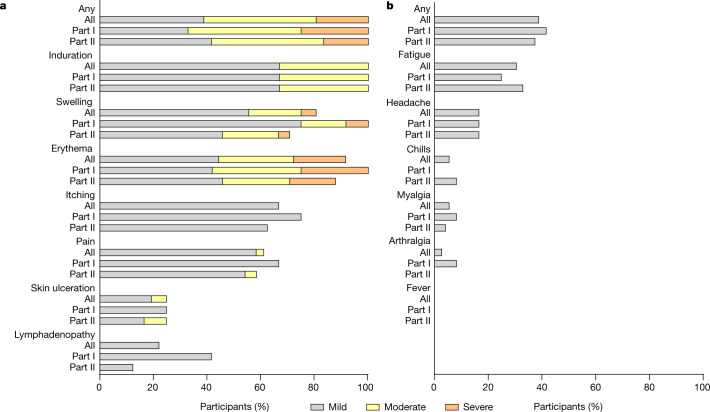
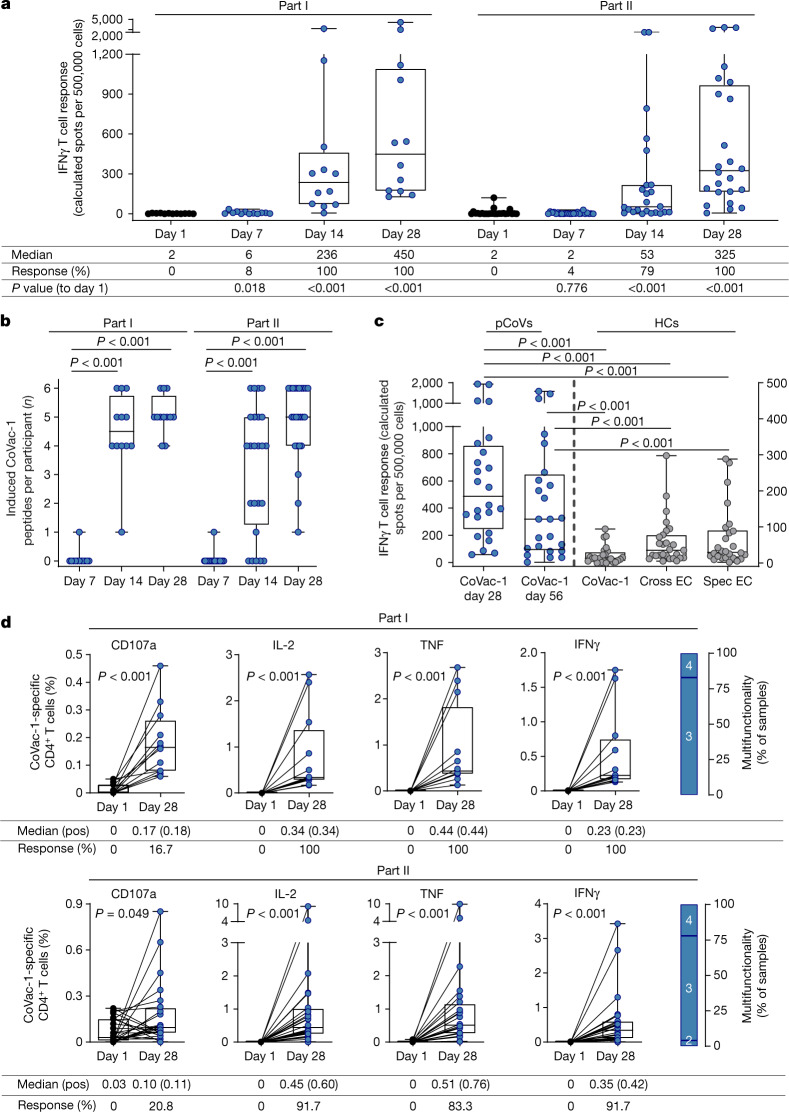
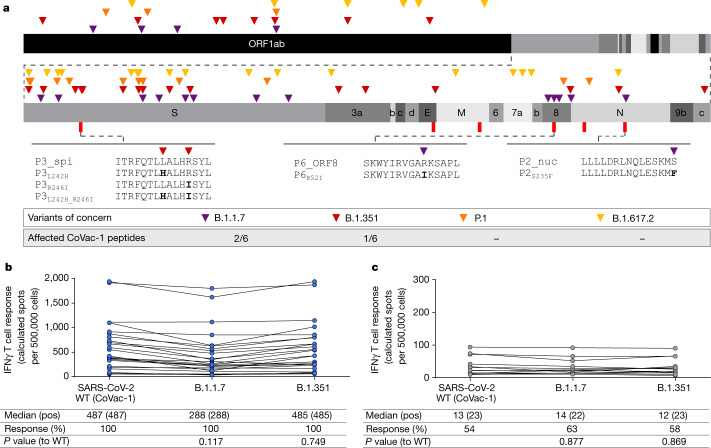
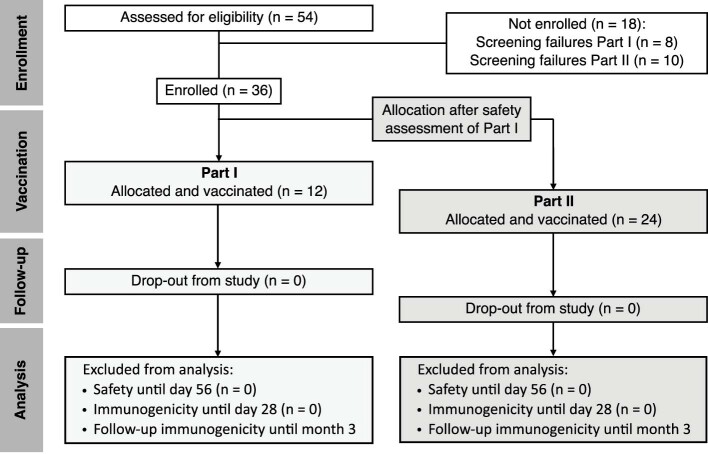
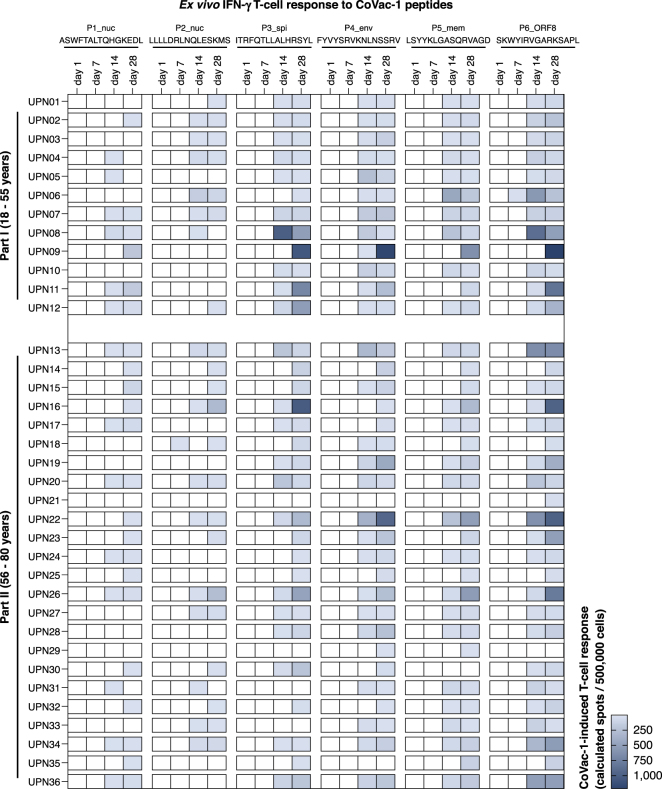
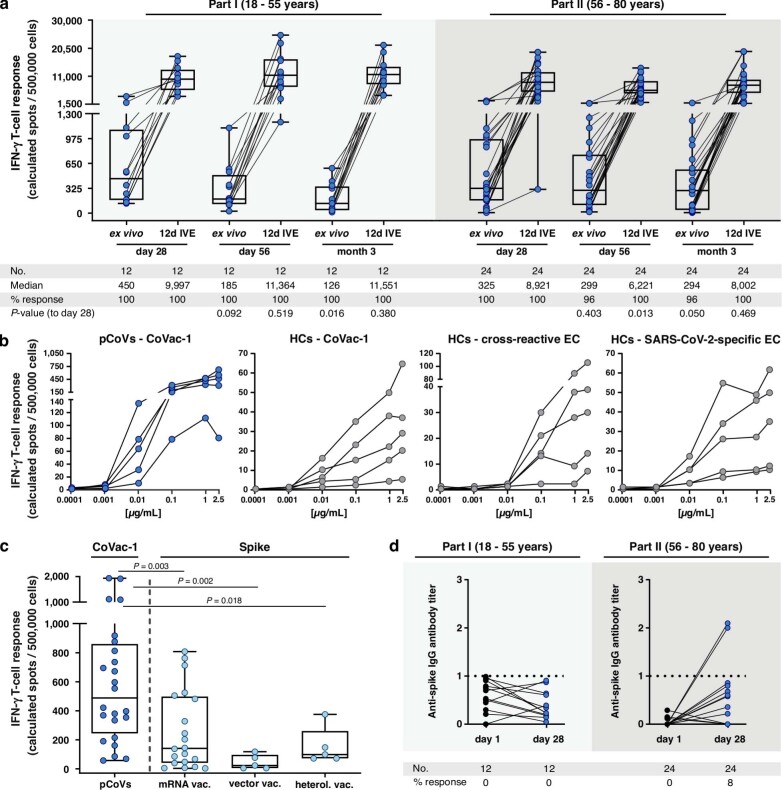
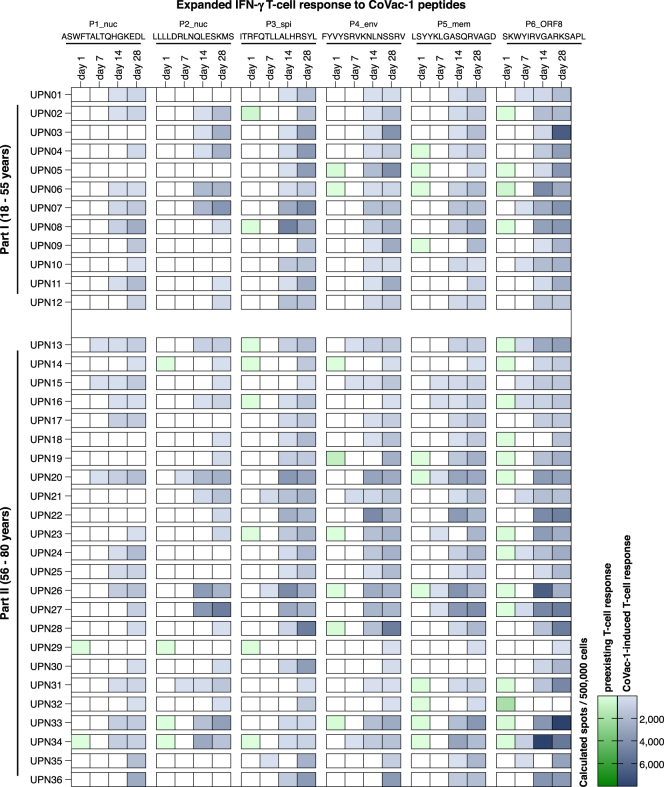
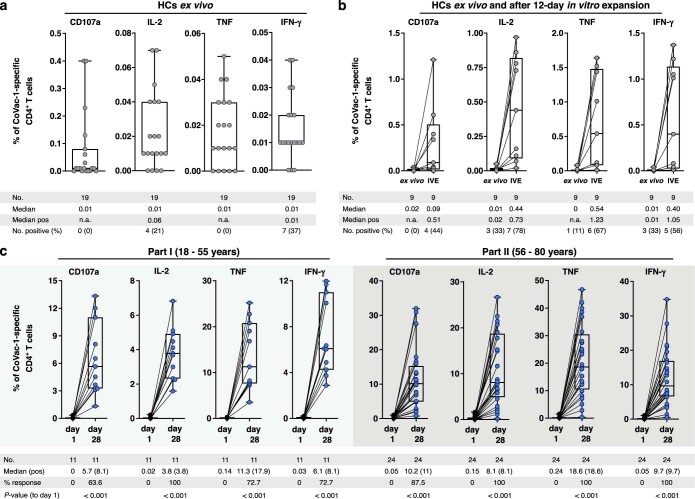
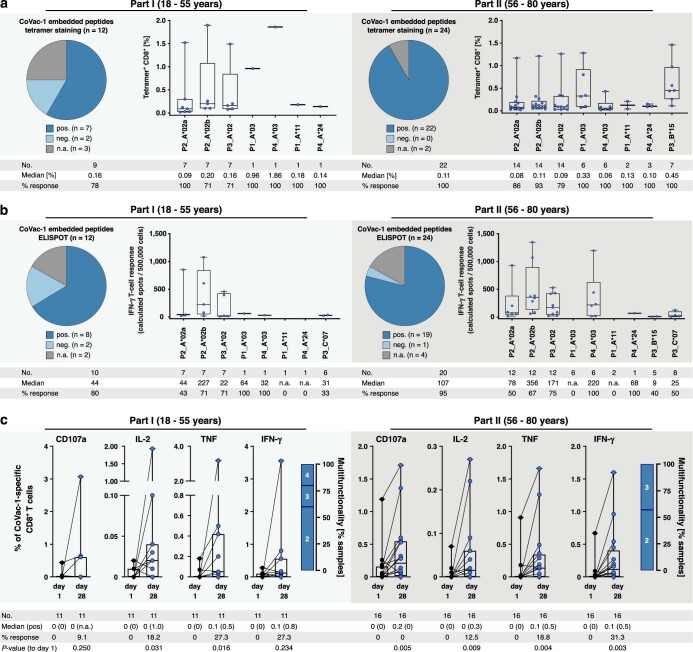
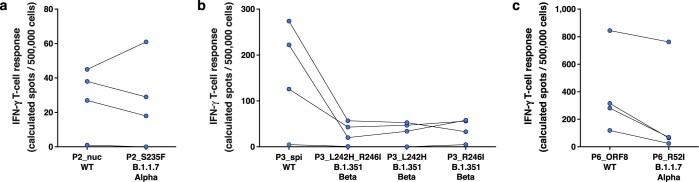
T cell immunity is central for the control of viral infections. CoVac-1 is a peptide-based vaccine candidate, composed of SARS-CoV-2 T cell epitopes derived from various viral proteins1,2, combined with the Toll-like receptor 1/2 agonist XS15 emulsified in Montanide ISA51 VG, aiming to induce profound SARS-CoV-2 T cell immunity to combat COVID-19. Here we conducted a phase I open-label trial, recruiting 36 participants aged 18-80 years, who received a single subcutaneous CoVac-1 vaccination. The primary end point was safety analysed until day 56. Immunogenicity in terms of CoVac-1-induced T cell response was analysed as the main secondary end point until day 28 and in the follow-up until month 3. No serious adverse events and no grade 4 adverse events were observed. Expected local granuloma formation was observed in all study participants, whereas systemic reactogenicity was absent or mild. SARS-CoV-2-specific T cell responses targeting multiple vaccine peptides were induced in all study participants, mediated by multifunctional T helper 1 CD4+ and CD8+ T cells. CoVac-1-induced IFNγ T cell responses persisted in the follow-up analyses and surpassed those detected after SARS-CoV-2 infection as well as after vaccination with approved vaccines. Furthermore, vaccine-induced T cell responses were unaffected by current SARS-CoV-2 variants of concern. Together, CoVac-1 showed a favourable safety profile and induced broad, potent and variant of concern-independent T cell responses, supporting the presently ongoing evaluation in a phase II trial for patients with B cell or antibody deficiency.


Conflict of interest statement

The University Hospital Tübingen is in the process of applying for a patent application (EP 20 169 047.6) covering the SARS-CoV-2 T cell epitopes included in CoVac-1 that lists A.N., T.B., H.-G.R. and J.S.W as inventors. EMC Microcollections GmbH is in the process of applying for a patent application (DE102016005550.2) covering the adjuvant XS15 included in CoVac-1 that lists H.-G.R. as an inventor. The other authors declare no competing interests.

Figures

Fig. 1
Fig. 1. Local and systemic solicited adverse events.
a, b, Related local (a) and systemic (b) solicited adverse events within 56 days after vaccination. Severity was graded as mild (grade 1), moderate (grade 2) or severe (grade 3) based on the definition provided in Methods. Healthy adults 18–55 years of age were included in part I (n = 12), and participants 56–80 years of age were included in part II (n = 24). A detailed description of the data is presented in Extended Data Table 1. Source Data
Fig. 2
Fig. 2. CoVac-1-induced T cell responses.
ac, CoVac-1-induced T cell responses assessed ex vivo by IFNγ ELISPOT assays using peripheral blood mononuclear cells from study participants of part I (n = 12) and part II (n = 24) collected before vaccination (day 1) and at different time points after vaccination (days 7, 14, 28 and 56) or from human convalescent individuals (HCs). The intensity of T cell responses is depicted as cumulative calculated spot counts (mean spot count of technical replicates normalized to 500,000 cells minus the respective negative control) (a). The number of CoVac-1 T cell epitopes (n = 6) per participant that elicited a vaccine-induced T cell response (b). Intensities of CoVac-1-induced IFNγ T cell responses assessed ex vivo in part I and part II study participants (pCoVs; n = 24, day 28 and day 56, left y axis) compared with T cell responses detected in HCs (right y axis) against CoVac-1 vaccine peptides and previously published, SARS-CoV-2-specific (spec) and cross-reactive (cross) T cell epitope compositions (ECs; CoVac-1 n = 24, cross EC n = 27, spec EC n = 26) (c). d, Frequencies of functional CoVac-1‐induced CD4+ T cells in study participants before vaccination (day 1) and at day 28 following vaccination using ex vivo intracellular cytokines (IFNγ, TNF and IL-2) and surface marker staining (CD107a). The right graph displays the proportion of samples revealing difunctional (2), trifunctional (3) or tetrafunctional (4) T cells. Pos, positive. In ad, the box plots or combined box-line plots show the median with 25th or 75th percentiles, and minimum and maximum whiskers. In ab, d, two-sided Wilcoxon signed-rank test was used; in c, two-sided Mann–Whitney U-test was used. Healthy adults 18–55 years of age were included in part I, and participants 56–80 years of age were included in part II. pos, positive. Source Data
Fig. 3
Fig. 3. Role of SARS-CoV-2 variants of concern on CoVac-1 peptides and immunogenicity.
a, Colour-coded mutations described for variants of concern are shown together with corresponding affected CoVac-1 peptides. b, c, Intensities of T cell responses (calculated spot counts) to CoVac-1 peptides as well as to the corresponding peptide pools comprising the CoVac-1-affecting mutations of B.1.1.7 and B.1.351 were assessed ex vivo by IFNγ ELISPOT assays using peripheral blood mononuclear cells from study participants of part I (n = 12) and part II (n = 24) collected on day 28 after vaccination (pCoVs) (b) or from HCs (c). Two-sided Mann–Whitney U-test was used. Source Data
Extended Data Fig. 1
Extended Data Fig. 1. Consort flow diagram of the trial.
The 18 participants who were not enrolled did not meet the inclusion criteria at screening. All 36 enrolled participants received one dose of the CoVac-1 vaccine. Safety oversight to proceed to part II was performed by an independent safety monitoring committee and approved by the Paul Ehrlich Institute and the local Ethics Committee after an interim safety and immunogenicity analysis of study participants included in part I on day 28 after vaccine administration. n, number.
Extended Data Fig. 2
Extended Data Fig. 2. Intensities of CoVac-1-induced T cell responses ex vivo assessed in IFNγ ELISPOT assays.
Heatmap of CoVac-1-induced T cell response intensities (calculated spots per 500,000 cells, color gradient blue) to single CoVac-1 peptides (nuc, nucleocapsid; spi, spike; env, envelope; mem, membrane; ORF, open reading frame) in ex vivo IFNγ ELISPOT assays using PBMCs from study participants (uniform participant number, UPN) of part I (n = 12) and part II (n = 24) before vaccination (day 1) and at different time points after vaccination (day 7, day 14, day 28). Source Data
Extended Data Fig. 3
Extended Data Fig. 3. Characterization of CoVac-1-induced immune responses.
(a) CoVac-1-induced long-term T cell responses assessed ex vivo or after 12-day in vitro expansion (IVE) in study participants of part I and II at day 56 and month 3 after vaccination (compared to day 28) using IFNγ ELISPOT assays. Intensity of T cell responses is depicted as calculated spot counts (mean spot count of technical replicates normalized to 500,000 cells minus the respective normalized negative control). (b) Peptide titration in ex vivo IFNγ ELISPOT assays using PBMCs from study participants (pCoVs, n = 5, day 28) or from human COVID-19 convalescent donors (HCs, n = 5) with decreasing peptide concentrations (2.5 µg mL-1 to 0.1 ng mL-1) of CoVac-1 (panel 1 and 2) or SARS-CoV-2 cross-reactive (panel 3) and SARS-CoV-2 specific (panel 4) epitope compositions (ECs). (c) Intensities of CoVac-1-induced IFNγ T cell responses assessed ex vivo in study participants of part I and part II (pCoVs, n = 24, day 28) compared to spike-specific T cell responses in healthy immunized donors after second vaccination with approved mRNA vaccines (n = 20), vector-based vaccines (n = 5), or heterologous vaccination (n = 5). (d) Anti-spike IgG antibody titers assessed on day 1 prior to vaccination and on day 28 after vaccination. Values < 0.1 were set to zero and values ≥ 1.0 were considered positive. (a, c) Box plots or combined box-line plots show median with 25th or 75th percentiles, and min/max whiskers. (a) two-sided Wilcoxon signed-rank test, (c) two-sided Mann-Whitney U-test. no, number. Source Data
Extended Data Fig. 4
Extended Data Fig. 4. Intensities of CoVac-1-induced T cell responses assessed in IFNγ ELISPOT assays after 12-day in vitro expansion.
Heatmap of preexisting (color gradient green) or CoVac-1-induced (color gradient blue) T cell response intensities (calculated spots per 500,000 cells) to single CoVac-1 peptides (nuc, nucleocapsid; spi, spike; env, envelope; mem, membrane; ORF, open reading frame) in IFNγ ELISPOT assays after 12-day in vitro expansion of PBMCs from study participants (uniform participant number, UPN) of part I (n = 12) and part II (n = 24) before vaccination (day 1) and at different time points after vaccination (day 7, day 14, day 28). Source Data
Extended Data Fig. 5
Extended Data Fig. 5. CoVac-1-induced CD4+ T cell responses in human COVID-19 convalescents and study participants.
(ac) Frequencies of CoVac-1‐specific CD4+ T cells in (a) human convalescent samples (HCs) after SARS-CoV-2 infection analyzed ex vivo (n = 19) and (b) after 12-day in vitro expansion (n = 9), and (c) in study participants of part I (n = 11) and part II (n = 24) after 12-day in vitro expansion of PBMCs collected prior to vaccination (day 1) or on day 28 following vaccine administration. Functionality of CD4+ T cells was assessed for upregulation of the degranulation marker CD107a and production of the T helper 1 (Th1) cytokines (IFNγ, TNF, and IL 2). (ac) Box plots or combined box-line plots display median with 25th or 75th percentiles, and min/max whiskers, two-sided Wilcoxon signed-rank test, n.a., not applicable; no, number; pos, positive. Source Data
Extended Data Fig. 6
Extended Data Fig. 6. CoVac-1-induced CD8+ T cell responses to HLA class I-restricted CoVac-1-embedded peptides and CoVac-1 peptides.
T cell responses to HLA class I-restricted SARS-CoV-2 peptides embedded within the CoVac-1 vaccine peptides (matching the HLA allotype of the respective participant) were assessed by (a) tetramer staining and (b) IFNγ ELISPOT assays after in vitro expansion of PBMCs from study participants (part I and II) obtained on day 28 after vaccination. Pie charts display number of samples with (a) specific T cells or (b) IFNγ T cell responses to CoVac-1-embedded peptides (pos, positive; neg, negative; n.a., not assessed). Dots represent frequencies of peptide-specific T cells shown for individual donors with detected T cell responses only. (c) Frequencies of functional CoVac-1‐induced CD4+ T cells in study participants prior to vaccination (day 1) and at day 28 following vaccination using intracellular cytokine (IFNγ, TNF, and IL-2) and surface marker staining (CD107a). The right graph displays the proportion of samples revealing difunctional (2), trifunctional (3), or tetrafunctional (4) T cell responses. (ac) Box plots or combined box-line plots show median with 25th or 75th percentiles, and min/max whiskers, two-sided Wilcoxon signed-rank test. no, number; pos, positive. Source Data
Extended Data Fig. 7
Extended Data Fig. 7. Vaccine-induced IFNγ T cell response to CoVac-1 peptides affected by mutations of SARS-CoV-2 variants of concern (VOC).
CoVac-1-induced T cell response to the single wild-type (WT) CoVac-1 peptides (P2_nuc (nucleocapsid), P3_spi (spike), P6_ORF8 (open reading frame 8)) in comparison to corresponding peptides comprising mutations of B.1.1.7-Alpha and B.1.351-Beta VOC were assessed by ex vivo IFNγ ELISPOT assay for (a) P2_nuc, (b) P3_spi, and (c) P6_ORF8 using PBMCs from study participants (n = 4) collected on day 28 after CoVac-1 vaccination. Source Data

References

    1. Nelde A, et al. SARS-CoV-2-derived peptides define heterologous and COVID-19-induced T cell recognition. Nat. Immunol. 2021;22:74–85. - PubMed
    1. Bilich T, et al. T cell and antibody kinetics delineate SARS-CoV-2 peptides mediating long-term immune responses in COVID-19 convalescent individuals. Sci. Transl. Med. 2021;13:eabf7517. - PMC - PubMed
    1. WHO. Weekly epidemiological update on COVID-19. WHOhttps://www.who.int/docs/default-source/coronaviruse/situation-reports/2... (2021).
    1. Zhou F, et al. Clinical course and risk factors for mortality of adult inpatients with COVID-19 in Wuhan, China: a retrospective cohort study. Lancet. 2020;395:1054–1062. - PMC - PubMed
    1. Ramasamy MN, et al. Safety and immunogenicity of ChAdOx1 nCoV-19 vaccine administered in a prime-boost regimen in young and old adults (COV002): a single-blind, randomised, controlled, phase 2/3 trial. Lancet. 2021;396:1979–1993. - PMC - PubMed

Publication types

MeSH terms

Supplementary concepts